• 概要
  • レビュー
  • コメント

Forex Factory News Alert


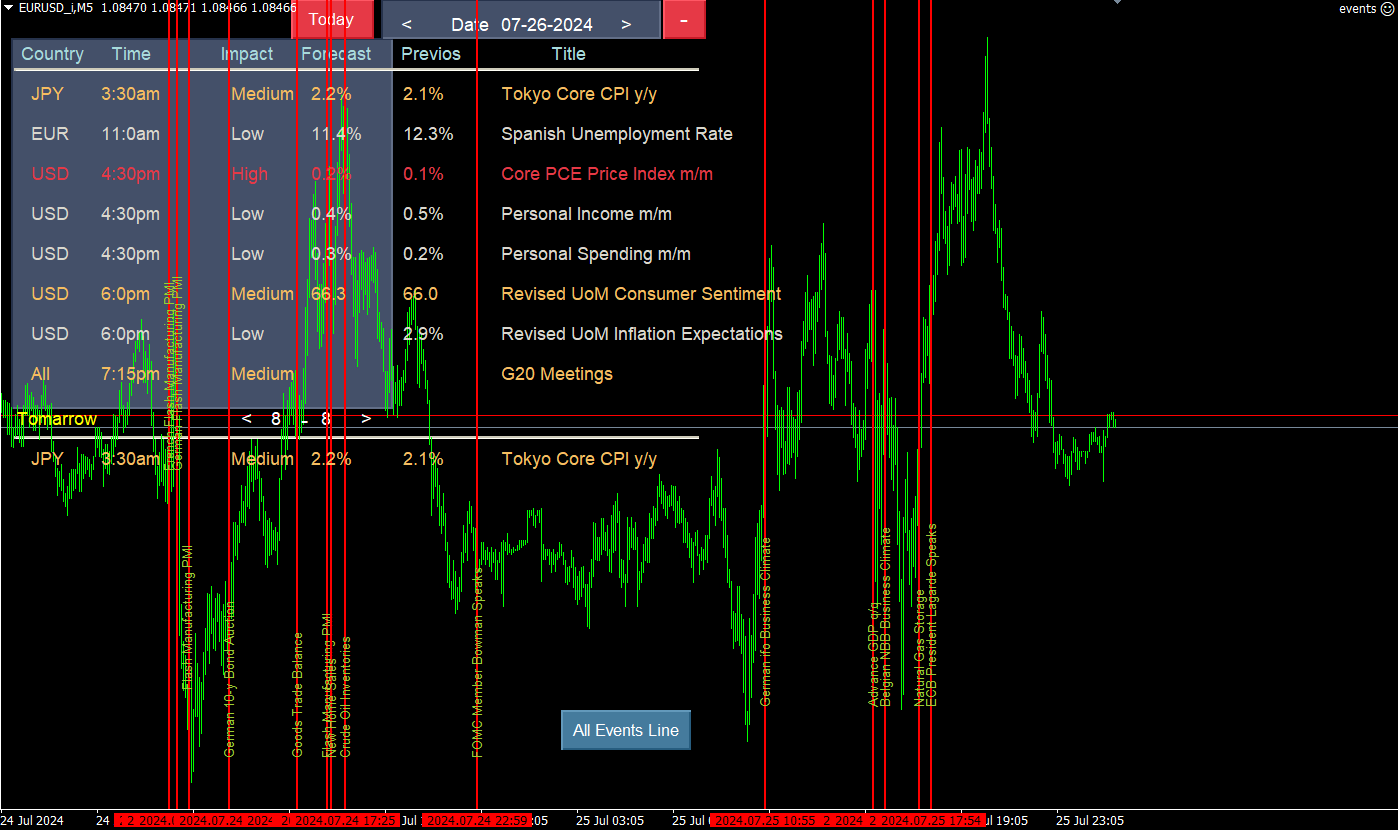
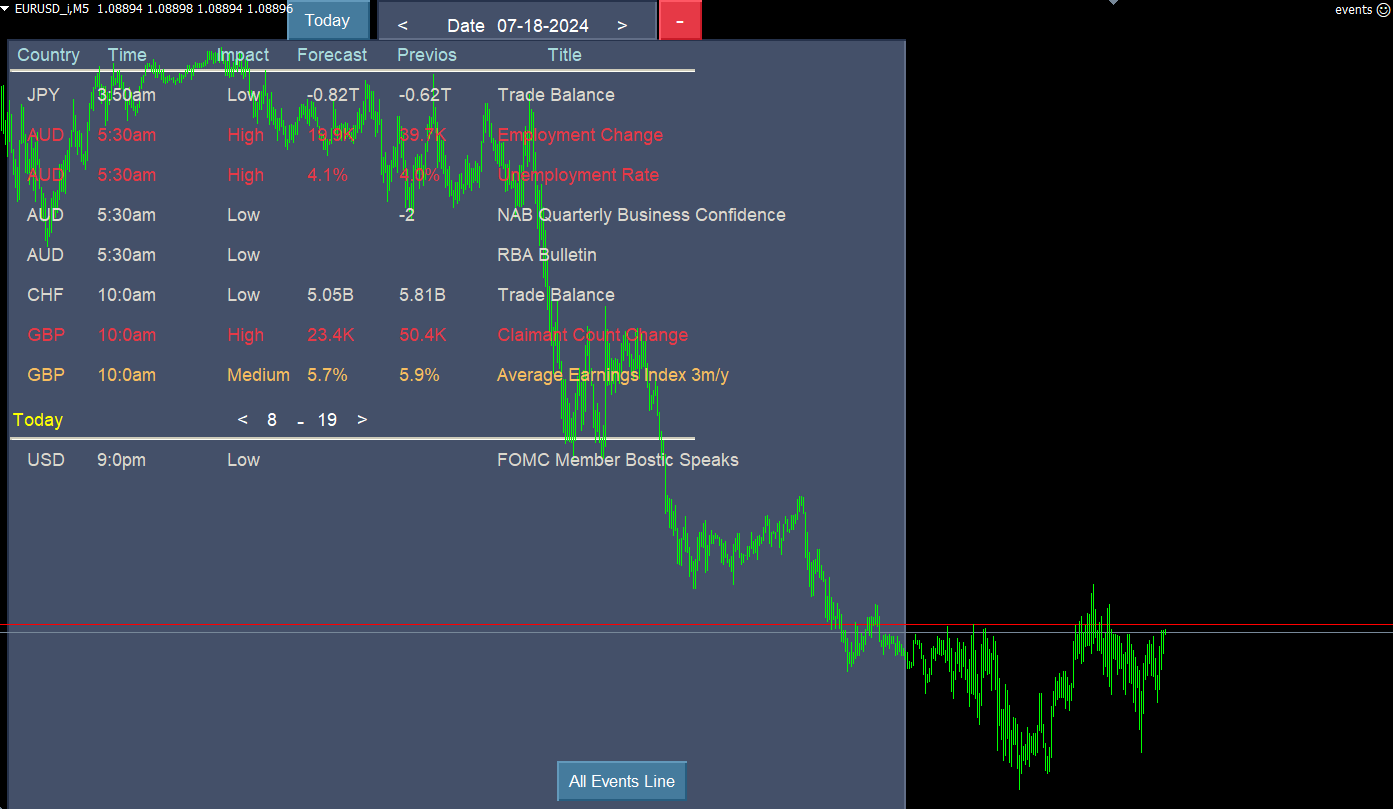
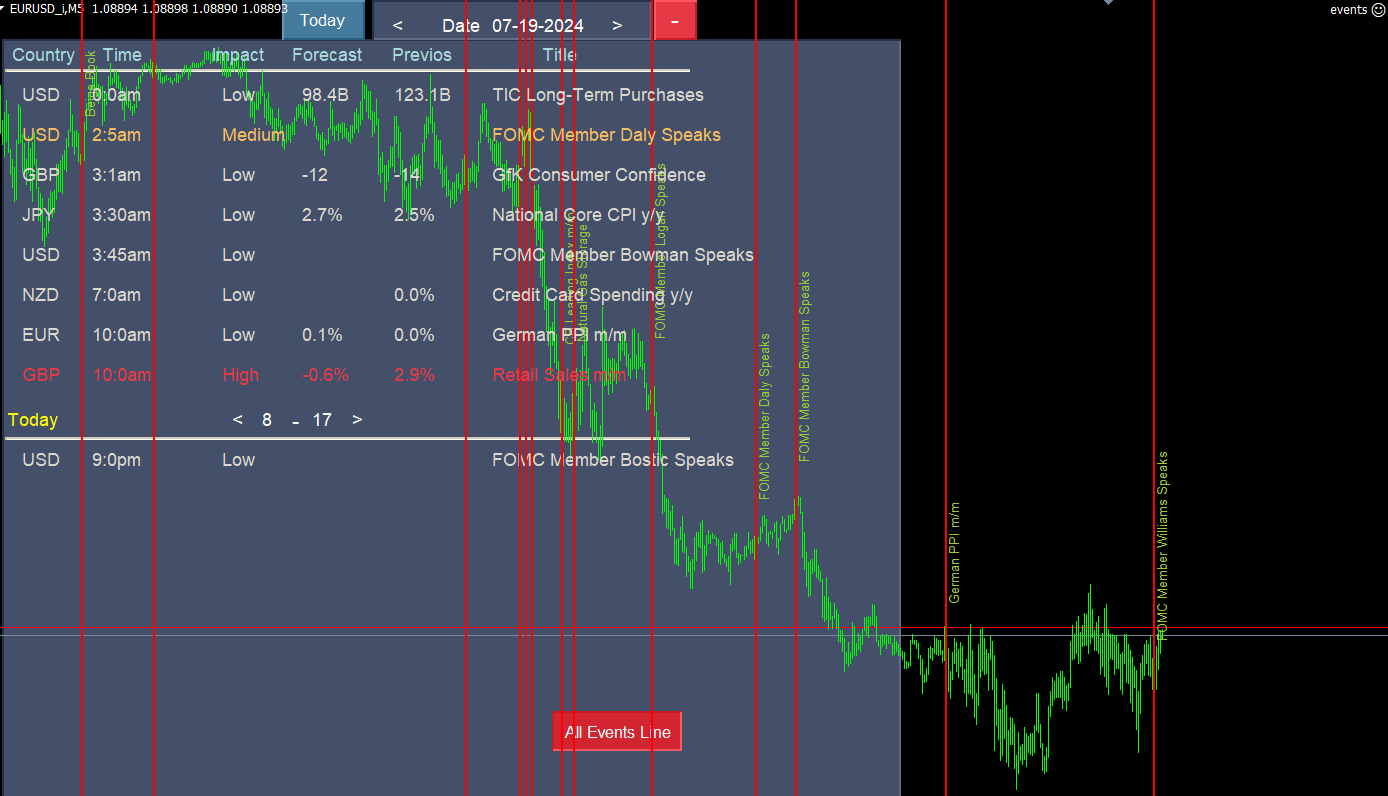
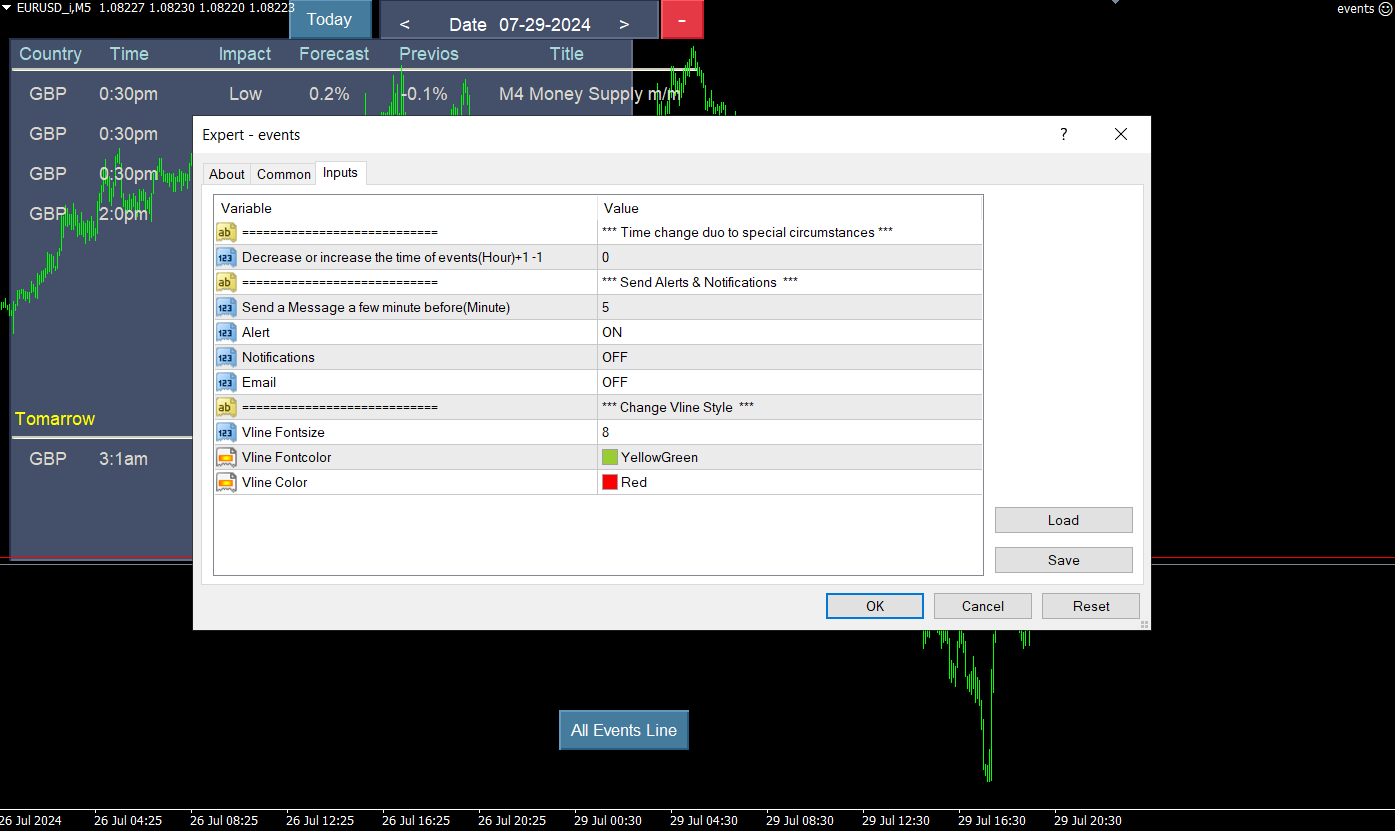
This feature shows a week's worth of news with a time shift based on your location. You can adjust the clock forward or backward for different purposes, all within the program. Before the news event, you will be alerted with a message and a vertical line. High priority news is displayed in red, medium in orange, and low priority news in gray. The "All Event Line" button allows you to view all the past news in the current week, along with their titles and corresponding lines.


 A crucial note: You need to add the following address from the Tools menu to the Options in the Expert tab.


The impact of significant events on the foreign exchange (forex) market cannot be overstated. These events, whether political, economic, or geopolitical in nature, can trigger substantial volatility in currency prices, creating both risks and opportunities for forex traders. Sudden shifts in monetary policies, macroeconomic indicators, or global trade dynamics can lead to rapid fluctuations in exchange rates, requiring traders to closely monitor market developments and adjust their strategies accordingly. Effective risk management and a deep understanding of the factors influencing currency markets are essential for traders to navigate the challenges posed by these impact events and potentially capitalize on the resulting price movements. Successful forex traders must remain vigilant, continuously analyze market data, and employ robust risk mitigation techniques to ensure they are well-equipped to manage the risks and seize the opportunities presented by the dynamic and ever-evolving forex landscape.

おすすめのプロダクト
Fibonacci retracements can be used to draw support lines, identify resistance levels, place stop-loss orders and set target prices. The Advanced Automatic Fibonacci retracements draws automatically all the levels. You have a lot of options to choose. For exemple you can use the tracements of another time frame (MTF) in the current chart, you can also choose between the closest level or less close to draw the retracements. You can also add 2 levels of your choice. You can add levels extensions o
YK-Fibo Pivot Indicator: Trade Smarter with Fibonacci Pivot Points The YK-Fibo Pivot Indicator is a powerful technical analysis tool that combines the precision of Fibonacci retracements with the insights of Pivot Points. Whether you're a novice or seasoned trader, this indicator empowers you to spot profitable opportunities in the market with ease. Why Choose YK-Fibo Pivot? Pinpoint Support & Resistance: By calculating Fibonacci levels based on the previous day's high, low, and close prices, y
Like you when I first started trading, It was overwhelming...learning about indicators, about lotsize, leverage and many more things. Its been almost 3 years. I am more knowledgeable in trading. My trading continues to improve as I work on my strategy, technical analysis, trading psychology and trade management. One thing I am not worried about though is being able to close my trades quicky if a trade goes against me or if the trade has reached my take profit level with the help of my Close Tr
VR Cub
Vladimir Pastushak
VR Cub は、質の高いエントリーポイントを獲得するためのインジケーターです。このインジケーターは、数学的計算を容易にし、ポジションへのエントリーポイントの検索を簡素化するために開発されました。このインジケーターが作成されたトレーディング戦略は、長年にわたってその有効性が証明されてきました。取引戦略のシンプルさはその大きな利点であり、初心者のトレーダーでもうまく取引することができます。 VR Cub はポジション開始ポイントとテイクプロフィットとストップロスのターゲットレベルを計算し、効率と使いやすさを大幅に向上させます。取引の簡単なルールを理解するには、以下の戦略を使用した取引のスクリーンショットを見てください。 設定、設定ファイル、デモ版、説明書、問題解決方法は、以下から入手できます。 [ブログ] レビューを読んだり書いたりすることができます。 [リンク] のバージョン [MetaTrader 5] エントリーポイントの計算ルール ポジションをオープンする エントリーポイントを計算するには、VR Cub ツールを最後の高値から最後の安値までストレッチする必要があります。
Crazy Dancing moving RES/SUP Levels Automatic redrawing of moving Supports and resistances levels  to indicate price breaking supports (signal SELL)  or breaking resistance levels (signal BUY) Very simple appearing indicator but very clever and smart too !!!! Main Inputs: # of bars for the support and resistances levels + the initial shift from start + moving average for filter signaling Smaller values for bars /shift inputs when using Higher Time frames (D1-H4) and the reverse higher values for
All Symbols   AND  All Time frames Scan                                                                                                                 Document Introduction   The ABCD is a basic harmonic pattern. The ABCD pattern is a visual, geometric chart pattern comprised of three consecutive price swings. It looks like a diagonal lightning bolt and can indicate an upcoming trading opp
Now, you have your own AUTO-CLOSE program ! Once your account target or drawdown hits, all open orders will be closed automatically. ========================================== INPUTS: Account target: Put the exact account target. Once the equity hits it or went above that, all orders closed. Please add buffer to consider slippage. Use fixed value or dynamic value: Choose whether you will need a fixed value or dynamic value for drawdown.  DYNAMIC SETTINGS: Equity-based or Balance-based drawdown:
This trading system requires the user to manually add Fibonacci, trend lines, horizontal lines, channel to perform semi-automatic or manual trading. The trading system can also be used in the tester. Trading panel provides: spread information margin information free marging Information The swap information to order for lots (requires your dealer support)
トレンドキャッチャー: アラートインジケーター付きのトレンドキャッチャーストラテジーは、市場トレンドやポテンシャルなエントリーポイントやエグジットポイントを特定するのに役立つ多目的な技術分析ツールです。動的なトレンドキャッチャーストラテジーを備えており、市場状況に適応してトレンドの方向を明確に視覚化します。トレーダーは、自身の好みやリスク許容度に合わせてパラメーターをカスタマイズできます。このインジケーターはトレンドの識別を支援し、ポテンシャルなリバーサルをシグナルし、トレイリングストップのメカニズムとして機能し、市場への迅速な対応のためのリアルタイムアラートを提供します。 特徴: - トレンドの識別:上昇トレンドと下降トレンドをシグナルします。 - トレンドのリバーサル:ローソク足の色が上昇から下降に変わった場合やその逆の場合に、ポテンシャルなリバーサルを警告します。 - リアルタイムアラート:新しいトレンドの識別に対するアラートを生成します。 推奨事項: - 通貨ペア:EURUSD、AUDUSD、XAUUSDなど... - タイムフレーム:H1。 - アカウン
FREE
Automatic fibonacci with alerts is an indicator that automatically plots a fibonacci retracement based on the number of bars you select on the BarsToScan setting in the indicator. The fibonacci is automatically updated in real time as new highest and lowest values appear amongst the selected bars. You can select which level values to be displayed in the indicator settings. You can also select the color of the levels thus enabling the trader to be able to attach the indicator several times with d
Free automatic Fibonacci is an indicator that automatically plots a Fibonacci retracement based on the number of bars you select on the BarsToScan setting in the indicator. The Fibonacci is automatically updated in real time as new highest and lowest values appears amongst the selected bars. You can select which level values to be displayed in the indicator settings. You can also select the color of the levels thus enabling the trader to be able to attach the indicator several times with differe
FREE
The main idea of this indicator is rates analysis and prediction by Fourier transform. The indicator decomposes exchange rates into main harmonics and calculates their product in future. The indicator shows 2 price marks in history, depicting price range in the past, and 2 price marks in future with price movement forecast. Buy or sell decision and take profit size are displayed in a text label in the indicator window. The indicator uses another indicator as an engine for calculations - FreqoMet
The indicator provides a superior alternative to price action analysis. It enables the identification of normalized patterns, which are then transformed into a graphical representation to forecast future steps within a time series. In the top-left corner, you'll find information regarding the expected prediction accuracy, determined through a complex MSQE calculation. You have the flexibility to adjust the time window, making it easy to validate the indicator's performance. Additionally, you can
Requirements Optimized to work with   EURUSD-EURCHF-USDJPY, AUDUSD-CADJPY-AUDNZD, CHFJPY-NZDJPY-NZDUSD For timeframe 4H. *(Minimum recommended deposit is $300 for each Pair) for initial lot set to 0.10, My favorite Pair are (CHFJPY-NZDJPY-EURUSD-AUDNZD-USDJPY) Warning it will be SALE only 5 Copys at 60$ Then it will be update up to 200$  You can use it the way it is, For new Set Files will be add on (Comments) ECN broker with low spread is recommended to get better results. Setup is
TLFv1
Thanakorn Suphakornthongchot
Short-Term Fibonacci Trading Strategy with Clear TP and SL Strategy: Timeframe: M15 Indicator: Fibonacci Retracement Fibonacci Levels: Buy Entry: 38.2%, 50.0% Sell Entry: 61.8%, 78.6% TP/SL Placement: SL: Below/above the Fibonacci level used for entry Minimum Capital: $100 Instruments: Metals: Gold (XAUUSD) The recommended spread starts from 10 to 25, and should not exceed 28.
Are you tired of drawing Support & Resistance levels for your Quotes? Are you learning how to spot Support & Resistances? No matter what is your case, Auto Support & Resistances will draw those levels for you! AND, it can draw them from other timeframes, right into you current chart, no matter what timeframe you are using... You can also Agglutinate regions/zones that are too much closer to each other and turning them into one single Support & Resistance Level. All configurable.
Trade with Gann on your side!! MASTER CIRCLE 360 CIRCLE CHART, originally created by Gann admitted that this is “The Mother of all charts”. It is one of the last studies that this great trader left for us. The numeric tab le is apparently quite simple like all the tables and is based on square numbers, the SQUARE OF 12 and is by evolution, one of the most important square numbers. Here we can find CYCLE, PRICE AND TIME thanks to angles and grades, to show past and future support and resistance.
Auto SLTP Maker MT4  is an assistant for all those who forget to set StopLoss and/or TakeProfit in deal parameters, or trade on a very fast market and fail to place them in time. This tool automatically tracks trades without StopLoss and/or TakeProfit and checks what level should be set in accordance with the settings. The tool works both with market and pending orders. The type of orders to work with can be set in the parameters. It can track either trades for the instrument it runs on, or all
This scanner is a tool used to support trading. Scanner searches on a wide market, in real time setups, created by mutual arrangements of candles (candles pattern). Its basic features are:  8 implemented trading setups (it is possible to add further setups, additional versions of the scanner),  the possibility of simultaneous scanning, all financial instruments available on the platform,  the possibility of simultaneous scanning, in all timeframes available on the platform,  the ability to manua
The indicator shows the potential trend direction by cyclical-wave dependence. Thus, all the rays of the intersection will be optimal rays, in the direction of which the price is expected to move, taking into account the indicator period. Rays can be used as a direction for potential market movement. But we must not forget that the approach must be comprehensive, the indicator signals require additional information to enter the market.
ICT Kill zone and Macros Indicator mark and display the following zone times on the chart: Kill zones   Kill zone Forex Asian London Open New York Open London Close Central Bank Dealing range Kill zone Indices Asian London Open New York AM New York Lunch New York PM Power Hour Macros London 1 London 2 New York Am 1 New York AM 2 New York Lunch New York PM 1 New York PM 2 Silver bullet London Open New York AM New York PM Sessions Asian London New York Chart The display of  Kill zone ,
"The trend is your friend" is one of the best known sayings in investing, because capturing large trendy price movements can be extremely profitable. However, trading with the trend is often easier said than done, because many indicators are based on price reversals not trends. These aren't very effective at identifying trendy periods, or predicting whether trends will continue. We developed the Trendiness Index to help address this problem by indicating the strength and direction of price trend
Noize Absorption Index - is the manual trading system that measures the difference of pressure between bears forces and bulls forces. Green line - is a noize free index that showing curent situation. Zero value of index shows totally choppy/flat market.Values above zero level shows how powerfull bullish wave is and values below zero measures bearish forces.Up arrow appears on bearish market when it's ready to reverse, dn arrow appears on weak bullish market, as a result of reverse expectation. S
Candlestick Pattern Scanner is a multi-timeframe and multi-symbol dashboard and alert system that checks all timeframes and currency pairs for different candlestick patterns that are formed in them. Scanner is integrated with support and resistance zones so you can check the candlestick patterns in the most important areas of the chart to find breakout and reversal patterns in the price chart. Download demo version   (works on M1,M5,M30,W1 timeframes) Read the full description of scanner paramet
The main function of the indicator is to draw the target lines (support and resistance lines). The lines are plotted according to a special fractal algorithm. The lines are calculated with consideration of the zero bar. A different, more complicated calculation algorithm is used on the zero bar, in contrast to the other bars. This allows reacting to the market situation in real time, but on the other hand, redrawing is possible on the zero bar. If necessary, the zero bar can be omitted from calc
Fibonacci SR Indicator This indicator creates support and resistance lines. This indicator is based on Fibonacci Retracement and Extension levels. It will consider many combinations of the Fibonacci levels and draw support/resistance lines based on these. This indicator uses tops and bottoms drawn by the ZigZag indicator in its calculations. The ZigZag can also be drawn on the chart, if necessary. The indicator considers many combinations of past reversal points and Fibonacci ratio levels, and
FREE
This indicator depends on Fibonacci lines but there is a secret lines i used them, by using FiboRec indicator you will be able to know a lot of important information in the market such as: Features You can avoid entry during market turbulence. You can enter orders in general trend only. You will know if the trend is strong or weak. Signal Types and Frame used You can use this indicator just on H1 frame. Enter buy order in case Candle break out the square area and closed over it, at least 20
Custom Fibonacci
Udawaththa Kankanamge Don Raveen Asela Jayasingha
Customizable Fibonacci Lines Up to 9 Fibonacci levels Customize line color, line style and line width for each Fibonacci line Easily adjustable Fibo object is created in background so you can use with indicators and EAs How to use: Load the indicator to the chart and press "f" on keyboard and click anywhere on the chart to start drawing You can customize each line after its drawn as well as input window of the indicator
The Th3Eng PipFinite indicator is based on a very excellent analysis of the right trend direction with perfect custom algorithms. It show the true direction and the best point to start trading. With StopLoss point and Three Take Profit points. Also it show the right pivot of the price and small points to order to replace the dynamic support and resistance channel, Which surrounds the price. And Finally it draws a very helpful Box on the left side on the chart includes (take profits and Stop loss
Price Ray MT4
Keni Chetankumar Gajanan -
4 (3)
Price Ray indicator is a utility that will improve the way you trade. Primarily, it shows the Bid, Ask or Last price as a line ray which beams till the current candle, last visible chart candle or extended to all candle bars. The enhanced features in this indicator provide information in an area where you focus most, right next to the current candle. You can select text to be shown above or below the Price ray. The indicator is fully customizable, allowing it to fit any strategy requirements. Th
FREE
このプロダクトを購入した人は以下も購入しています
Trade Assistant MT4
Evgeniy Kravchenko
4.44 (186)
取引 ごとのリスクの 計算、新規注文 の 簡単 な 設置、部分的 な 決済機能 を 持 つ 注文管理、 7 種類 のトレーリングストップなど 、便利 な 機能 を 備 えています 。 注意、アプリケーションはストラテジーテスターでは機能しません。 Manual, Description, Download demo ライン機能 チャート上にオープニングライン、ストップロス、テイクプロフィットを表示します。この機能により、新規注文を簡単に設定することができ、注文を出す前にその特徴を確認することができます。   リスク計算 リスク計算機能は、設定されたリスクとストップロス注文のサイズを考慮して、新規注文のボリュームを計算します。ストップロスの大きさを自由に設定できると同時に、設定したリスクを守ることができます。 Lot calc ボタン - リスク 計算 を 有効 / 無効 にします 。 Risk フィールドでは 、必要 なリスクの 値 を 0 から 100 までのパーセンテージまたは 預金通貨 で 設定 します 。 設定」 タブで 、 リスク 計算 の 種類 を 選択 します :
価格が一瞬で変わる可能性のある市場では、注文はできるだけ簡単にすべきだと思いますか? Metatraderでは、注文を開くたびに、開始価格を入力し、損失を止めて利益を得るウィンドウと、取引サイズを開く必要があります。金融市場の取引では、初期預金を維持し、それを増やすために資本管理が不可欠です。それで、あなたが注文をしたいとき、あなたはおそらくあなたがどれくらいの大きさの取引を開くべきか疑問に思いますか?この単一の取引であなたの預金の何パーセントを危険にさらすべきですか?この取引からどれだけの利益を得ることができますか?また、リスクに対する利益の比率はどのくらいですか?トレードサイズを設定する前に、トレードサイズがどうあるべきかという質問に対する答えを得るために必要な計算を行います。 これらすべてを自動的に行うツールがあると想像してみてください。チャートを開き、市場分析を行い、エントリーポイント、ディフェンスポイント(ストップロス)、ターゲット(テイクプロフィット)を水平線でマークし、最後にリスクのレベルを定義します。利用可能な資本の%として、このトランザクションで負担することができ、こ
Local Trade Copier EA MT4
Juvenille Emperor Limited
5 (85)
Local Trade Copier EA MT4 による、驚くほど高速な取引コピーを体験してください。1分で簡単にセットアップできるこの取引コピー機は、同じWindowsコンピュータまたはWindows VPS上の複数のMetaTrader端末間で取引をコピーすることができ、0.5秒未満の高速コピースピードを実現します。 初心者であろうとプロのトレーダーであろうと、 Local Trade Copier EA MT4 には、あなたの特定のニーズに合わせてカスタマイズするための幅広いオプションが用意されています。これは、利益の可能性を高めたい人にとって究極のソリューションです。 今すぐ試してみて、これが市場で最も速くて簡単なトレードコピー機である理由を理解してください。 ヒント: デモアカウントで Local Trade Copier EA MT4 デモバージョンをダウンロードして試すことができます: ここ ダウンロードした無料のデモ ファイルを MT4 >> ファイル >> データ フォルダを開く >> MQL4 >> Experts フォルダに貼り付けて、ターミナルを再起動し
The product will copy all telegram signal to MT4   ( which you are member  ) , also it can work as remote copier.  Easy to set up, copy order instant, can work with almost signal formats, image signal, s upport to translate other language to English Work with all type of channel or group, even channel have "Restrict Saving Content", work with  multi channel, multi MT5 Work as remote copier: with signal have ticket number, it will copy exactly via ticket number. Support to backtest signal. How to
Exp COPYLOT CLIENT for MT4
Vladislav Andruschenko
4.66 (67)
MetaTrader4のコピー機を取引します。     それは任意の口座からの外国為替取引、ポジション、注文をコピーします。 それは最高の貿易コピー機の1つです     MT4 - MT4、MT5 - MT4     のために     COPYLOT MT4     バージョン(または     MT4 - MT5  MT5 - MT5     のために     COPYLOT MT5     バージョン)。 MT5のバージョン 完全な説明   +DEMO +PDF 購入する方法 インストールする方法     ログファイルの取得方法     テストと最適化の方法     Expforex のすべての製品 のコピー機 バージョン       MetaTrader 5 ターミナル(   МТ5 - МТ5、МТ4 - МТ5   )-   コピーロットクライアントMT5 独自のコピーアルゴリズムにより、すべての取引がマスターアカウントからクライアントアカウントに正確にコピーされます。 また、動作速度が速いことでも知られています。タフなエラー処理。 強力な機能セット。 プログ
TradePanel MT4
Alfiya Fazylova
4.91 (89)
Trade Panel は、多機能の取引アシスタントです。 このアプリケーションには手動取引用の 50 以上の機能が含まれており、ほとんどの取引アクションを自動化できます。 購入する前に、デモ アカウントでデモ バージョンをテストできます。 デモは こちら から。 詳しい手順は こちら をご覧ください。 取引。 ワンクリックで基本的な取引操作を実行できます。 未決の注文とポジションをオープンする 注文のグリッドを開く 未決の注文とポジションを決済する ポジションの反転(買いを閉じて売りをオープンする、または売りを閉じて買いをオープンする) ポジションをロックする(反対のポジションをオープンすることで、売りポジションと買いポジションの量を等しくします) すべてのポジションを部分的に決済します。 すべてのポジションのテイクプロフィットやストップロスを共通のレベルに設定します。 すべてのポジションのストップロスを損益分岐点レベルに設定します。 注文とポジションをオープンする際に、次のことが可能になります。 確立されたリスクに応じて取引量の自動計算を使用します。 ワンクリックで複数の注文を開き
Trade copier MT4
Alfiya Fazylova
4.68 (31)
Trade Copierは、取引口座間の取引をコピーして同期するように設計された専門的なユーティリティです。 コピーは、同じコンピューターまたはvps にインストールされている、サプライヤーのアカウント/端末から受信者のアカウント/端末に行われます。 購入する前に、デモ アカウントでデモ バージョンをテストできます。 デモ版 こちら 。 詳細な説明は こちら 。 主な機能と利点: MT5ネッティングアカウントを含む、MT4> MT4、MT4> MT5、MT5> MT4のコピーをサポートします。 高いコピー速度(0.5秒未満)。 ベンダーモードと受信者モードは同じ製品内に実装されています。 チャートから直接リアルタイムでコピーを制御できる、簡単で直感的なインターフェイス。 接続が切断されたり、端末が再起動されたりしても、設定と位置が失われることはありません。 コピーするシンボルを選択できます。また、受信者のシンボルを置き換えることもできます(例:EURUSD> USDJPY)。 バックコピーをサポートします。 特定の注文のみのコピーを有効にする機能。 取引開始価格の最大差と最大遅延時間を
Trade Manager は、リスクを自動的に計算しながら、取引を迅速に開始および終了するのに役立ちます。 過剰取引、復讐取引、感情的な取引を防止する機能が含まれています。 取引は自動的に管理され、アカウントのパフォーマンス指標はグラフで視覚化できます。 これらの機能により、このパネルはすべてのマニュアル トレーダーにとって理想的なものとなり、MetaTrader 4 プラットフォームの強化に役立ちます。多言語サポート。 MT5バージョン  |  ユーザーガイド + デモ Trade Manager はストラテジー テスターでは機能しません。 デモについてはユーザーガイドをご覧ください。 危機管理 % または $ に基づくリスクの自動調整 固定ロットサイズを使用するか、ボリュームとピップに基づいた自動ロットサイズ計算を使用するオプション RR、Pips、または価格を使用した損益分岐点ストップロス設定 トレーリングストップロス設定 目標に達したときにすべての取引を自動的に終了するための 1 日あたりの最大損失 (%)。 過度のドローダウンからアカウントを保護し、オーバートレードを防ぎま
MT4 to Telegram Signal Provider は使いやすく、完全にカスタマイズ可能なツールで、Telegramに信号を送信し、あなたのアカウントを信号提供者に変えることができます。 メッセージのフォーマットは 完全にカスタマイズ可能です! しかし、簡単な使用のために、あらかじめ定義されたテンプレートを選択し、メッセージの特定の部分を有効または無効にすることもできます。 [ デモ ]   [ マニュアル ] [ MT5バージョン ] [ Discordバージョン ] [ Telegramチャンネル ] セットアップ ステップバイステップの ユーザーガイド が利用可能です。 Telegram APIの知識は必要ありません。開発者が必要なものをすべて提供します。 主要機能 購読者に送信される注文の詳細をカスタマイズする機能 例えばブロンズ、シルバー、ゴールドなど、階層型のサブスクリプションモデルを作成できます。ゴールドサブスクリプションでは、すべての信号が得られますなど。 ID、シンボル、またはコメントによる注文のフィルタリング 注文が実行されたチャート
Tired of complex order placement and manual calculations? Trade Dashboard is your solution. With its user-friendly interface, placing orders becomes effortless, by a single click, you can open trades, set stop loss and take profit levels, manage trade lot size, and calculate risk to reward ratios, allowing you to only focus on your strategy. Say goodbye to manual calculations and streamline your trading experience with Trade Dashboard. Download   demo version  right now. You can find details
Grid Manual MT4
Alfiya Fazylova
4.74 (19)
「Grid Manual」は、注文のグリッドを操作するための取引パネルです。 ユーティリティはユニバーサルで、柔軟な設定と直感的なインターフェイスを備えています。 それは、損失を平均化する方向だけでなく、利益を増やす方向でも注文のグリッドで機能します。 トレーダーは注文のグリッドを作成して維持する必要はありません。 すべてが「Grid Manual」によって行われます。 注文を開くだけで十分であり、「Grid Manual」は注文のグリッドを自動的に作成し、非常に閉じるまでそれに付随します。 完全な説明とデモバージョン ここ。 ユーティリティの主な機能と機能 ユーティリティは、モバイル端末から開かれた注文を含め、あらゆる方法で開かれた注文を処理します。 「制限」と「停止」の2種類のグリッドで機能します。 グリッド間隔の計算には、固定と動的(ATRインジケーターに基づく)の2つの方法で機能します。 オープンオーダーグリッドの設定を変更できます。 チャート上の各注文グリッドの損益分岐点を表示します。 各注文グリッドの利益率を表示します。 ワンクリックでグリッドから収益性の高い注文を閉じるこ
The top-selling EAs on the market cost a lot and one day they are suddenly gone. This is because one strategy will not work in the forex market all the time. Our product is unique from all others in the MQL Marketplace because our EA comes with 34+ built-in indicators that allow adding more strategies every time.  You build your strategy and keep updating it. If one strategy does not work, simply build another all using only one EA. This is All-In-One EA in this market place. You can use as trad
I present to your attention a powerful utility for predicting the future movement of an asset based on W.D. Ganna’s law of vibration. This utility analyzes the selected market model and provides codes for future possible market movement patterns. If you enter the selected code into the appropriate box, you will receive a forecast of the potential market movement. The utility has the ability to display several potential forecast models. The forecast is not yet tied to time and price and gives th
TakePropips TradePad Pro
Eric John Pajarillaga Aldana
5 (4)
TakePropips TradePad Pro には、強力なトレード マネージャー、通貨強度メーター、アカウント レポート ツール、リスク管理ツールなどが含まれています。 これは、最も高度な外国為替取引マネージャーおよび取引アシスタントの 1 つです。これは、貿易取引をより効率的に管理したいトレーダーにとって完璧なソリューションです。 ユーザー マニュアルはブログ記事からダウンロードできます:   https://www.mql5.com/en/blogs/post/751180 このトレーディング システムは、ストラテジー テスターでテストできます (ビジュアル モードを有効にします)。ライブ チャートでテストしたい場合は、7 日間の試用版を入手するようにメッセージを送ることもできます。 詳細については、説明の下にあるビデオ チュートリアルも利用できます。 ご不明な点やサポートが必要な場合は、お気軽にお問い合わせください。喜んでお手伝いさせていただきます。 TradePad Pro は、すべての外国為替ペア、金属、コモディティ、指数、および仮想通貨で動作します。 主な特徴
プライスアクションツールキットEAは主にスカルパー向けに設計されていますが、すべての時間枠で使用して、ストップレベルに基づいて正しく計算されたロットサイズで市場に迅速に参入できます。注文)そして市場が動くにつれてストップを調整して利益を上げます。 使用するすべての機能、設定、およびベストプラクティス戦略の完全なリストについては、ここをクリックしてください:https:// www.mql5.com/en/blogs/post/748072 リスクベースのエントリ クイックオーダーボタンを使用すると、アカウントのリスクの割合に基づいてポジションに移動できます。選択したリスクとストップロスまでの距離に基づいて、ロットサイズが自動的に計算されます。そのため、ブローカーが0.01ロットのサイズ設定を使用できることを確認する必要があります。0.10または1.00のロット増分を使用するように強制された場合、ブローカーは機能しません。 高速取引実行ボタン チャート上にクイックトレード実行ボタンを配置し、トレードを即座に自動的に開いたり、閉じたり、調整したりします。通常のエントリーボタン
NEW VERSION!  Open Multiple Trades on MT4 in 1 click at one price. Enter the Lot size Specify the number of trades you want to open Choose whether you want TP SL or Trailing Stop Once you are done, click Buy or Sell Open Multiple Pending Orders on MT4 in 1 click at one price. Enter the Lot size Specify the gap from the current price, where you want to place the pending order Specify the number of trades you want to open Choose whether you want TP SL or Trailing Stop Once you are done, click Buy
Summer 40% discount ($149 -> $88) Everything for chart Technical Analysis indicator mt4 in one tool Draw your supply demand zone with rectangle and support resistance with trendline and get alerts to mobile phone or email alert -  Risk reward indicator Video tutorials, manuals, DEMO download   here .  Find contacts on my   profile . 1.   Extended rectangles and trendlines Object will be extended to the right edge of the chart when price will draw new candles on chart. This is rectangle extend
Trade Copier Pro is a tool to copy trade remotely to MT4, MT5 and cTrader accounts at different computers/locations over internet. This is an ideal solution for you if you are a signal provider and want to copy your trades to other receivers globally on your own rules. One provider can copy trades to multiple receivers and one receiver can get trade from multiple providers as well. The provider can even set the subscription expiry for each receiver, so that receiver will not be able to receive t
The most advanced news filter and drawdown limiter on MQL market NEW: Take a Break can be backtested against your account history! Check the " What's new " tab for details. Take a Break has evolved from a once simple news filter to a full-fledged account protection tool. It pauses any other EA during potentially unfavorable market conditions and will continue trading when the noise is over. Typical use cases: Stop trading during news/high volatility (+ close my trades before). Stop trading when
Click and Go Trade Manager, the ultimate solution for seamless trading execution. With a simple click on the chart, you can effortlessly define your stop loss, entry price, and target levels. No more hassle of inputting values manually - it's made incredibly intuitive and easy. Embedded risk management is a key feature of our Trade Manager. We understand the importance of protecting your investments, which is why the Click and Go Trade Manager incorporates risk management. When placing orders,
EA Hedger
Sergej Chukhista
4.67 (3)
トレーディングアドバイザーを購入したり、シグナルをサブスクライブしたり、手動でトレードしたりしましたか?!リスク管理を忘れないでください。 EA Hedger は、ヘッジを使用してリスクを管理できるようにする多くの設定を備えたプロのトレーディングユーティリティです。 ヘッジは、すでに開いているポジションとは反対のポジションを開くことを含む取引手法です。ヘッジの助けを借りて、ポジションを完全にまたは部分的にブロック(ロック)することができます。 この製品を購入することが有益なのはなぜですか。 信頼性 -アドバイザーは徹底的にチェックされ、テストされています 有用性 -Expert Advisorは実際の取引で使用され、その作業に効果的です パフォ ーマンス-ヘッジを使用した取引の結果は、ヘッジなしの取引の結果よりも大幅に優れています 可用性 -アドバイザーのコストは1か月あたりわずか4.91ドルまたは1日あたり0.17ドルです-これは1〜2スプレッドです サポート –ディスカッションでは、販売者に質問したり、アドバイスを受けたりすることができます 開発 -製品への希望を書くことが
Comprehensive on chart trade panel with the unique ability to be controllable from mobile as well. Plus has a library of downloadable configuration, e.g. exit rules, extra panel buttons, pending order setup and more. Please see our product video. Works with all symbols not just currency pairs. Features On chart panel plus controllable from free app for Windows, iPhone and Android Built-in script engine with library of downloadable configuration, e.g. add 'Close All Trades in Profit' button, exit
あなたの外国為替ポートフォリオを管理してください。あなたが立っている場所、何が働いているのか、そして何があなたに痛みを引き起こしているのかを即座に見てください! ここで利用可能なMT5バージョン:https:// www.mql5.com/en/market/product/58658 Trade Managerダッシュボードは、外国為替市場での現在の各ポジションが一目でわかるように設計されており、リスク管理と通貨へのエクスポージャーを理解しやすくします。 複数のポジションで徐々に市場に参入するトレーダー、またはそれらのトレーディンググリッドとバスケット戦略にとって、これは重要な情報です。ターミナル内の複数の位置を監視することは、管理が難しいことがよくあります。 不十分なリスクの活用と使用:報酬は、新しいトレーダーや一部の経験豊富なトレーダーが直面する主要な問題です。トレードマネージャーは、各通貨へのエクスポージャーを個別に示し、一度に両方向に取引しないようにします。 特徴: オープントレード-通貨ペアでソートされた現在のオープントレードをすべて表示します。ペアだけでなく
The product will copy all  Discord  signal   to MT4   ( which you are member  ) , also it can work as remote copier.  Easy to set up. Work with almost signal formats, support to translate other language to English Work with multi channel, multi MT4. Work with Image signal. Copy order instant, auto detect symbol. Work as remote copier: with signal have ticket number, it will copy exactly via ticket number. How to setup and guide: Let read all details about setup and download Discord To MetaTrade
あなたがメンバーである任意のチャンネル(プライベートおよび制限されたチャンネルを含む)からのシグナルを、直接あなたのMT4にコピーします。 このツールは、ユーザーを念頭に置いて設計されており、取引を管理および監視するために必要な多くの機能を提供しています。 この製品は、使いやすく視覚的に魅力的なグラフィカルインターフェースで提供されています。設定をカスタマイズして、数分で製品を使用開始できます! ユーザーガイド + デモ  | MT5版 | Discord版 デモを試したい場合は、ユーザーガイドを参照してください。 Telegram To MT5レシーバーは、ストラテジーテスターでは機能しません! Telegram To MT4の特長 一度に複数のチャンネルからシグナルをコピー プライベートおよび制限されたチャンネルからシグナルをコピー BotトークンやチャットIDは不要です(必要な場合は引き続き使用できます) リスク%または固定ロットを使用して取引 特定のシンボルを除外 すべてのシグナルをコピーするか、コピーするシグナルをカスタマイズするかを選択 すべてのシグナルを認識する
The Expert Advisor will help you forward all pop-up alert with screenshot from  MetaTrader 4 to Telegram channel/ group, also forward all notifications to Telegram. Parameters  -  Telegram Bot Token - create bot on Telegram and get token.  -  Telegram Chat ID  - input your Telegram user ID,  group / channel ID  -  Forward Alert - default true, to forward alert.  -  Send message as caption of Screenshot - default false, set true to send message below Screenshot  How to setup and guide  - Telegram
この製品は、ニュースタイム中にすべてのエキスパートアドバイザーと手動チャートをフィルタリングするため、急激な価格変動によるマニュアルトレードのセットアップの破壊や他のエキスパートアドバイザーによって入力された取引について心配する必要はありません。この製品には、ニュースのリリース前にオープンポジションとペンディングオーダーを処理できる完全な注文管理システムも付属しています。 The News Filter  を購入すると、将来のエキスパートアドバイザーのためにビルトインのニュースフィルターに頼る必要はなく、今後はすべてのエキスパートアドバイザーをここからフィルタリングできます。 ニュース選択 ニュースソースは、Forex Factoryの経済カレンダーから取得されます。 USD、EUR、GBP、JPY、AUD、CAD、CHF、NZD、CNYなど、任意の通貨数に基づいて選択できます。 Non-Farm(NFP)、FOMC、CPIなどのキーワード識別に基づいて選択することもできます。 影響レベルによってフィルタリングするニュースを選択することができ、低、中、高の影響範囲から選択できます
FREE SIGNAL CHANEL:  https://t.me/redfox_daily_forex_signals Time saving and fast execution Whether you’re traveling or sleeping, always know that Telegram To Mt4 performs the trades for you. In other words, Our   Telegram MT4 Signal Trader  will analyze the trading signals you receive on your selected Telegram channels and execute them to your Telegram to MT4 account. Reduce The Risk Telegram To Mt4   defines the whole experience of copying signals from   Telegram signal copier to mt4  p
News Trade EA MT4
Konstantin Kulikov
4.38 (16)
僕自身が数年間使っている便利なロボットをご紹介します。半自動モードでも完全自動モードでもお使いいただけます。 当プログラムは経済指標カレンダーで発表されるニュースをもとにした取引の柔軟な設定が可能です。戦略テスターでは確認不可です。実際の取引のみです。端末の設定メニューを開いて許可URLリストにニュースサイトを追加する必要があります。サービス > 設定 > エキスパート・アドバイザーをクリックしてください。”次のURLの WebRequestを許可する:"にチェックを入れてください。次のURLを追加してください(空白は削除します): https://  nfs.faireconomy.media 設定のモニタリングはデフォルトで完全自動モードで行われます: https://www.mql5.com/ja/signals/1447007 。似たような結果を得たい場合は任意のタイムフレームの GBPUSDチャートにエキスパート・アドバイザーを関連付けてください。(タイムフレームの種類は問いません。) 当該エキスパート・アドバイザーのためのカスタマイズ設定セットを作る場合は、ブ
What Trades Manager can do for your trades . Collect all order positions into one chart (pict. 1). All orders will be grouped by pair symbol , sum of order positions, lots, running pips, and profit/losses. All orders will be summarized and displayed at the bottom of the panel. You can set target profit, stop loss and placing stop-profit automatically to each order (pict. 4). From one chart, it will be easier to monitor and manage all orders without moving to another chart. The green color is sur
作者のその他のプロダクト
All Symbols   AND  All Time frames Scan Document Introduction   A breakout refers to when the price of an asset moves above a resistance zone or moves below a support zone. A breakout indicates the potential for a price trend to break.Break provides a potential business opportunity. A break from the top signals to traders that it is better to take a buy position or close a sell position. A breakout from the bottom signals to traders that it is better to take sell positions or close the
This is the Full Version, to get the free version please contact me. The free version works on “GBPCHF” charts. All symbols and time frames scanner. Harmonic Pattern Harmonic patterns are used in technical analysis that traders use to find trend reversals. They are considered one of the most accurate technical analysis tools, as they allow traders to predict the future price movement direction and the potential trend targets. Also, unlike many other technical tools, the number of false signal
All Symbols   AND  All Time frames Scan                                                                                                                 Document Introduction   The ABCD is a basic harmonic pattern. The ABCD pattern is a visual, geometric chart pattern comprised of three consecutive price swings. It looks like a diagonal lightning bolt and can indicate an upcoming trading opp
This is the Full Version, to get the free version please contact me. The free version works on “AUDNZD” and “XAUUSD” charts. All symbols and time frames scanner Head and Shoulder One of the most popular Price Action patterns is the Head and Shoulders pattern. The pattern has three local tops that resemble the left shoulder, head, and right shoulder. The head and shoulders chart pattern appears in all kinds of markets, including Forex, cryptocurrency, commodities, stocks, and bonds. The
This is the Full Version, to get the free version please contact me. The free version works on “USDJPY” charts. All symbols and time frames scanner. Contact me after payment to send you the User-Manual PDF File. OVER and UNDER Over & Under pattern is an advanced price action trading concept in the trading industry. The Over & Under pattern is more than a confluence pattern or entry technique than a trading strategy. It is a reversal pattern that is created after a significant obvious trend. I
This is the Full Version, to get the free version please contact me. The free version works on “GBPCHF” charts. All symbols and time frames scanner. Harmonic Pattern Harmonic patterns are used in technical analysis that traders use to find trend reversals. They are considered one of the most accurate technical analysis tools, as they allow traders to predict the future price movement direction and the potential trend targets. Also, unlike many other technical tools, the number of false signal
All Symbols   AND  All Time frames Scan Document Introduction   A breakout refers to when the price of an asset moves above a resistance zone or moves below a support zone. A breakout indicates the potential for a price trend to break.Break provides a potential business opportunity. A break from the top signals to traders that it is better to take a buy position or close a sell position. A breakout from the bottom signals to traders that it is better to take sell positions or close the
This is the Full Version, to get the free version please contact me. The free version works on “AUDNZD” and “XAUUSD” charts. All symbols and time frames scanner Head and Shoulder One of the most popular Price Action patterns is the Head and Shoulders pattern. The pattern has three local tops that resemble the left shoulder, head, and right shoulder. The head and shoulders chart pattern appears in all kinds of markets, including Forex, cryptocurrency, commodities, stocks, and bonds. The
This is the Full Version, to get the free version please contact me. The free version works on “USDJPY” charts. All symbols and time frames scanner. Contact me after payment to send you the User-Manual PDF File. OVER and UNDER Over & Under pattern is an advanced price action trading concept in the trading industry. The Over & Under pattern is more than a confluence pattern or entry technique than a trading strategy. It is a reversal pattern that is created after a significant obvious trend. I
フィルタ:
レビューなし
レビューに返信