• 概要
  • レビュー (3)
  • コメント

Adaptive Volatility Range

5

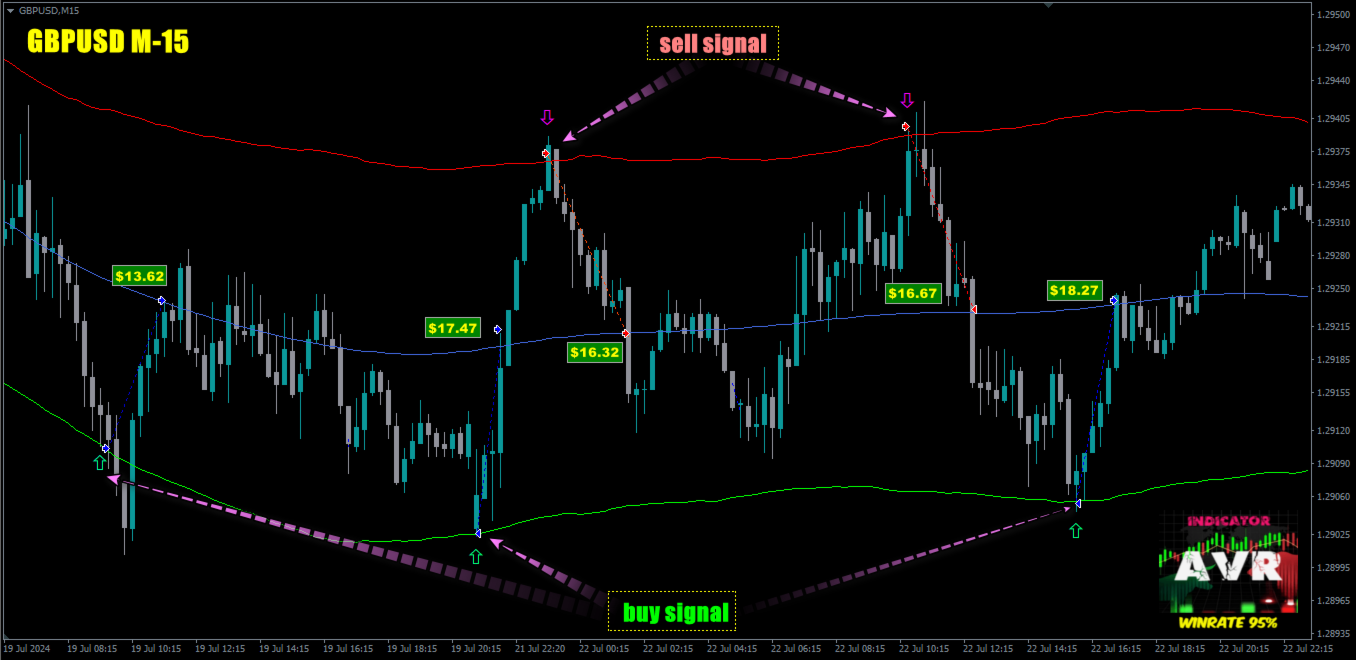
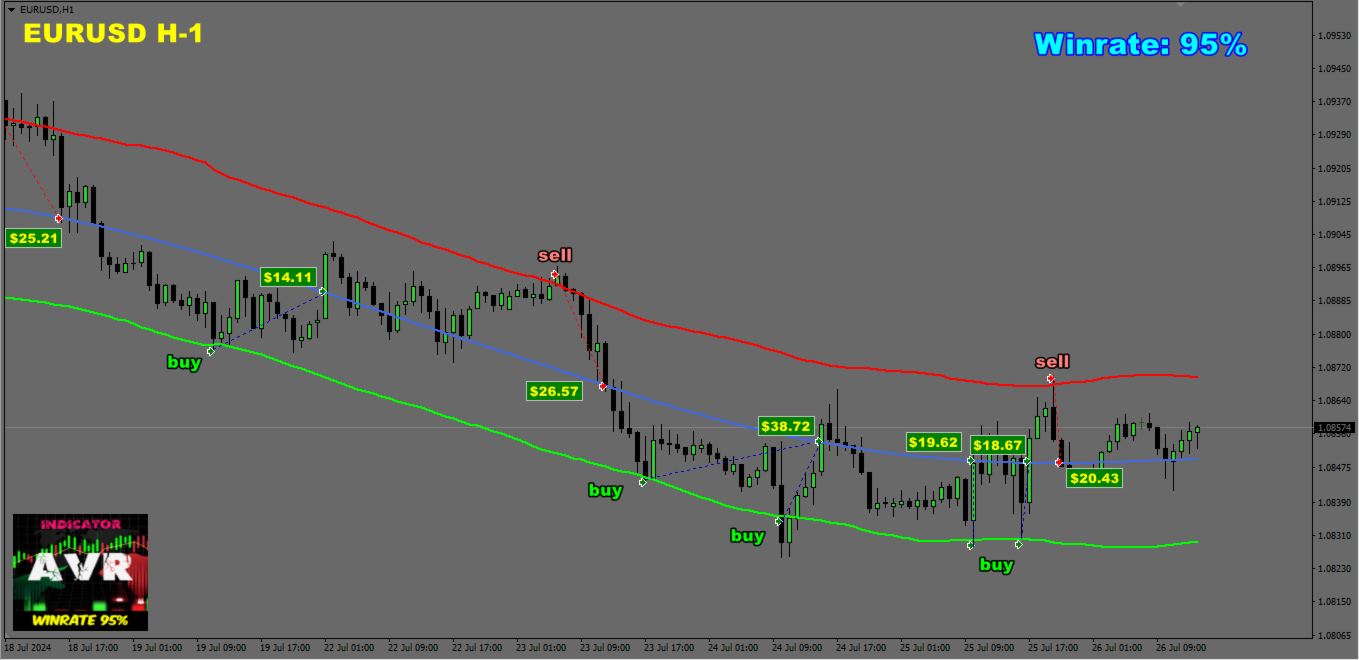
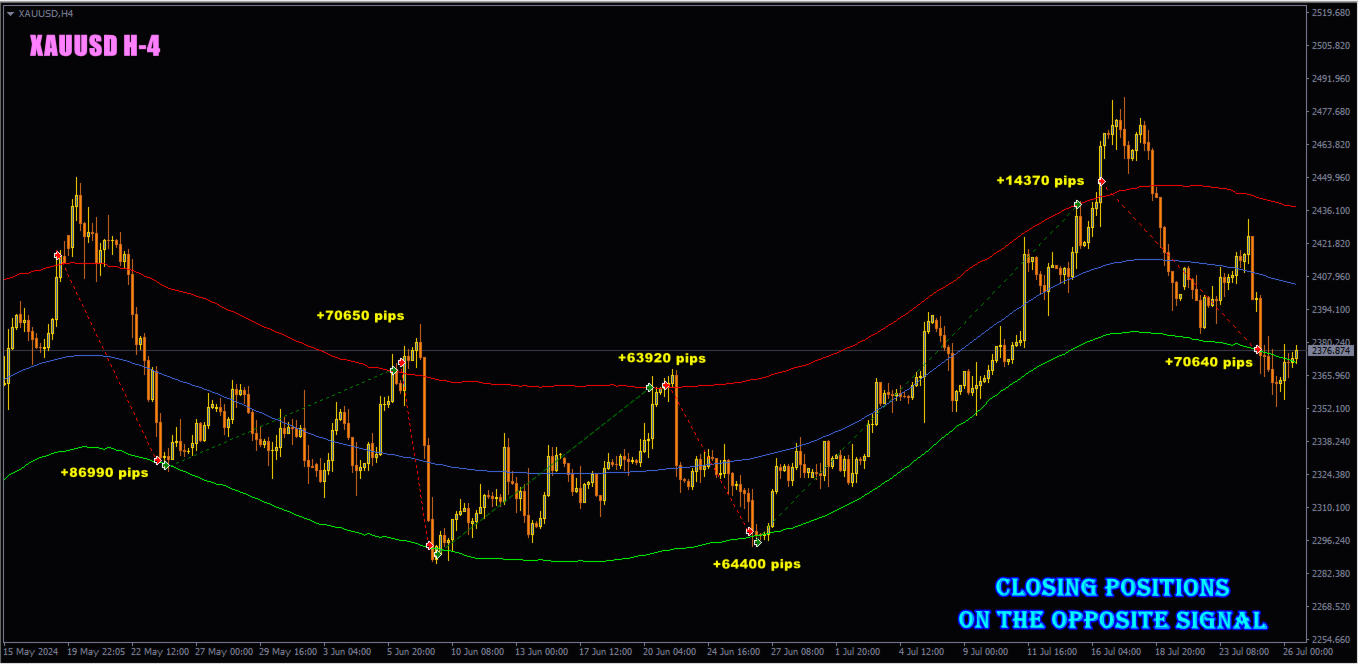
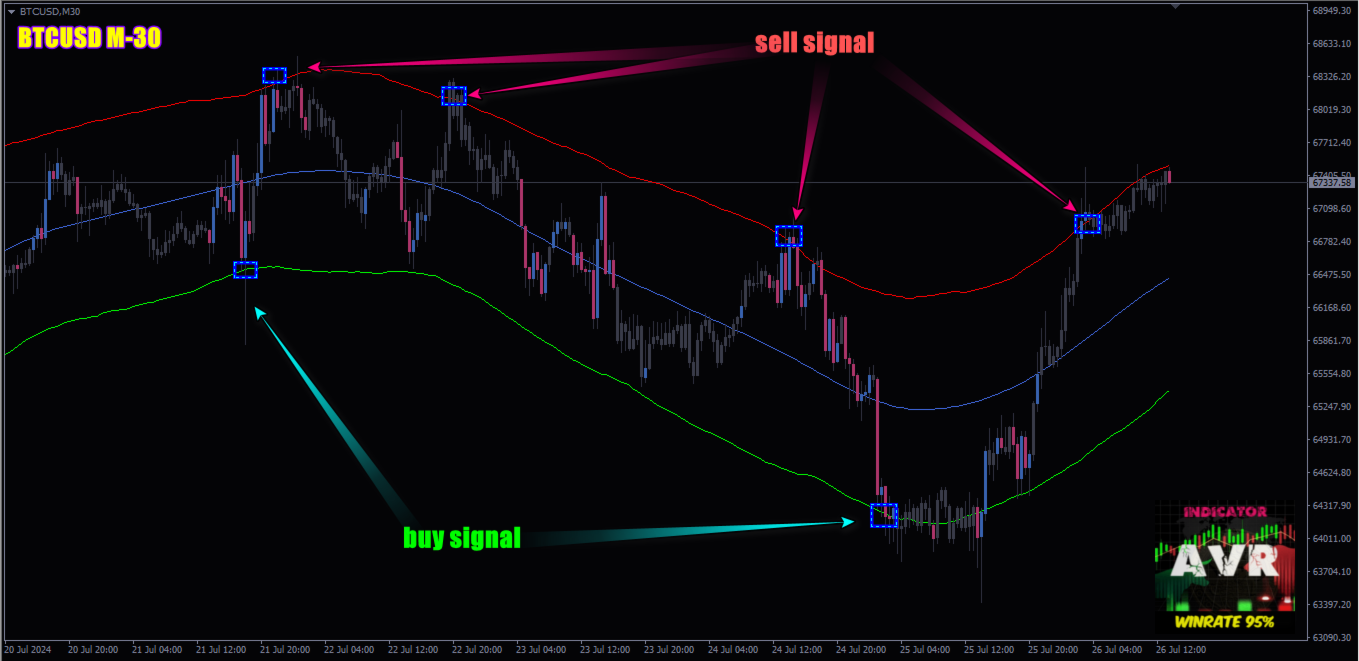
Adaptive Volatility Range [AVR] is a powerful tool for identifying key trend reversal points. AVR accurately reflects the Average True Range (ATR) of volatility, taking into account the Volume-Weighted Average Price (VWAP). The indicator adapts to any market volatility by calculating the average volatility over a specific period, ensuring a stable rate of profitable trades.

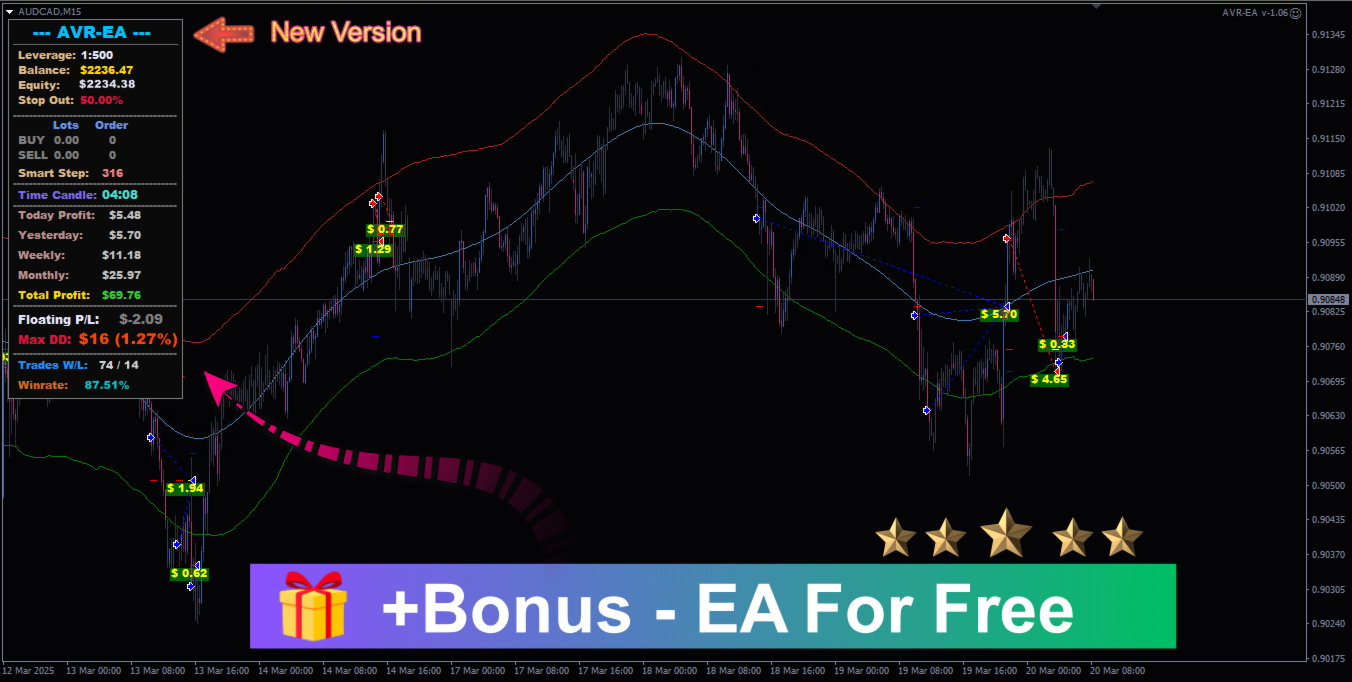
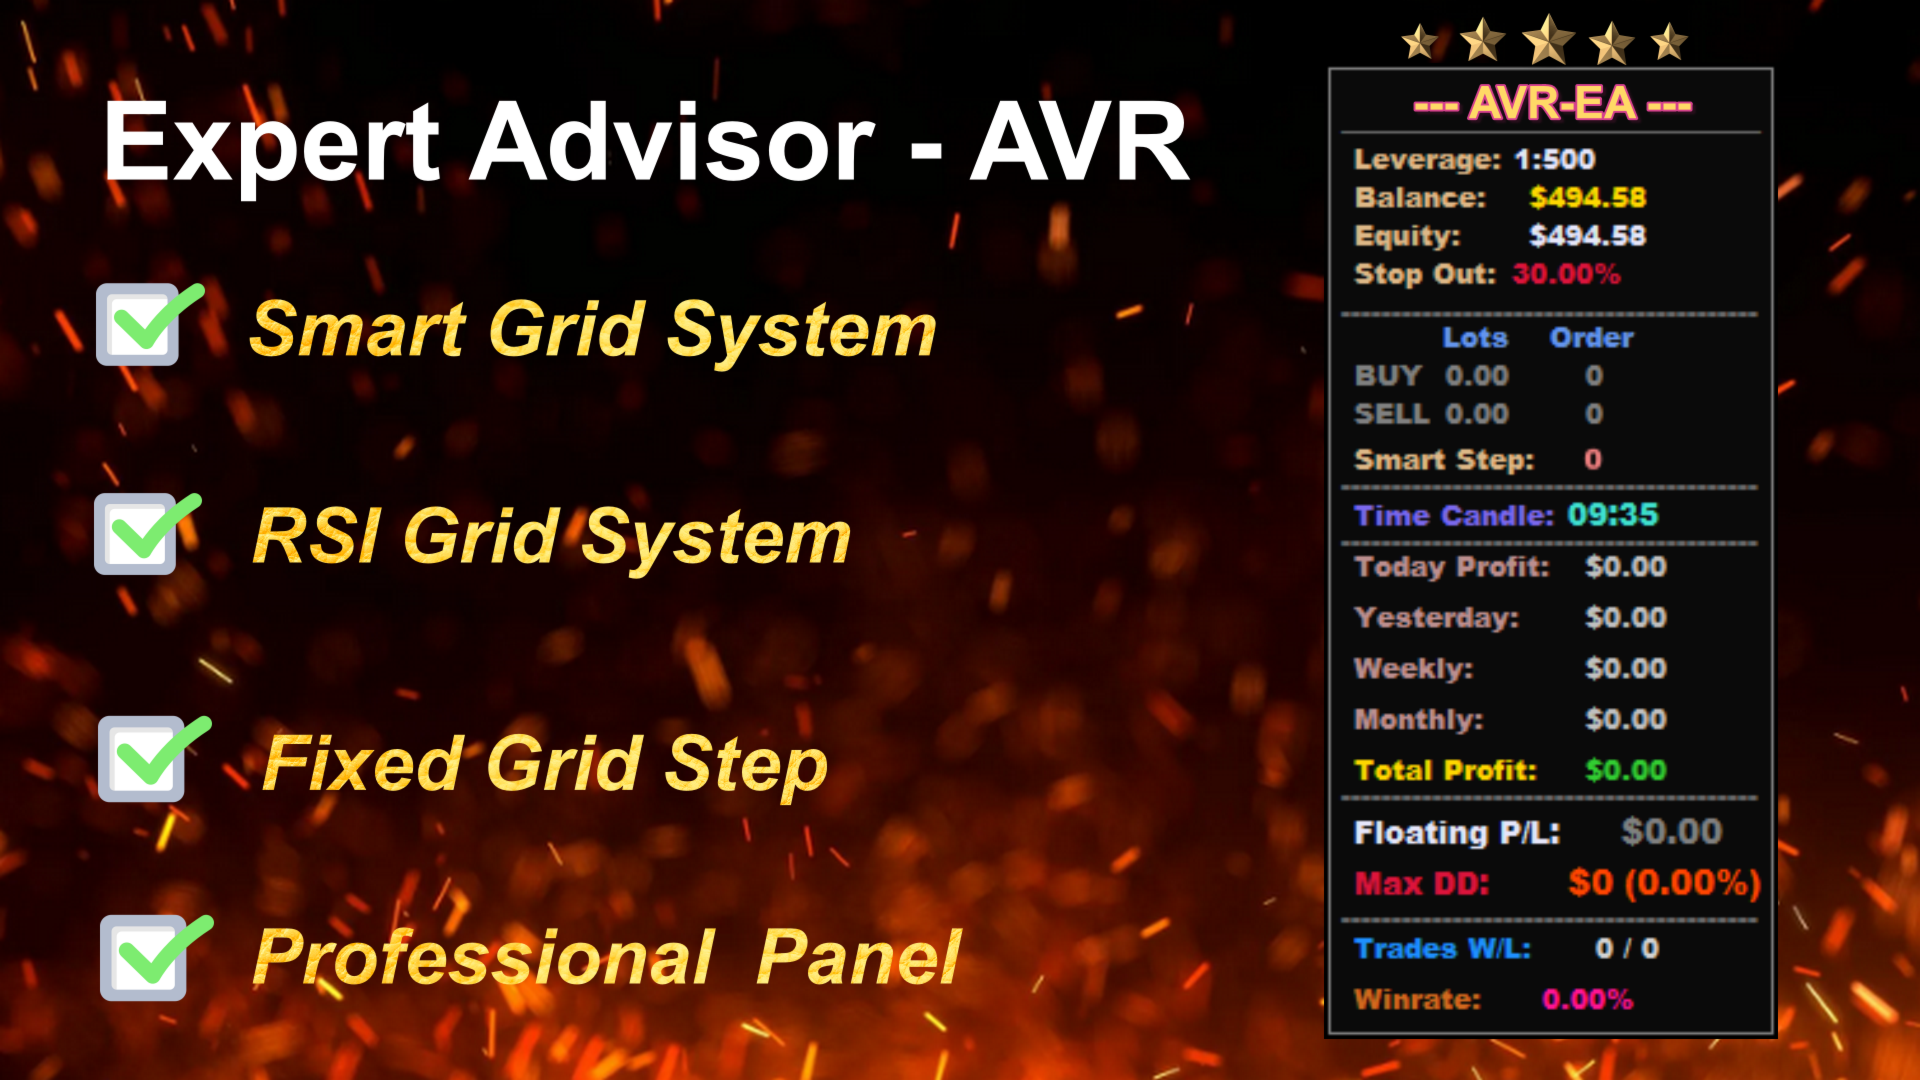
You receive not just an indicator but a professional automated trading system, AVR-EA.

Advantages:

  • Automated Trading System AVR EA: You can fully optimize and adjust the settings according to your preferences. You will be able to simulate different market conditions and test hundreds of settings in a short amount of time. The most important factors are the speed of position opening and the advisor’s 24/5 operation without the need for constant monitoring.

  • AVR-EA uses an advanced strategy,with additional signal filtering.

  • High accuracy of the indicator.

  • Easy identification of entry levels, both with and against the trend.

  • Accurate determination of target points (exit points) on any timeframe.

  • Simple display of target levels directly on the chart.

  • Works with any financial instruments (Forex, Metals, CFDs, Futures, Crypto).

  • Works on all periods and timeframes.

  • Suitable for both beginners and experienced traders.

Recommendations:

  • Place Take Profit inside the range at the volume-weighted average price level, and set Stop Loss outside the levels of volatility exceedance.

  • Use the ATR Multiplier greater than 3.0 on M1, M5, and M15 timeframes for maximum precision.

Trading Strategies:

  • Trend-following strategy: Used to determine the direction of the trend.

  • Reversal strategy: AVR is best suited for reversal strategies. When the volatility of the traded instrument exceeds the average volatility over a certain period, there is a high probability of price returning to the mean.

Based on AVR-EA it is possible to build a successful trading system with a positive mathematical expectation, which is the ultimate goal of forex trading.

Please contact me after complete purchase
------- To get AVR-EA -------

    レビュー 3
    Juergen Loebach
    1004
    Juergen Loebach 2025.03.15 16:30 
     

    Many thanks for the excellent service at the weekend, which is not a matter of course.I can highly recommend the indicator for manual trading.No results are yet available for the Expert Advisor.I will do this later.

    lorenzo_mella
    749
    lorenzo_mella 2024.09.28 19:11 
     

    veramente ottimo

    jabautista
    3796
    jabautista 2024.08.27 16:22 
     

    Good indicator. Author is very helpful.

    おすすめのプロダクト
    HLOC Trend Indicator This indicator helps you to determine trend direction on your trade. Default parameters for H1 time frame. You can use this indicator both bigger time frame and smaller time frame to open a trade. The calculation is based on high, low, opening and closing price values of each bar in the selected time period. When the values found in the Indicator custom formula are exceeded, the buy or sell signal falls on the screen. There are two extern inputs; RiskFactor: Early but risky
    This indicator simplifies your entry zones by displaying the areas where you can plan your entry that potentially could give you high risk/reward ratios. Other than picking the most optimal entry points, the Hot Zone indicator can act as your typical support/resistance indicator for pullbacks for all timeframes. You can use this indicator as the only trading indicator or use it with another indicator for reentry purposes.  Besides, when using Hot Zones, the risk/reward ratio should be well abov
    Break-even Price indicator Shows Break even price tag for multiple positions on chart Multiple Levels for custom Profit/Loss Percentages of Balance, and Amounts in Deposit Currency Works for a specific Magic Number trades or all trades on chart Calculation includes Spread, Commissions and Swaps How to use The basic use of the indicator is to calculate the "break-even price level" for multiple mixed positions for the same symbol and show it on the chart. In addition to this, the indicator will s
    KT Price Border MT4
    KEENBASE SOFTWARE SOLUTIONS
    KT Price Border は、3本のバンドで構成された価格チャネルを作成し、市場のスイングハイとスイングローの可能性がある領域を特定します。これらのレベルは、動的なサポートおよびレジスタンスとしても使用できます。 中央のバンドは、トレンドの方向を識別するためにも使用できます。そのため、このインジケーターはトレンドフォロー型の指標としても機能します。さらに、使いやすさとシンプルなトレードシグナルにより、初心者トレーダーにとって非常に有益です。 特徴 ほとんどの FX 通貨ペアで優れたパフォーマンスを発揮します。 短時間足と長時間足の両方で使用可能です。 スキャルピング、デイトレード、スイングトレードに適しています。 トレンドフォロー戦略と逆張り戦略の両方に対応しています。 価格がバンドを超えたときにアラートを送信できます。 価格バンドは、動的なサポートおよびレジスタンスレベルとして機能します。  価格境界の概念を理解する このインジケーターは、ボリンジャーバンドと同様に機能します。下部バンドは、市場の売られ過ぎ状態を示し、動的なサポートとして機能します。 上部バンドは、市場の
    The Squat is a function of the range of a given price bar and the volume, or TIC volume, that occurs while that range is being created. The basic idea is that high volume and little price movement indicate substantial support or resistance. The idea behind the approach to this indicator is to first look for likely Fibonacci support and resistance and then see if Squat manifests when that point is reached. The indicator determines one of the high probability patterns of DiNapoli. It does not re
    Donchian Channels Bands
    Jonathan Destailleur
    4.25 (4)
    Price Channels are also known as Donchian Channels being named after Richard Donchian.  They use the highest and lowest price of a set number of periods to create an upper and lower channel or envelope around the price. The upper channel shows the high of the number of periods chosen. The lower channel shows the low of the number of periods chosen. For example, the screenshot shows the Price Channels using 320 periods. The upper channel in the screenshot shows the highest high of the previous 3
    FREE
    This indicator XRX Master indicator.Indicator displays trend movement. Indicator helps to buy and sell. Features FiltPer- displays indicator period. deviation - displaus indicator deviation. deviation2 - displaus indicator deviation 2. HL_period - displaus indicator Highest and Lowest period. HL_period2 - displaus indicator Highest 2 and Lowest 2 period. How to understand the status: If the trend color arrow is green, trend is up. I f the trend color arrow is red, trend is down. ///////////
    TMoney TrendCycle
    Moises Orlando Urbina Sojo
    The indicator plots the trend from an EMA of "n" periods and the cycle from another EMA of "k" periods from the previous EMA. This allows the crosses to be much more effective and the amplitude of the cycle allows to verify the strength of the trend. This indicator should be used as a complementary tool to confirm market entry signals. It is possible to add three times the indicator applied to maximum price, minimum price and median price in TimeFrame of one hour for example, in order to identif
    製品説明:Trade Board MT4 はじめに Trade Board MT4は、MetaTrader 4向けに特別に設計された包括的で洗練された取引管理アシスタントです。この有料版はすべての機能を解除し、トレーディング体験を最適化し向上させるための完全なツールセットを提供します。Trade Board MT4を使用すると、トレーダーは前例のない効率性で取引を開始、終了、管理することができます。ソフトウェアには、ローソク足パターンやチャートの動きの視界を妨げないように、チャートの右側に配置されたスリムな垂直ダッシュボードが特徴です。 最新のKoala製品に関する最新情報をご確認いただくために、MQL5コミュニティのKoala Trading Solutionチャンネルにご参加ください。参加リンク: Koala Trading Solution Channel 特徴 垂直ダッシュボード:チャートとの干渉を最小限に抑えるように設計された垂直ダッシュボードには、一致する垂直バーをクリックするだけでストップロス、テイクプロフィット、エントリーラインを簡単に配置するための赤、緑、青のラインが
    Market structures, Market balance, Range breakouts This tools helps to identify areas of market ranges, structures and plots colored boxes on breakout of those areas. User is given the option to receive alerts and notifications on the formation of the blocks. The tool has the ability to become an essential part of a technical trading system or even pure price action trading. Usage:- An essential tool for price action or technical traders.  More information in the blog
    The system automatically draws resistance and support lines, The system automatically draws resistance and support lines, so you can see at a glance the price range where you are most likely to encounter resistance. Therefore, you can trade in price zones where you are less likely to encounter resistance. We are live-streaming the actual operation of the system. Please check for yourself if it is usable. Please check it out for yourself. https://www.youtube.com/@ganesha_forex We do not guaran
    Candle Power Pro
    Thushara Dissanayake
    4.33 (6)
    Candle Power Pro インジケーターを使用して、実際のボリューム情報の力を解き放ちます。この動的ツールは、各ローソク足の実際の体積データを取得し、それを総体積のパーセンテージとして表示します。そうすることで、市場での買い手と売り手の間で進行中の争いを識別できるようになります。 Candle Power Pro は、買い手と売り手の争いを総取引高に対する割合として表示し、市場のダイナミクスに関する貴重な洞察を提供します。買い手と売り手のボリュームを分析することでブレイクアウトを簡単に確認でき、より正確なエントリーポイントとエグジットポイントを確保できます。さらに、買い手と売り手のボリュームを利用して傾向を確認することができ、取引戦略の信頼性が高まります。さらに、買い手と売り手の量の変化を分析することでトレンドの反転を特定できるため、市場の変化に先んじることができます。 このインジケーターは、取引体験を向上させるためのさまざまな機能を提供します。簡単に視覚化できるようにボリューム平均を線として描画したり、ボリュームのパーセンテージを他の 19 個のシンボルと比較してさらに分析し
    Este es un indicador que te avisa mediante flechas, cuando las medias móviles ponderadas (LWMA) de los periodos que hayas elegido, se crucen entre sí. Puedes elegir el color que quieras para cada una de las flechas, incluso puedes elegir un sólo color para las dos flechas. Cuando hay un cruce de medias alcista, sale una flecha hacia arriba, y cuando hay un cruce de medias bajista, sale una flecha hacia abajo. Como comenté al inicio, también puedes elegir el periodo de cada media móvil ponderada
    CCI Warrior
    Marco Barbosa
    4.25 (4)
    Info:   marcobarbosabots CCI Warrior CCI is the short name of Commodity Channel Index indicator. The CCI Warrior is an Expert Advisor that get signals using CCI (Commodity Channel Index) levels. A SELL signal is generated above a positive level and a BUY signal is generated below a negative level. When a signal is generated, a Moving Average filter checks it. If the signal is in the same direction of the trend indicated by a Moving Average filter, then it is validated. After the signal was vali
    FREE
    The Trend Professor is a moving average based indicator designed for the purpose of helping the community of traders to analyse the price trend. The indicator will be displayed in the main chart as it is indicated on the screenshot section. How it works The indicator has lines of moving averages and colored histograms to depict the direction of the trend. There will be a fast signal line colored blue/yellow/red at some points. The red/yellow colored lines stands for bearish trend/signal while th
    With Fixed Range Volume Profile,The traces left by the big players will not go unnoticed by you. Professional   Volume Profile   Indicator reveals Institutional order flow. This advanced market indicator will teach you to spot the buying and selling. Dont want to say more because its well known by most professionals  trader. This Indicator : -  Quickly Identify the Strongest Institutional S/R Zones. - W orks with all Trading Instruments (Forex, Futures, Indexes, Commodities, Stocks, Cryptocur
    Signal Arrows is an indicator that generates trade arrows. It generates trade arrows with its own algorithm. These arrows give buying and selling signals.  Can be used in all pairs. Sends a signal to the user with the alert feature. The indicator certainly does not repaint. Trade rules Enter the signal when the buy signal arrives. In order to exit from the transaction, an opposite signal must be received. It is absolutely necessary to close the operation when an opposite signal is received. The
    The 4 headed dragon is an indicator that has two functions. 1) Set the background trend. 2) Mark the predominant trend. By combining these two indicator signals, we will be able to trade for or against the trend, adapting the signals to your reading of the market. You can download the demo and test it yourself. 1) Set the background trend.   Define four possibilities of trend that are the four heads of the dragon, marked by colors on the indicator, marking a) Powerful buying trend. b) Weak
    The Magic MA Moving Average Indicator is a market analysis tool that has more than 30 types of moving averages that the trader can use to gauge the market trend. Among the types of moving averages that the trader can visualize are the most common MAs (SMA, EMA and SMMA), adaptive moving averages such as FRAMA and KAMA and other MAs based on innovative calculation and analysis methods such as LSMA, ZLEMA and others. The indicator is designed to display all these moving averages on a single cha
    La esencia del trabajo del indicador Binary Kikos es que analiza el precio de la barra actual, comparándolo con las formaciones anteriores, y cuando surge un patrón, lanza una alarma en el desarrollo de la barra actual marcado con un punto ó circulo, al culminar la vela con punto se opera al inicio de la siguiente vela. La principal ventaja del indicador Binary Kikos es que no requiere filtros o señales adicionales de ninguna otra estrategia. Características del Indicador Terminal: Meta Trader 4
    StarBounce è un indicatore NO REPAINT che sfrutta i livelli importanti dei timeframe superiori.  StarBounce disegna i livelli di Apertura, Chiusura, Massimo e Minimo delle candele di uno specifico timeframe e su questi livelli cerca dei re-test. Si cercano candele con corpo sopra/sotto un livello e minimo/massimo oltre il medesimo livello. Si possono filtrare le candele segnale con diversi filtri selezionabili, attivabili, disattivabili con variabili esterne. Number of trending candles: permette
    Blahtech VWAP
    Blahtech Limited
    5 (3)
    Was: $69    Now: $49   Blahtech VWAP - Volume Weighted Average Price (VWAP) is the ratio of price to total volume. It provides an average price over a specified time interval.  Links [  Install  |  Update  |  Documentation   ] Feature Highlights Configurable VWAP Line Sessions, intervals, anchored or continuous Previous day settlement line Standard Deviation bands Alerts at bar close or real time Automatic Broker or Tick volumes Significantly reduced CPU usage Input Parameters Expert Advisor
    Impulse fractals indicator - is counter-trend oriented complex market fractal pattern.  Market creates bull/bear impulse, trend starts, fractals on impulsed wave are an agressive pullback signals. Buy arrow is plotted when market is bearish and it's impulse showed up-side fractal, and sell arrow is plotted when market is bullish and it's impulse showed dn-side fractal. Main indicator's adjustable inputs : impulsePeriod - main period of impulse histogram  filterPeriod  - smoothes impulse accordi
    MT4 バージョン: https://www.mql5.com/en/market/product/122732 MT5 バージョン: https://www.mql5.com/en/market/product/122733 Correlation Master – 負の相関と自動ヘッジのためのスマート EA Correlation Master は、通貨ペア間の負の相関戦略を利用する自動エキスパート アドバイザーです。この EA は、反対のペア (例: EURUSD 買いと USDCHF 売り) で反対のポジションを開くことにより、リスクを最小限に抑えながら利益を最大化することを目指しています。 柔軟なリスク管理とマルチペア設定を備えたこの EA は、スマートな自動ヘッジ戦略を求めるトレーダーに適しています。 主な機能 自動負の相関戦略 反対方向に動くペアで買いと売りのポジションを開きます。 例: EURUSD (買い) ↔ USDCHF (売り) マルチペアのサポート 一度に最大 13 ペアを使用できます。これには次のものが含まれます: EURUSD/USDCHF、
    This indicator graphs channels formed by the Local Maximum and Local Minimum of "n" periods and from this channel adds the Median and Interquartile Range. It is important to note that when the price enters the range, the interquartile range is reduced considerably with respect to its historical level, which can be visually warned with this indicator and the operator will have the possibility of deciding to stay out of operations in these conditions of market. The Q Factor (by default at 0.25 b
    Great indicator for binary options! Try what he can do! Alert is arranged in it so that you are not late with the signal! You can also customize the periods that suit you! (it is configured for currency pairs) If you want more, you can always reconfigure and use more! arrow indicator that works on several indicators, in the settings you can change the color of the arrows and the period! (repeat) Test it and see it in action!
    Forex 3D は、あらゆる通貨ペアでのスキャルピングに対応したトレーディング システムです。 推奨時間枠 M5. 毎日開くことができるトランザクションの平均数は 5 から 15 です。この取引システムは、金と銀を含むすべての通貨ペアでの取引に適しています。 Forex 3D は、外国為替初心者に適した非常にシンプルな取引システムです。 他の取引手段を使用した追加の市場分析は必要ありません。 このインディケータのテクニカル分析に専念し、そのシグナルのみでオーダーを開くことができます。 外国為替 3D 取引戦略: 買い注文を開くには、インジケーターを H1 時間枠に配置し、時間足チャートの価格が茶色の三角形の上にあることを確認する必要があります。 1 時間ごとの最後の手は緑色である必要があります。 M5 時間枠を開き、インジケーターがこの時間枠に緑色の矢印を描くのを待ちます。 インディケータがチャートに緑色の矢印を描くとすぐに、買い注文を開きます。 TakeProfit +25-35 pips を設定します (取引する通貨ペアによって異なります)。 茶色の三角形のレベルに設定された
    Background : Indicator On Chart based on my own oscillator ACe_Vector2016. As you can appreciate, this indicator draws two bands on the chart in order to identify long and short opportunities. When the momentum vector oscillator (ACe_Vector2016) crosses the zero line, the indicator On Chart draws a long/short signal (green/red arrow). Also you can identify the trend line on chart (MA): green colour if trend is moving up, and red colour if trend is moving down. This indicator draw up and down non
    Advanced Signal System is an indicator that generates trade arrows. It generates trade arrows with its own algorithm. These arrows give buying and selling signals.  Can be used in all pairs. Sends a signal to the user with the alert feature. The indicator certainly does not repaint. Trade rules Enter the signal when the buy signal arrives. In order to exit from the transaction, an opposite signal must be received. It is absolutely necessary to close the operation when an opposite signal is rece
    Utility for show on charts the visual informations about: - a vertical line at start of each bar of selected timeframe - a vertical line at start of each day - a vertical line at start of each week - vertical lines at start / end of trading sessions selected - bid / ask prices, spread, money value for each point (of 1 standard lot) and last tick time recived" You can enable / disable each information and set the color for each line
    FREE
    このプロダクトを購入した人は以下も購入しています
    現在20%OFF! 初心者やエキスパートトレーダーのためのベストソリューション! このダッシュボードソフトウェアは、28の通貨ペアで動作しています。それは私達の主要な指標(高度な通貨の強さ28と高度な通貨インパルス)の2に基づいています。それは全体の外国為替市場の大きい概観を与えます。それは、すべての(9)時間枠で28の外国為替ペアのための高度な通貨の強さの値、通貨の動きの速度と信号を示しています。チャート上で1つのインディケータを使用して市場全体を観察し、トレンドやスキャルピングの機会をピンポイントで見つけることができたら、あなたのトレードがどのように改善されるか想像してみてください。 このインディケータには、強い通貨と弱い通貨の識別、潜在的な取引の識別と確認がより簡単になるような機能が搭載されています。このインディケータは、通貨の強さや弱さが増加しているか減少しているか、また、すべての時間枠でどのように機能しているかをグラフィカルに表示します。 新機能として、現在の市場環境の変化に適応するダイナミックなマーケットフィボナッチレベルが追加され、すでに当社のAdvanced
    Dynamic Forex28 Navigator - 次世代の Forex 取引ツール。 現在 49% オフ。 Dynamic Forex28 Navigator は、長年人気のインジケーターを進化させたもので、3 つの機能を 1 つにまとめています。 Advanced Currency Strength28 インジケーター (レビュー 695 件)  + Advanced Currency IMPULSE with ALERT (レビュー 520 件) + CS28 コンボ シグナル (ボーナス)。 インジケーターの詳細 https://www.mql5.com/en/blogs/post/758844 次世代の Strength インジケーターが提供するもの  オリジナルで気に入っていたすべての機能が、新機能と精度の向上によって強化されました。 主な機能: 独自の通貨強度計算式。 すべての時間枠でスムーズかつ正確な強度ライン。 トレンドの特定と正確なエントリーに最適です。 ダイナミックマーケットフィボナッチレベル (マーケットフィボナッチ)。 このインジケーターに固有
    Enigmera
    Ivan Stefanov
    5 (7)
    ENIGMERA: 市場の中心 重要:MQL5.comのデモはStrategy Testerで実行されており、Enigmeraの機能を完全には反映していない場合があります。詳細については、説明、スクリーンショット、ビデオをご確認ください。質問があれば、遠慮なくメッセージを送ってください! インジケーターのコードは完全に書き直されました。バージョン3.0は新機能を追加し、インジケーターの開始以来蓄積されたバグを修正しました。 紹介 このインジケーターとトレーディングシステムは、金融市場への注目すべきアプローチです。ENIGMERAはフラクタルサイクルを使用して、サポートとレジスタンスのレベルを正確に計算します。真の蓄積フェーズを示し、方向と目標を提供します。トレンドでも修正でも機能するシステムです。 動作方法 インジケーターのほとんどの機能は、チャートの左側にあるボタンで制御され、市場の状況に迅速に対応できるようになっています。 ボタン ON/OFF – インジケーター全体を表示または非表示にします。 Channel – サポートチャネルを有効にし、許容範囲の偏差を示します。 Dev
    [ MT5 Version ]  [ Kill Zones ]  [ SMT Divergences ] How to trade using Order Blocks:  Click here User Interface Performance:  During testing in the strategy tester, the UI may experience lag. Rest assured, this issue is specific to the testing environment and does not affect the indicator's performance in live trading. Elevate your trading strategy with the  Order Blocks ICT Multi TF  indicator, a cutting-edge tool designed to enhance your trading decisions through advanced order block analys
    CONTACT US  after purchase to get the Indicator Manual. Download Now!  Offer valid only for next 10 Buyers.  Price   will   increase  gradually !  Download the  Metatrader 5 Version Read the product description carefully before purchasing the product.  Due to regulatory restrictions, our service is unavailable in certain countries such as India, Pakistan, and Bangladesh. Disclaimer: • Our products are available only on mql5.com. • We never contact anyone or sell our products privately. • We d
    NAM Order Blocks
    NAM TECH GROUP, CORP.
    5 (1)
    MT4マルチタイムフレームオーダーブロック検出インジケーター。 特徴 -チャートコントロールパネルで完全にカスタマイズ可能で、完全な相互作用を提供します。 -必要な場所でコントロールパネルを表示および非表示にします。 -複数の時間枠でOBを検出します。 -表示するOBの数量を選択します。 -さまざまなOBユーザーインターフェイス。 -OBのさまざまなフィルター。 -OB近接アラート。 -ADRの高線と低線。 -通知サービス(画面アラート|プッシュ通知)。 概要 注文ブロックは、金融機関や銀行からの注文収集を示す市場行動です。著名な金融機関と中央銀行が外国為替市場を牽引しています。したがって、トレーダーは市場で何をしているのかを知る必要があります。市場が注文ブロックを構築するとき、それは投資決定のほとんどが行われる範囲のように動きます。 注文の構築が完了すると、市場は上向きと下向きの両方に向かって急激に動きます。注文ブロック取引戦略の重要な用語は、機関投資家が行っていることを含むことです。それらは主要な価格ドライバーであるため、機関投資家の取引を含むあらゆる戦
    取引レベルインジケーターは、エントリーポイント、ポジションの保持、トレンドの方向を決定するために設計された取引システムです。 1 つの複合体で動作する複数のメカニズム、トレンド方向の波動分析、シグナル構築時のレベル分析が含まれており、考えられる TP および SL ターゲットを示します。 インジケーターの機能 シグナル矢印は現在のローソク足に表示されますが、色は変更されません。 特別なアルゴリズムを使用して、価格が跳ね返るレベルを検索します。 トレンドに合わせた働きをします。 このシステムは汎用的であり、さまざまな取引商品に適用できます。 矢印アラートにはいくつかの種類があります。 信号矢印の入力パラメータは自動モードで設定され、動作します。 時間枠に基づいて「トレンド波期間」パラメータを変更します 「ターゲットレベル SL TP」パラメータは主要通貨ペアに対して定義されており、他の取引商品で使用する場合は 10 以上の増加が可能です。 インジケーターの仕組み トレンドを判断するには、インジケーターに波線があり、価格を下回っている場合はトレンドが弱気であり、価格を下回っている場
    Bonus: when you buy  the indicator, any indicator for free (optional) .(Write in a private message or in telegram in the profile to receive a bonus) Quantum Entry is a powerful price action trading system built on one of the most popular and widely known strategies among traders: the Breakout Strategy! This indicator produces crystal clear buy and sell signals based on breakouts of key support and resistance zones. Unlike typical breakout indicators, it uses advanced calculations to accurately
    ECM Elite Channel is a volatility-based indicator, developed with a specific time algorithm, which consists of finding possible corrections in the market. This indicator shows two outer lines, an inner line (retracement line) and an arrow sign, where the channel theory is to help identify overbought and oversold conditions in the market. The market price will generally fall between the boundaries of the channel. If prices touch or move outside the channel, it's a trading opportunity. The ind
    Introduction to X3 Chart Pattern Scanner X3 Cherart Pattern Scanner is the non-repainting and non-lagging indicator detecting X3 chart patterns including Harmonic pattern, Elliott Wave pattern, X3 patterns, and Japanese Candlestick patterns. Historical patterns match with signal patterns. Hence, you can readily develop the solid trading strategy in your chart. More importantly, this superb pattern scanner can detect the optimal pattern of its kind. In addition, you can switch on and off individu
    トレンドオシレーター:スムーズで信頼性の高いトレンド識別ツール トレンドオシレーターは、トレーダーがトレンドの方向と反転ポイントを正確に特定するのをサポートするために設計された、MT4向けの高度なインジケーターです。直感的なビジュアルで、相場が上昇トレンドにあるのか下降トレンドにあるのかを明確に示し、分析を簡素化し、チャートの視認性を向上させます。幅広い市場と時間枠に対応しており、さまざまな取引ニーズに柔軟に対応します。 トレンドオシレーターの主な特徴と利点 トレンドの簡素化されたビジュアライゼーション : トレンドオシレーターは、色が変わるラインでトレンドの動きを表現します。青色は上昇トレンド、黄色は下降トレンドを示し、即座にトレンド方向が分かります。 信頼性の高い反転シグナル : 高度なアルゴリズムを使用して、インジケーターは反転ポイントを示すカラフルな矢印を生成します。緑色の矢印は買いシグナル、赤色の矢印は売りシグナルを示し、トレーダーがエントリーやエグジットを評価するための重要なゾーンを特定するのに役立ちます。 あらゆる市場と時間枠に対応可能 : トレンドオシレーターは、さまざ
    StalkeR Arrow
    Abdulkarim Karazon
    5 (3)
    StalkeR Arrow は、バーオープン/バー内で売買シグナルを与える矢印インジケーターです。このインジケーターは価格行動パターンとフラクタルに基づいています。 このインジケーターは、各買いシグナルと売りシグナルの tp と sl を与えます。tp と sl は各シグナルの上下の線の形式であり、新しいシグナルが形成されるまで延長されます。 このインジケーターには、履歴シグナルの勝敗統計を提供するバックテスト パネル/ダッシュボードがありますが、このインジケーターは再ペイントやバックペイントを行いません。 パラメーター : StalkeR 周期 : 矢印周期、数値が大きいほど信号が少なくなります スプレッド: ポイント単位のスプレッド値を使用して、パネル上の勝敗を計算します。 ストップロス ATR x : atr 乗算における SL 値 Takeprofit ATR x : atr乗算のTP値 ATR 期間 : に基づいて tp と sl を計算するために使用する atr 期間 TP/SL ラインの色と幅 矢印の色と幅 パネル/ダッシュボードの位置。 ア
    TrendMaestro
    Stefano Frisetti
    5 (3)
    note: this indicator is for METATRADER4, if you want the version for METATRADER5 this is the link:  https://www.mql5.com/it/market/product/108106 TRENDMAESTRO ver 2.4 TRENDMAESTRO recognizes a new TREND in the bud, he never makes mistakes. The certainty of identifying a new TREND is priceless. DESCRIPTION TRENDMAESTRO identifies a new TREND in the bud, this indicator examines the volatility, volumes and momentum to identify the moment in which there is an explosion of one or more of these data a
    Gold Channel is a volatility-based indicator, developed with a specific timing algorithm for the XAUUSD pair, which consists of finding possible corrections in the market. This indicator shows two outer lines, an inner line (retracement line) and an arrow sign, where the theory of the channel is to help identify overbought and oversold conditions in the market. The market price will generally fall between the boundaries of the channel. If prices touch or move outside the channel it is a tradi
    Scalping Indicator Pro is a powerful indicator that works in trend as well as non trending market conditions. This indicator is perfect for scalp trades as well as swing trades. Scalping Indicator Pro is not just an indicator, but a trading strategy itself. It doesn't requires any additional indicators for the trading setup. Check out the indicator in action. [Video demonstration below] Why use Scalping Indicator Pro? Great for novice traders as well as experienced traders. Low risk entries.
    Linear Trend Predictor ー - エントリ ポイントと方向サポート ラインを組み合わせたトレンド インジケーター。高値/安値チャネルを突破するという原理に基づいて機能します。 インジケーターのアルゴリズムは市場のノイズをフィルタリングし、ボラティリティと市場の動向を考慮します。 インジケーターの機能  平滑化手法を使用して、市場のトレンドと、買い注文または売り注文を開くためのエントリー ポイントを表示します。  任意の時間枠のチャートを分析して、短期および長期の市場の動きを判断するのに適しています。  あらゆる市場や時間枠に適応可能な入力パラメータにより、トレーダーはインジケーターを独自にカスタマイズできます。  設定されたインジケーター信号は消えず、再描画もされません。ローソク足の終値で決定されます。以前にシグナルを受信して​​現在のローソク足で使用することも可能ですが、シグナルが変わる可能性があります。  いくつかの種類の通知が矢印と組み合わされています。  このインジケーターは、独立した取引システムとして使用することも、他の取引システムへの追加として使用
    Algo Trading Indicaor  With this indicator , you’ll have zones and trends that hight probability the price will reverse from it. so will gives you all the help that you need  Why should you join us !?  1-This indicator is logical since it’s working in previous days movement , to predict the future movements. 2-Algo trading indicator will help you to draw trends which is special and are too strong than the basics trend , trends will change with the frame time that you work on . 3-We can use
    Supreme Commander
    Ramon Sobrevals Arce
    4.13 (8)
    The indicator of the indicators. The Most Powerful Technique to Determine Forex Trend Strength in 2023. We have perfected Supreme Commander that it calculates an average of the selected indicators (up to 16) and the selected timeframe (all) with the result of a single trend that indicates the potential of buying and selling.  It includes the following indicators: Accelerator/Decelerator oscillator Average Directional Movement Index Awesome oscillator; Bulls and Bears  Commodity Channel Index; De
    The   Volume Spread Analysis indicator   is based on the original Volume Spread Analysis method. It was designed for quick and easy recognition of VSA patterns. Even though this indicator looks very simple, it is the most sophisticated tool we've ever made. It is a really powerful analytical tool that generates very reliable trading signals. Because it is very user-friendly and understandable, it is suitable for every type of trader, regardless of his experience. What is VSA? VSA - Volume Spre
    Introduction Excessive Momentum Indicator is the momentum indicator to measure the excessive momentum directly from raw price series. Hence, this is an extended price action and pattern trading. Excessive Momentum Indicator was originally developed by Young Ho Seo. This indicator demonstrates the concept of Equilibrium Fractal Wave and Practical Application at the same time. Excessive Momentum detects the market anomaly. Excessive momentum will give us a lot of clue about potential reversal and
    Welcome to the world of SMC (Smart Money Concepts) Trading, where we empower traders with the tools and knowledge to make smarter trading decisions. Our latest addition to our suite of trading tools is the SMC Trading Pro indicator, version 1.0. Key Features: Major Market Structure Identification with BODY break. Order Block must be in Major Swing ( not Small Swing ). Order Block with Fair Value Gap Detection. Order Block in Discount | Premium zone. Filter for only Bullish, Bearish or All Order
    プレシジョン・インデックス・オシレーター(Pi-Osc)は、Precision Trading SystemsのRoger Medcalfによるものです。 バージョン2は、チャートにスーパーファストでロードされるように注意深く再コードされ、その他の技術的な改良も組み込まれて、エクスペリエンスを向上させています。 Pi-Oscは、市場が強制的に行かなければならない、すべての人のストップを取り除くためのポイントである、極限のエクソースト・ポイントを見つけるために設計された正確な取引タイミング信号を提供するために作成されました。 この製品は、極限のポイントがどこにあるかを知るという古代の問題を解決し、トレーダーの生活をはるかにシンプルにします。 これは、業界標準のオシレーターとは異なる強力な要素を持つ高度なコンセンサス・インジケーターです。 使用されている一部の機能には、需要指数、マネーフロー、RSI、スティリング、パターン認識、出来高分析、標準偏差の極値などがあり、異なる長さでこれらのバリエーションが多く含まれています。 初めて見ると、訓練されていない目には、他のオシレーター
    現在20%OFF! このダッシュボードは、複数のシンボルと最大9つのタイムフレームで動作するソフトウェアの非常に強力な部分です。 このソフトは、弊社のメインインジケーター(ベストレビュー:Advanced Supply Demand)をベースにしています。    Advanced Supply Demand ダッシュボードは、素晴らしい概要を提供します。それは示しています。  ゾーン強度評価を含むフィルタリングされた需給値。 ゾーン内/ゾーンへのPips距離。 ネストされたゾーンがハイライトされます。 選択されたシンボルの4種類のアラートを全ての(9)時間枠で提供します。 それはあなたの個人的なニーズに合わせて高度に設定可能です。 あなたの利益! すべてのトレーダーにとって最も重要な質問です。 市場に参入するのに最適なレベルはどこか? 成功のチャンスとリスク/リターンを得るために、強力な供給/需要ゾーン内またはその近くで取引を開始します。 損切りの最適な位置はどこですか? 最も安全なのは、強力な供給/需要ゾーンの下/上にストップを置くことです。 最適な利益
    CONTACT US  after purchase to get the Indicator Manual. Try Now—Limited Discount for the next 10 Buyers! Download the  Metatrader 5 Version Read the product description carefully before purchasing the product.  Due to regulatory restrictions, our service is unavailable in certain countries such as India, Pakistan, and Bangladesh. Disclaimer: • Our products are available only on mql5.com. • We never contact anyone or sell our products privately. • We do not provide any personal trading advice.
    Trade Invest Pro - Boss in the world of cryptocurrency! This indicator is ideal for cryptocurrency trading! Work on Trade Invest Pro took us half a year! But not in vain! Now only accurate signals near support - resistance levels! He showed himself well on timeframes m5 m15 for binary options! Optionally, it can be configured for forex for timeframes m30 and more! Reacts well to news! Doesn't paint! and does not disappear from the schedule! As soon as a red arrow appears, open a deal fo
    Cyclical indicator for trading and predicting the direction of the market. Shows the cyclical behavior of the price in the form of an oscillator. Gives signals for opening deals when rebounding from the upper and lower boundaries of the oscillator. In the form of a histogram, it shows the smoothed strength of the trend. Will complement any trading strategy, from scalping to intraday. The indicator does not redraw. Suitable for use on all symbols/instruments. Suitable time frames for short-term t
    Binary Booster
    Yaroslav Varankin
    5 (1)
    Binary Options Trading Indicator: A Reliable Tool for Your Trades This indicator is specifically designed for binary options trading and has proven its high quality, reliability, and adequate accuracy, depending on the dynamics of the chart. Key Points: Signal Interpretation: When a blue cross signal appears, it indicates a potential entry into a trade, though it is considered a weak signal on its own. However, if the blue cross is accompanied by an arrow, it is considered a more reliable buy s
    This indicator is based on the mathematics of the great trader W.D. Ganna. With its help, you can easily find strong levels by analyzing swings to find the optimal entry point. The indicator works on all instruments and all timeframes. The indicator is fully manual and has control buttons. All you need to do is press the NEW button, a segment will appear, which you can place on any movement, swing or even 1 candle that you want to analyze. By placing the segment, press the OK button. A grid (th
    Dark Sniper pointer indicator.  Complete absence of redrawing   The percentage of correct indicator forecasts depends on your settings; the default is period 7 (performed better) The arrow indicates the direction of the next candle and the possible direction of the trend in the future.  Suitable for small timeframes m1 and m5  It is recommended to open transactions from 1 to 2 candles.  The signal appears on the current candle. Open a trade on the next one since the signal is being generat
    作者のその他のプロダクト
    Ultimate Volatility Insight is a highly professional tool for analyzing and fully understanding market activity based on an advanced ATR with improved algorithms and calculation formulas. The indicator helps traders accurately assess market dynamics, identify key support and resistance levels, and effectively manage risks. Ultimate Volatility Insight works only with real data using live statistics. The indicator has been developed for over two years, and its effectiveness has been proven through
    Advanced Reversal Hunter Pro (ARH) is a powerful, innovative volatility-based momentum indicator designed to accurately identify key trend reversals. Developed using a special algorithm that provides a clear construction of the average volatility range, without redrawing its values ​​and does not change them. The indicator adapts to any market volatility and dynamically adjusts the width of the band range, depending on current market conditions. Indicator advantages: Advanced Reversal Hunter Pro
    The Sniper Delta Imbalance indicator is designed to analyze delta – the difference in tick volumes between buyers and sellers in the market. It displays the imbalance between market buys and sells, allowing traders to accurately assess the current sentiment of major market participants. This tool provides a unique method of analysis based on the relationship between supply and demand volumes and can be used to identify who controls the price at any given moment. Key Features: Delta Imbalance —
    The Block Master Pro indicator is designed to visually identify areas on the chart where significant volumes from major market participants are likely concentrated. These areas, known as order blocks, represent price ranges where large players place their orders, potentially signaling a price reversal and movement in the opposite direction. Key Features: Order Block Identification: Block Master Pro effectively identifies order blocks by pinpointing price ranges where large orders are placed. Th
    Reversal Pattern AI is a groundbreaking advancement in indicator development, combining artificial intelligence algorithms, multi-level market analysis, and classical technical analysis methods. It not only detects reversal patterns but also evaluates market inefficiencies, generating highly accurate trading signals.Thanks to its hybrid model, which utilizes price action analysis, volume, volatility, VWAP, and Volume AVG %, the indicator easily adapts to any market conditions. Reversal Pattern A
    Golden Trend Pulse — trend indicator developed specifically for Gold, also applicable to the Cryptocurrency and Stock markets. The indicator is designed for precise determination of market trends using advanced analytical methods. The tool combines multifactor analysis of price dynamics and adaptive filtering of market noise, ensuring high accuracy in identifying key entry and exit points. Thanks to its intelligent system, the indicator effectively handles market variability, minimizing false s
    Golden Trend Pulse   — trend indicator developed specifically for Gold, also applicable to the Cryptocurrency and Stock markets. The indicator is designed for precise determination of market trends using advanced analytical methods. The tool combines multifactor analysis of price dynamics and adaptive filtering of market noise, ensuring high accuracy in identifying key entry and exit points. Thanks to its intelligent system, the indicator effectively handles market variability, minimizing false
    The Bull and Bear Zones indicator is specifically designed for the automatic identification and visual display of support and resistance zones directly on the chart. Its unique algorithm allows it to display not only the zones already tested by the market but also potential target zones that have yet to be tested. The indicator tracks ranges where an imbalance between supply and demand is observed. Key Features: Automatic identification of support and resistance zones : The indicator calculates
    Adaptive Volatility Range [AVR] -  is a powerful tool for identifying key trend reversals. AVR -   accurately displays the Average True Volatility Range taking into account the Volume Weighted Average price. The indicator allows you to adapt to absolutely any market volatility by calculating the average volatility over a certain period of time - this provides a stable indicator of positive transactions. Thanks to this , Adaptive Volatility Range   has a high   Winrate of 95% There are two ways t
    Scalper Inside Volume Pro is a professional trading system that combines multiple indicators to calculate an overall composite signal. It is based on an algorithm focused on volume, the Money Flow Index, and the Smart Money concept. The indicator takes into account structural Swing points where price reversals occur. Scalper Inside Volume Pro provides all the necessary tools for successful scalping. This comprehensive trading system is suitable for traders in the Forex market as well as for use
    Patriot EA is an advanced mesh system with improved performance. Patriot EA uses sophisticated technology to effectively manage unprofitable positions. When a losing series of orders occurs, an algorithm for closing unprofitable positions is activated. The Expert Advisor divides orders into several independent grids, closing the long-range (unprofitable) order by sequentially averaging part of the orders with a given Take Profit. A series of orders can be divided into several mixed series with
    Reversal Zones Pro is an indicator specifically designed to accurately identify key trend reversal zones. It calculates the average true range of price movement from the lower to upper boundaries and visually displays potential zones directly on the chart, helping traders effectively identify important trend reversal points. Key Features: Reversal Zone Identification: The indicator visually displays potential reversal zones directly on the chart. This helps traders effectively identify importan
    Volume PRO is an innovative and modernized indicator for analyzing trading volumes, which is an advanced version of traditional analysis tools. This high-tech indicator allows traders to effectively monitor trading activity without the need for complex calculations. It displays ticks for the selected time interval corresponding to the selected time frame in the form of a dynamic cumulative histogram, which is updated in real time as new trades are received. Key features: Innovative volume analys
    Please contact me after your full purchase for great bonuses.                                     Adaptive Reversal Star Expert Advisor and an additional indicator as a gift Info Panel are waiting for you. Adaptive Reversal Star is a new generation indicator with an advanced Adaptive algorithm , which additionally tracks potential reversal points and compares the values of the current market volatility when forming the main signals
    Adaptive Reversal Star   is a new generation indicator with an   advanced Adaptive algorithm , which additionally tracks potential reversal points and compares the values of the current market volatility when forming the main signals of the indicator.It provides accurate signals in real time without delays and redraws.Adaptive Reversal Star does not require any complex settings and additional calculations, just set it to the desired timeframe and select the parameter - Signal Filter. Why choose
    Reversal Zones Pro – an indicator specifically designed for accurately identifying key trend reversal zones. It calculates the average true range of price movement from lower to upper boundaries and visually displays potential reversal zones directly on the chart, helping traders efficiently pinpoint crucial turning points in the market. Key Features: Reversal Zone Identification: The indicator visually highlights potential reversal zones directly on the chart, enabling traders to effectively id
    フィルタ:
    Juergen Loebach
    1004
    Juergen Loebach 2025.03.15 16:30 
     

    Many thanks for the excellent service at the weekend, which is not a matter of course.I can highly recommend the indicator for manual trading.No results are yet available for the Expert Advisor.I will do this later.

    Stanislav Konin
    1295
    開発者からの返信 Stanislav Konin 2025.03.16 08:23
    Thank you for your trust! Always happy to help.
    lorenzo_mella
    749
    lorenzo_mella 2024.09.28 19:11 
     

    veramente ottimo

    Stanislav Konin
    1295
    開発者からの返信 Stanislav Konin 2024.09.29 09:20
    Thank you! I wish you profitable trading!
    jabautista
    3796
    jabautista 2024.08.27 16:22 
     

    Good indicator. Author is very helpful.

    Stanislav Konin
    1295
    開発者からの返信 Stanislav Konin 2024.08.27 17:12
    Thank you! Glad to help.
    レビューに返信