Insight Flow MT5
- インディケータ
- Nikola Pocuca
- バージョン: 1.2
- アップデート済み: 29 7月 2024
- アクティベーション: 10
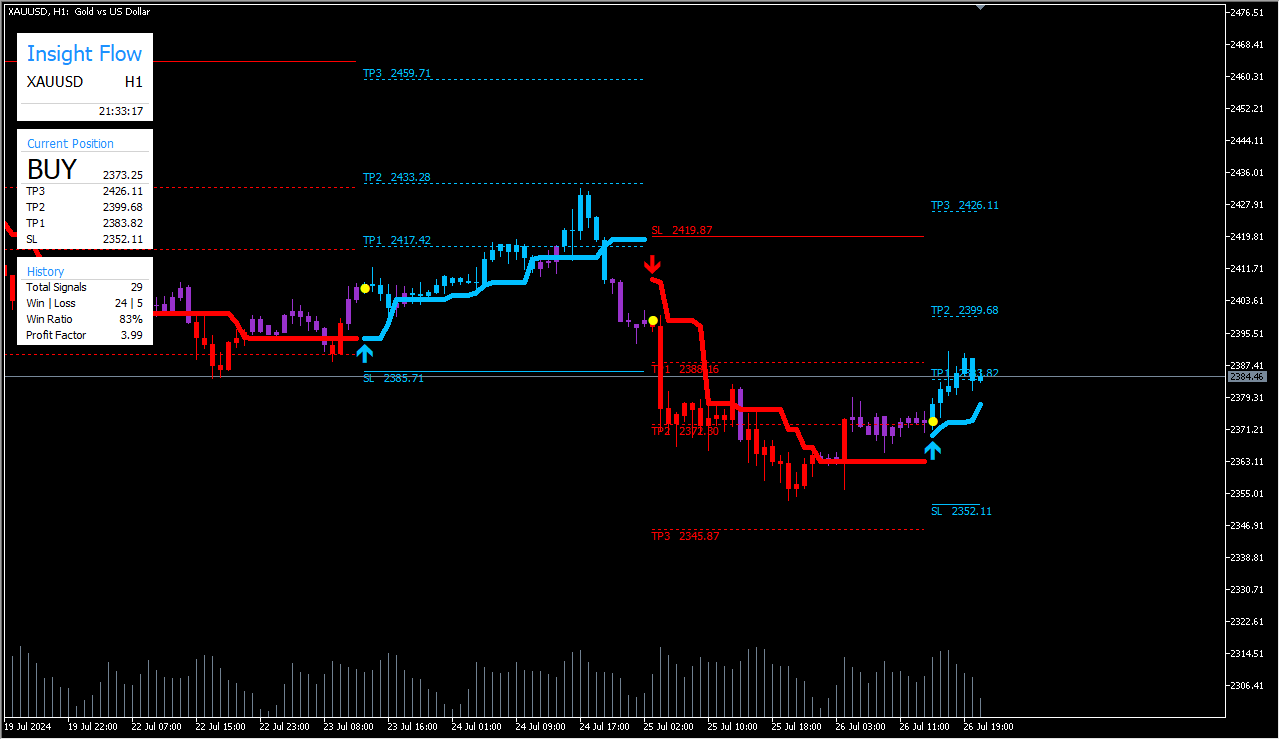
First and foremost, the Insight Flow Indicator stands out as a Non-Repainting, Non-Redrawing, and Non-Lagging tool. This makes it a prime choice for both manual and algorithmic trading, ensuring reliable and consistent signals.
User Manual: Settings, Inputs, and Strategy
The Insight Flow Indicator leverages price action, strength, and momentum to provide a clear edge in the market. Equipped with advanced filters, it eliminates noise and false signals, enhancing trading potential. By using multiple layers of complex indicators, the Insight Flow turns sophisticated mathematical calculations into simple, easily interpretable signals and colors, making it suitable for traders at any experience level.
Product Overview
Insight Flow is designed as a comprehensive trading solution for both novice and experienced traders. It integrates premium indicators and advanced features into a single, versatile trading strategy, making it adaptable for various trading styles and market conditions.
Trading Strategies
- Intra-Day Trading and Scalping: Optimized for quick and precise day trading and short-term trades.
- Day and Swing Trading: Suitable for traders targeting larger price movements.
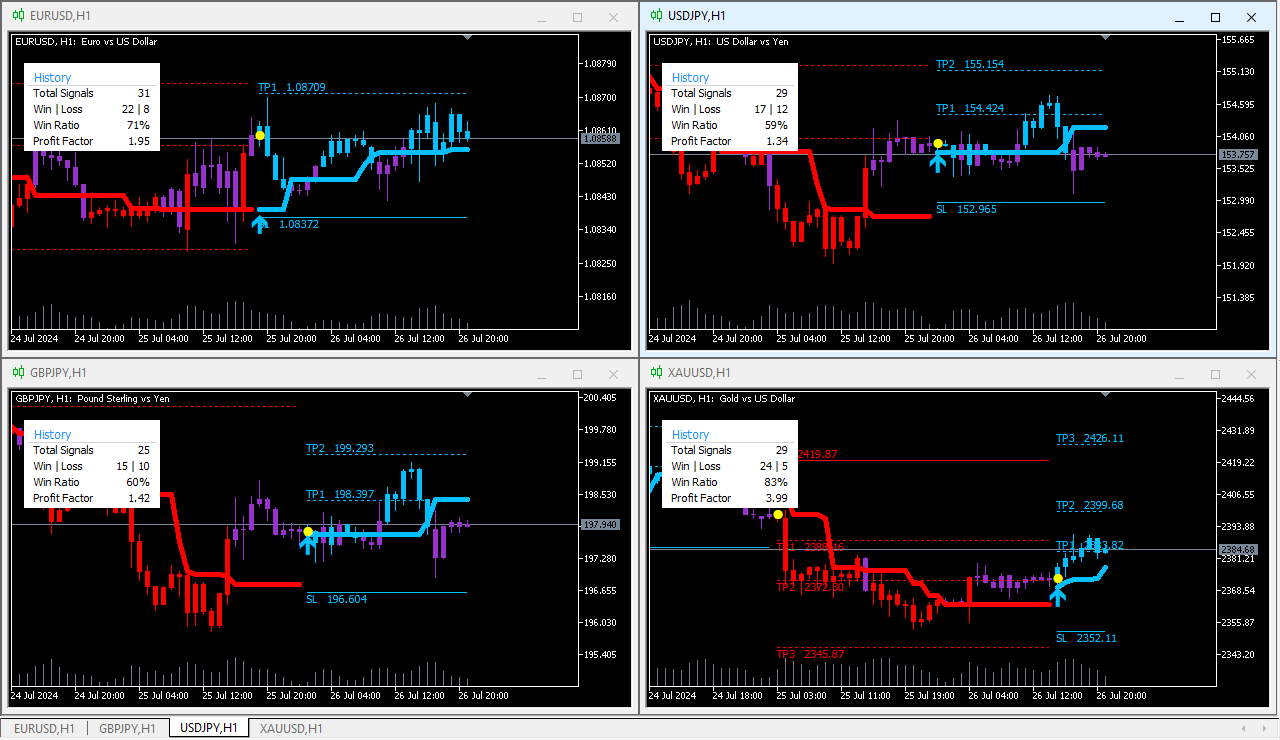
- Multi-Currency and Multi-Market Compatibility: Works accurately across various instruments and markets.
- Stability and Reliability: Ensures non-repainting, non-redrawing, and non-lagging signals.
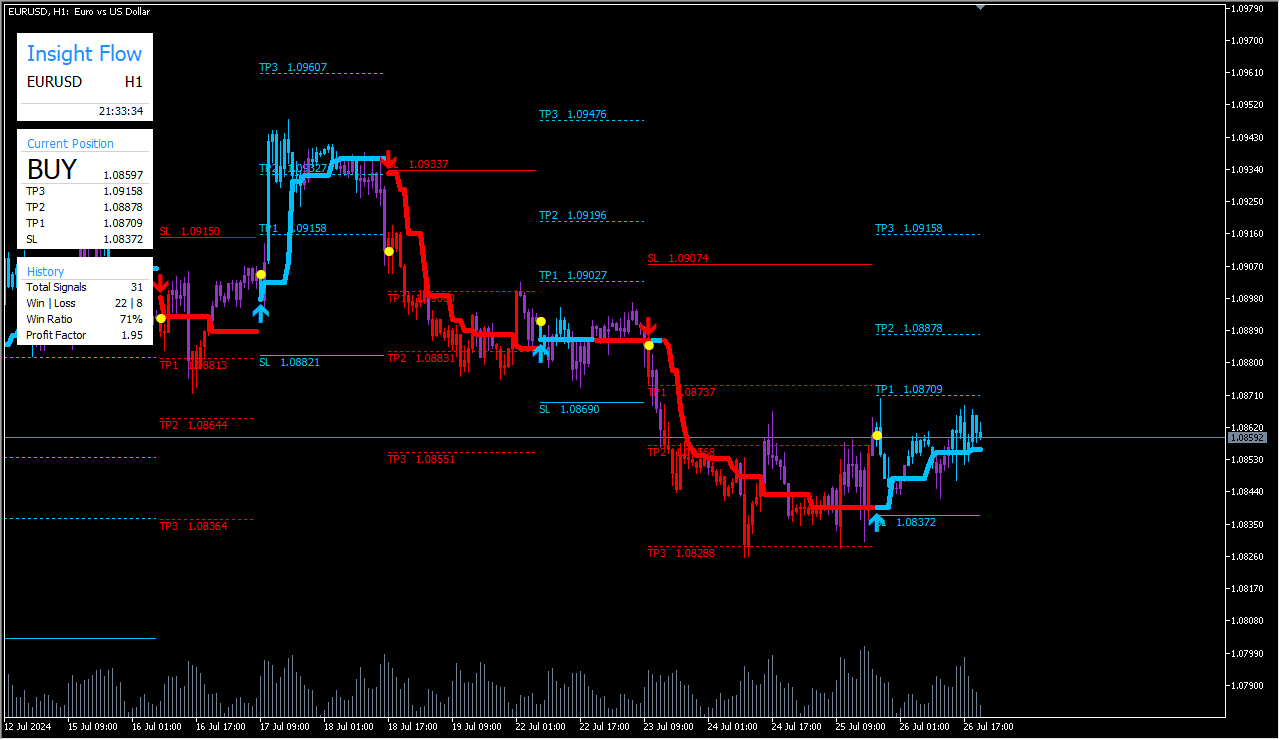
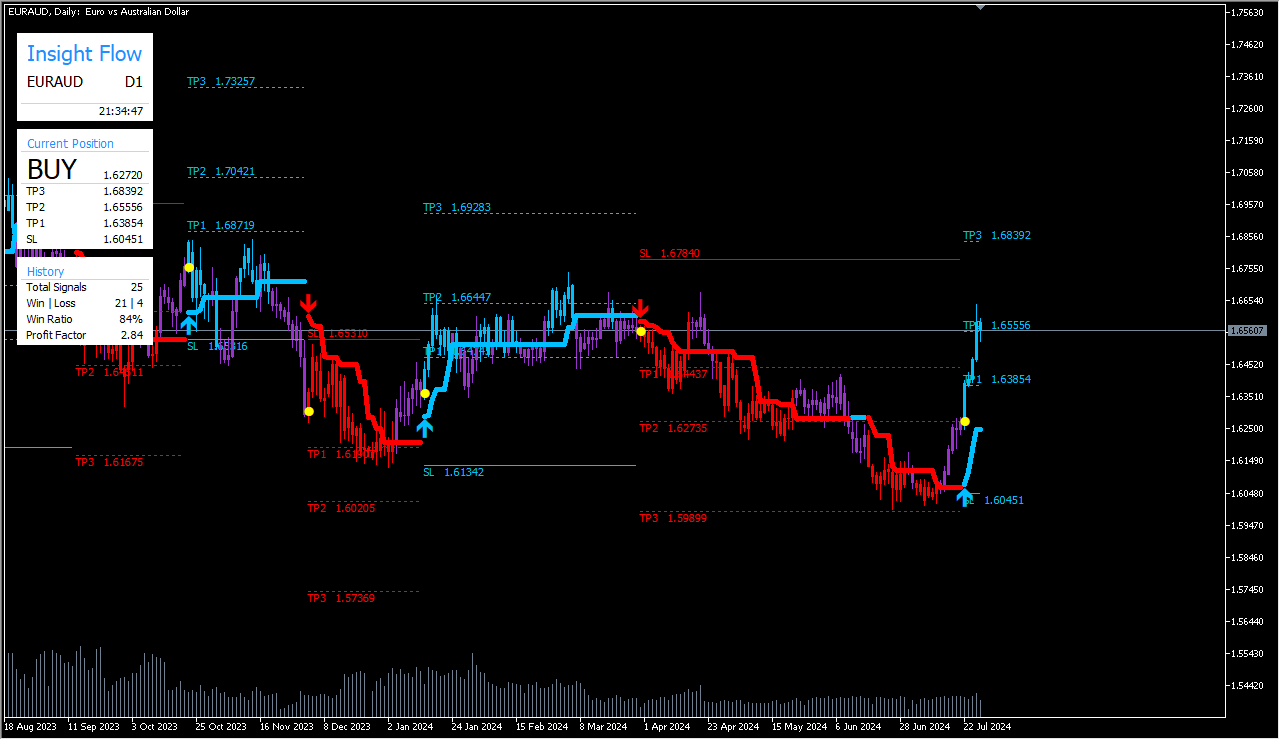
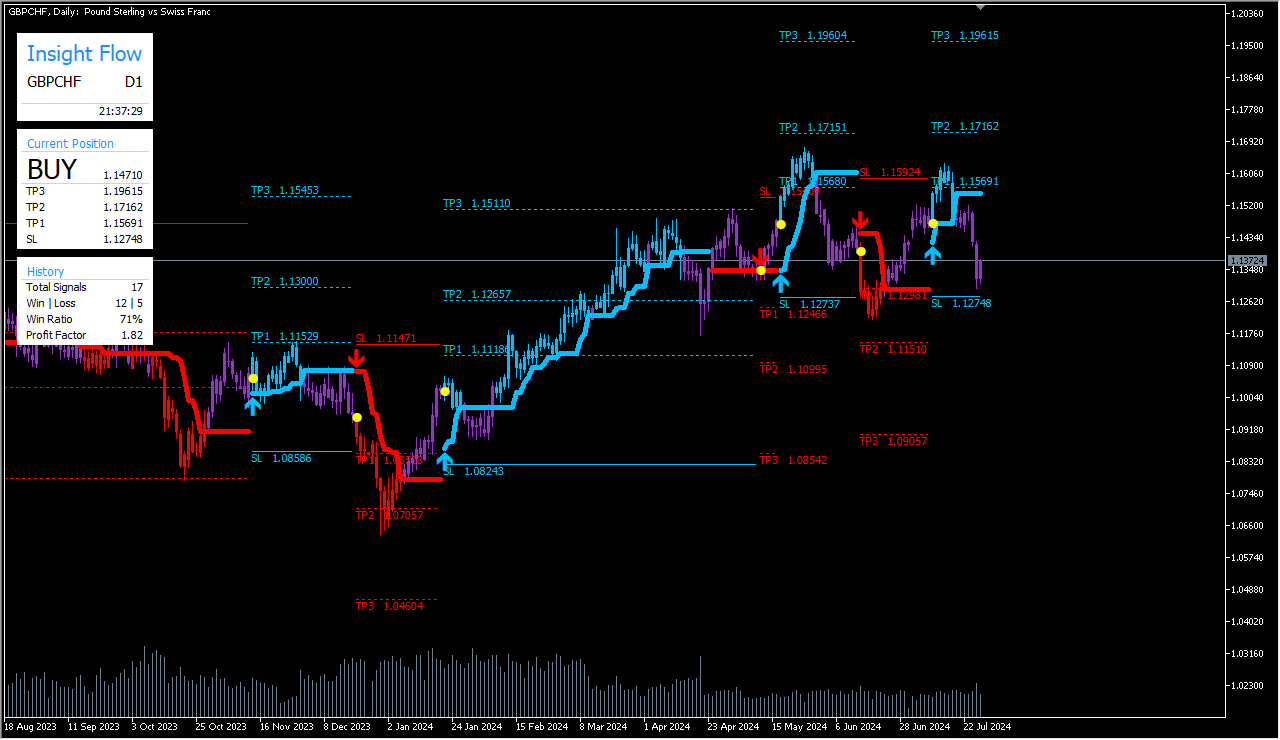
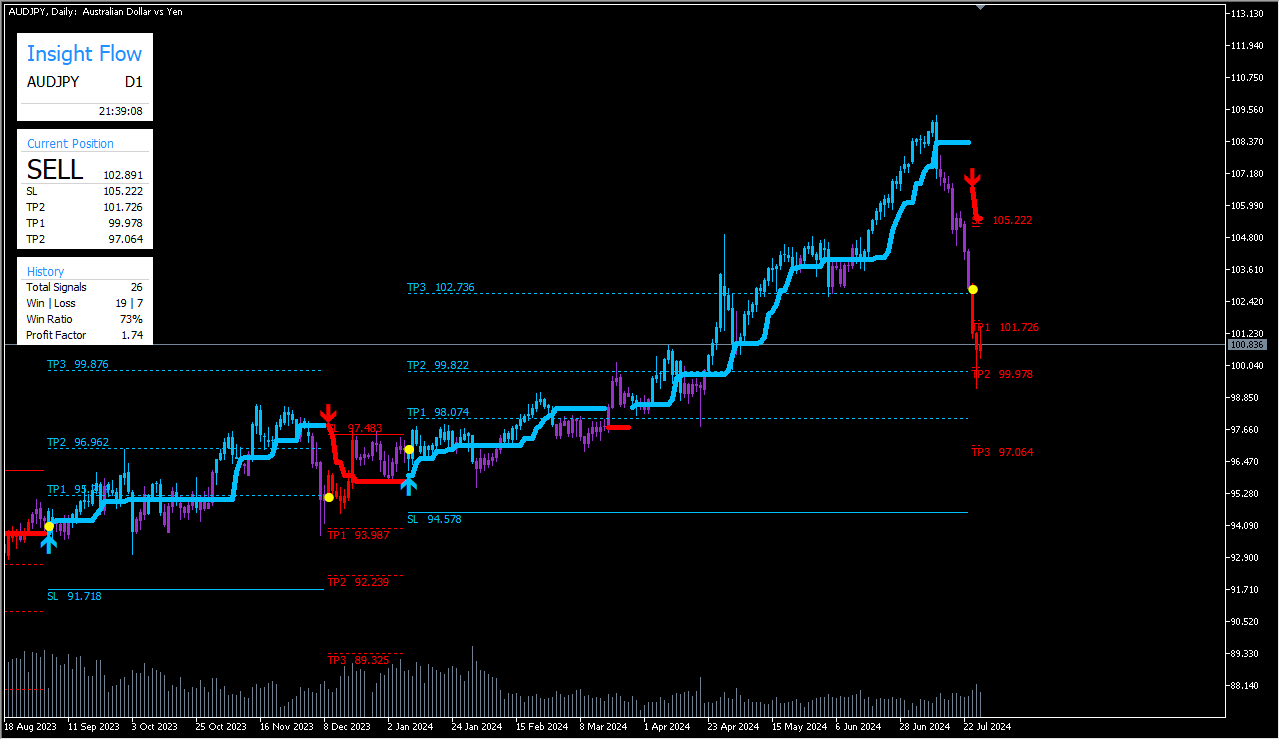
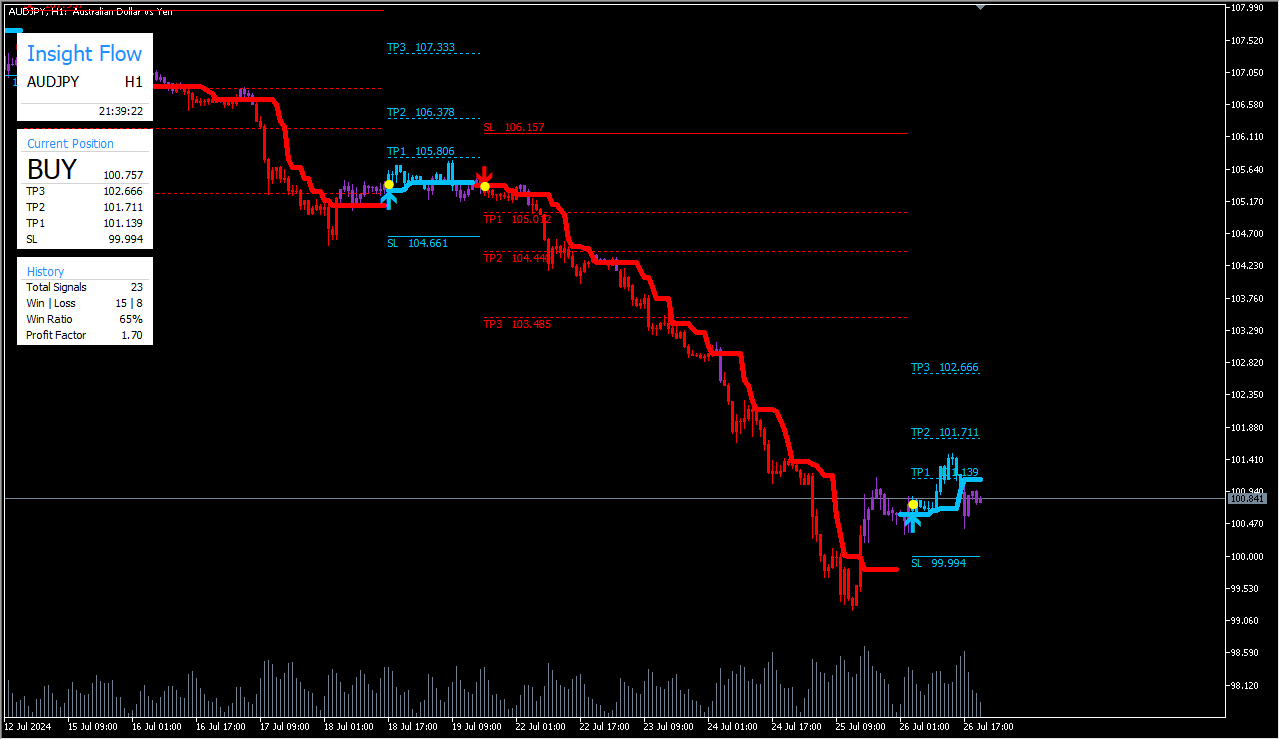
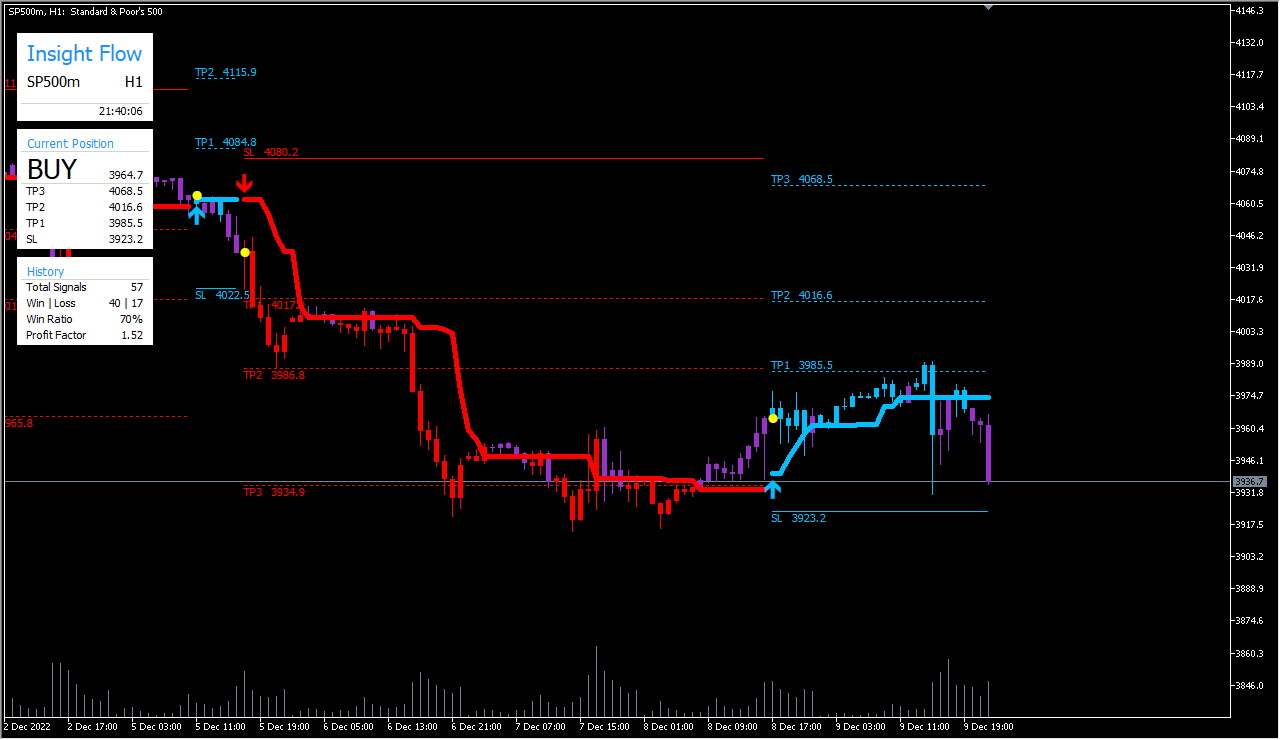
- Clear Signal Indicators: Provides arrow signals for clear entry and exit points.
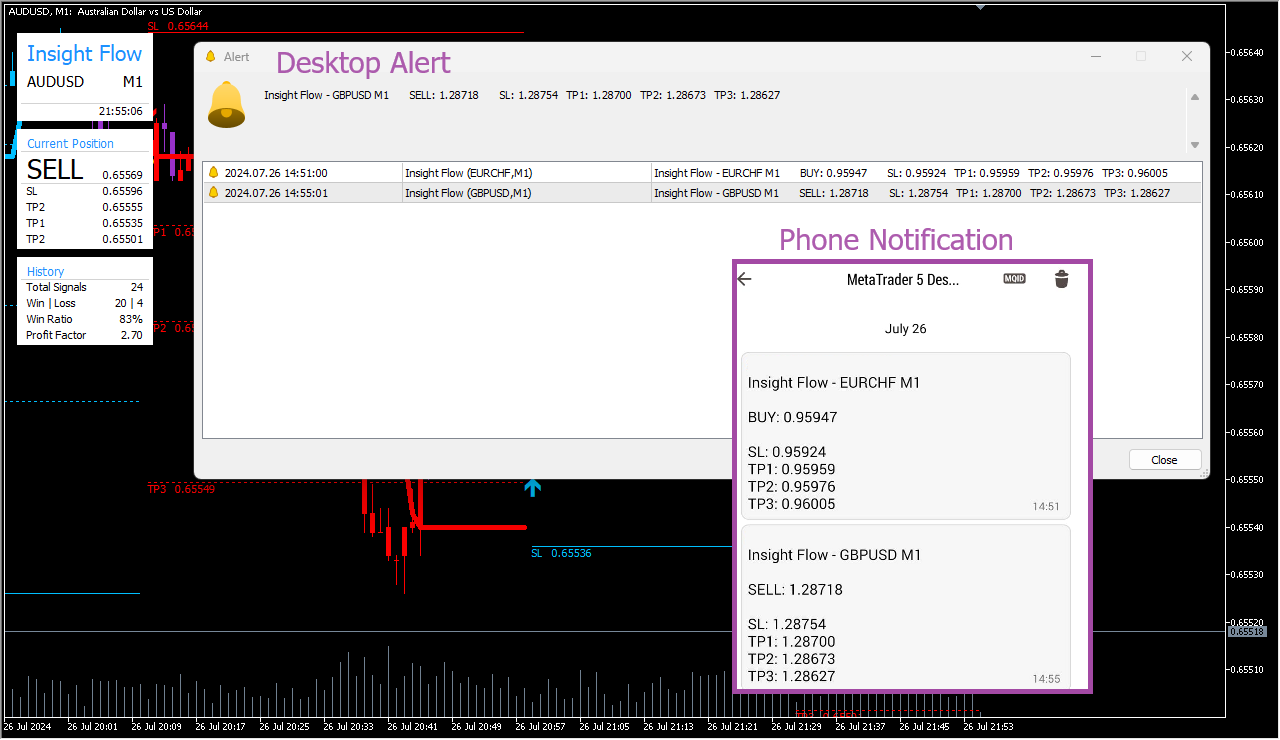
- Real-Time Alerts: Notifies traders with trade entry, stop loss, and take profit alerts.
- Multiple Take Profit Levels: Offers up to 3 take profit levels using sophisticated calculations.
- Adaptive Color Coding: Utilizes color coding to reflect price strength and momentum.
- User-Friendly Interface: Features a modern, intuitive interface for tracking essential metrics.
Input Parameters
Signal Settings
- Period: Default 17 - The period for calculating indicators.
- Signal Density : Default Normal - Controls the number of signals shown (options: More, Normal, Less).
- Take Profit Size: Default Medium - Size of the take profit levels.
- Stop Loss Size: Default Medium - Size of the stop loss levels.
- Number of Bars to Scan: Default 2000 - Defines how many bars to scan.
Alert Settings
- Print Signal: Default ON - Prints signals in the terminal.
- Notification: Default OFF - Sends notifications to mobile when a signal is generated.
- Alert with Message Box : Default OFF - Displays an alert with a message box for signals.
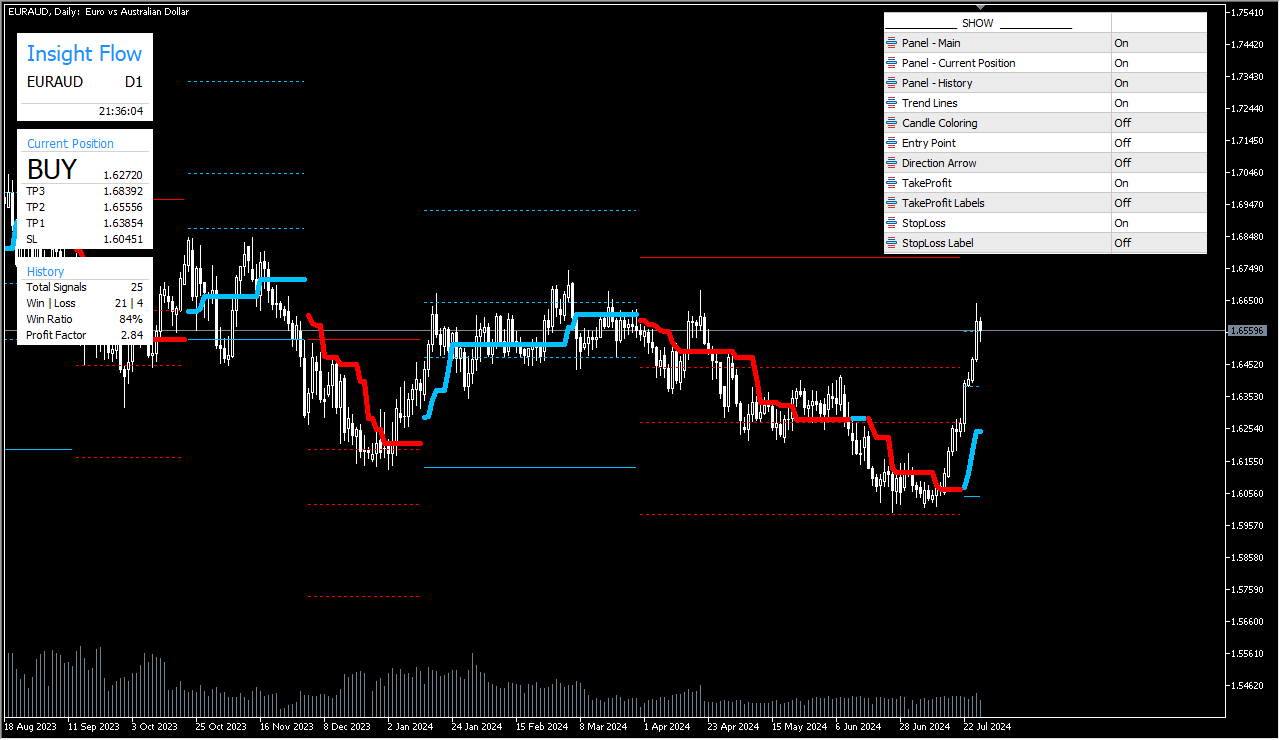
Display Settings
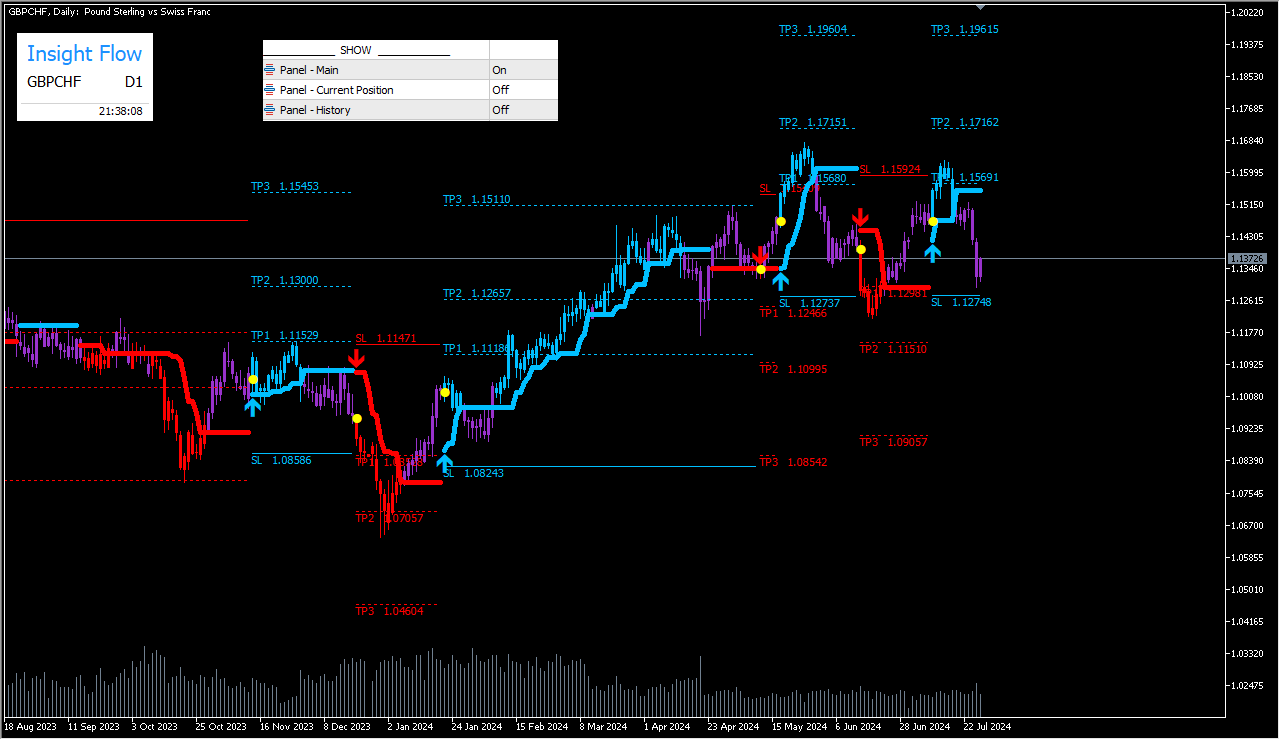
- Show Main Panel: Default ON - Displays the main panel on the chart.
- Show Current Position Panel: Default ON - Displays the current position panel on the chart.
- Show History Panel: Default ON - Displays the history panel on the chart.
- Show Trend Lines: Default ON - Displays trend lines on the chart.
- Show Candle Coloring: Default ON - Colors the candles based on signal strength and direction.
- Show Entry Point: Default ON - Marks entry points on the chart.
- Show Direction Arrow: Default ON - Displays arrows indicating trade direction.
- Show Take Profit: Default ON - Shows take profit levels on the chart.
- Show Take Profit Labels: Default ON - Labels take profit levels.
- Show Stop Loss: Default ON - Shows stop loss levels on the chart.
- Show Stop Loss Labels: Default ON - Labels stop loss levels.
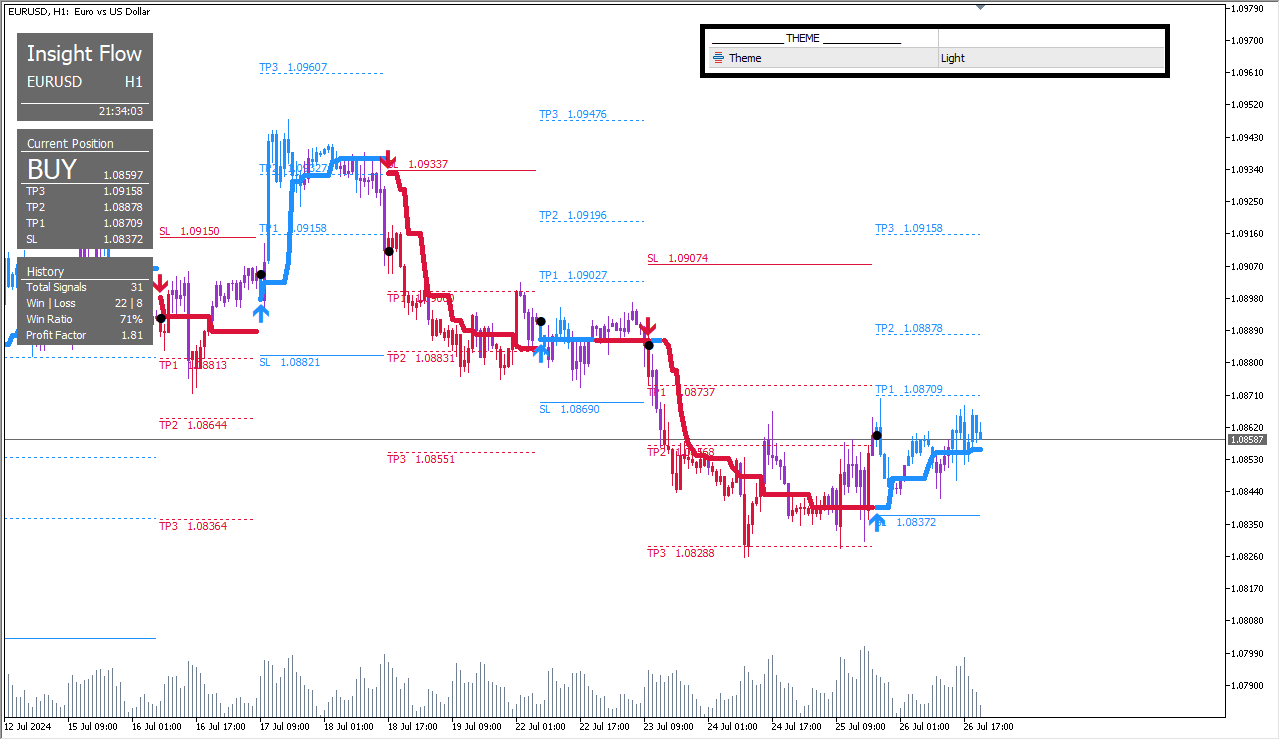
Theme Settings
- Theme: Default DARK - Selects the theme for the indicator (options: DARK, LIGHT).
Recommendations
- Currencies and Pairs: XAUUSD, EURUSD, AUDUSD, SP500 and more.
- Timeframe: All Timeframes.
- Account Types: All types of accounts.
By offering a blend of advanced technical analysis, user-friendly interface, and versatile trading strategies, Insight Flow provides traders with a robust tool to navigate the complexities of the financial markets. Whether you are a beginner or a seasoned trader, Insight Flow is equipped to enhance your trading performance.