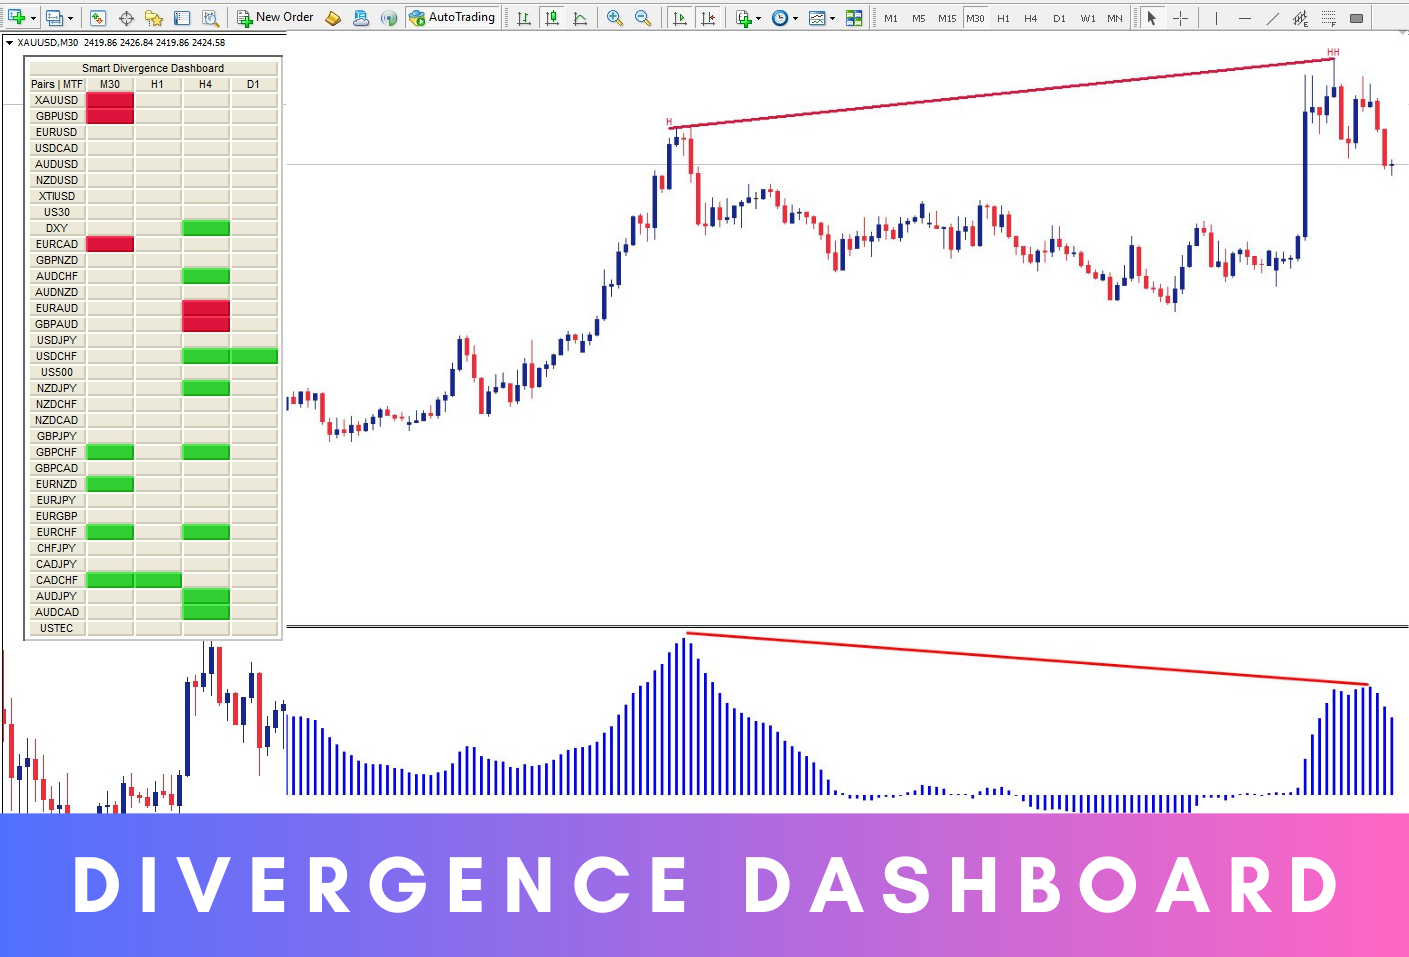
Smart Divergence Dashboard MT5
- インディケータ
- Suvashish Halder
- バージョン: 1.0
- アクティベーション: 10
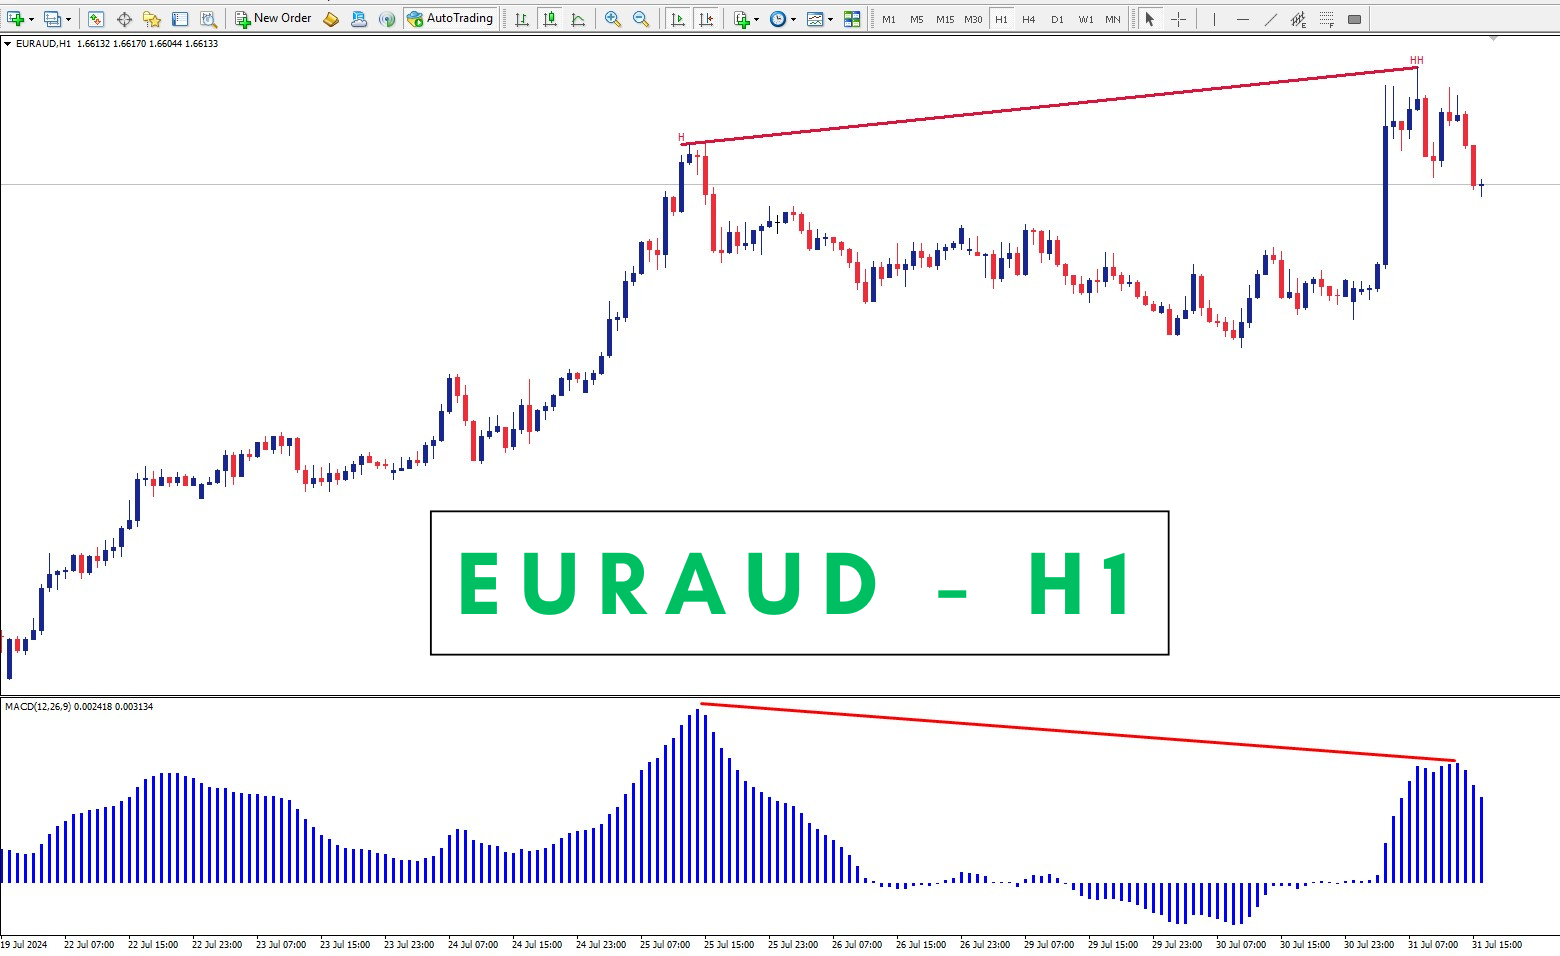
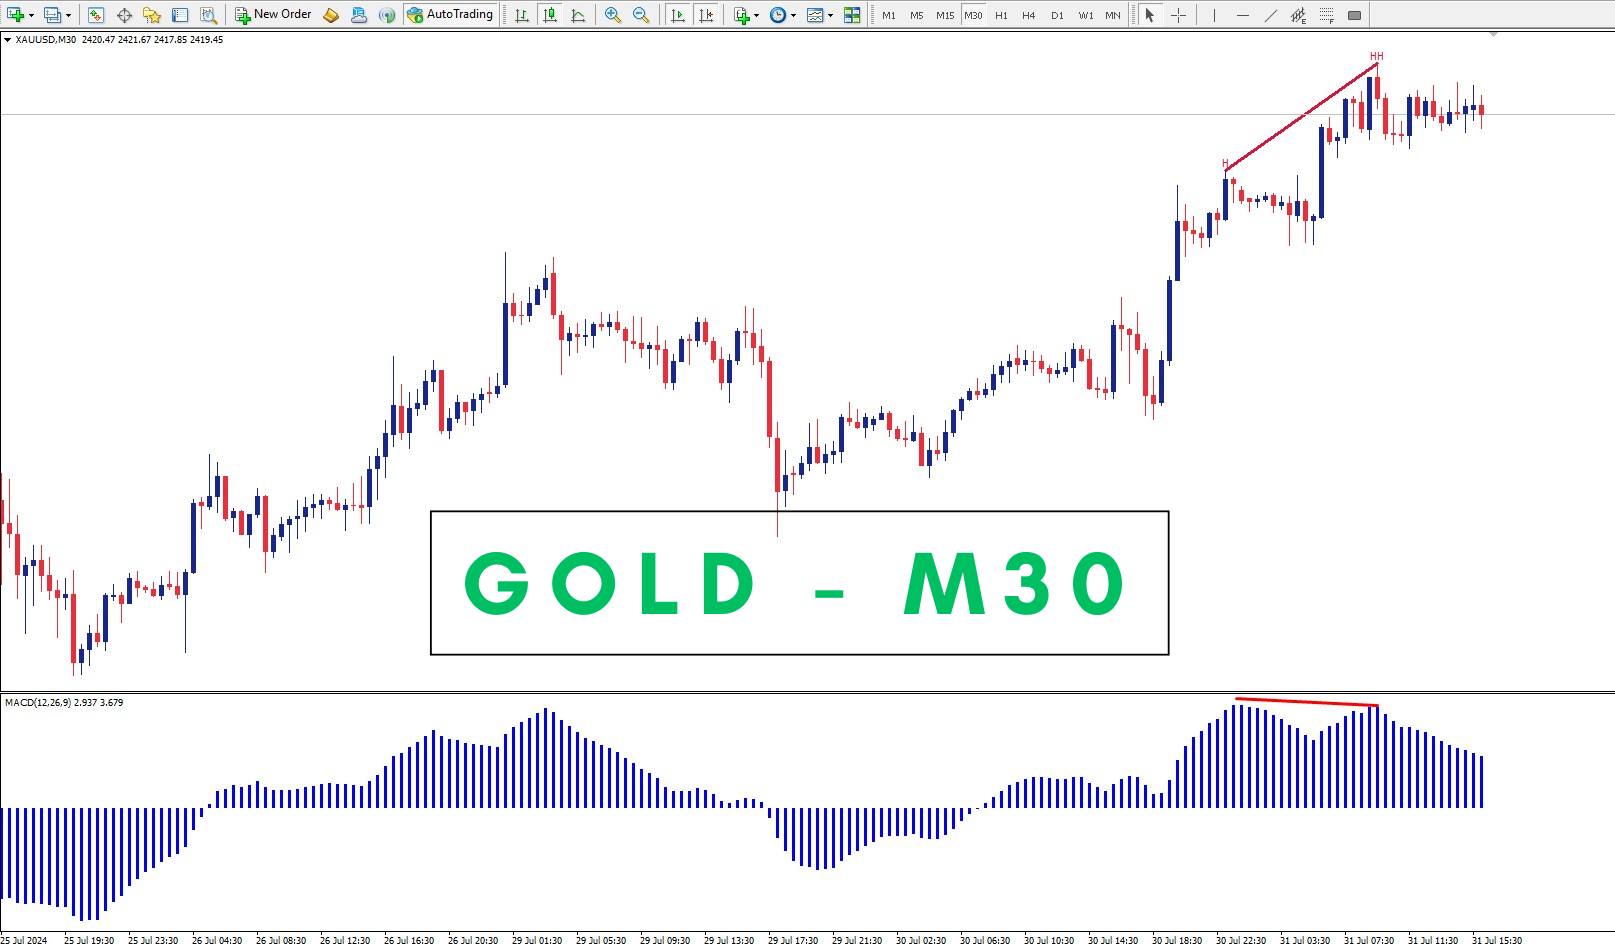
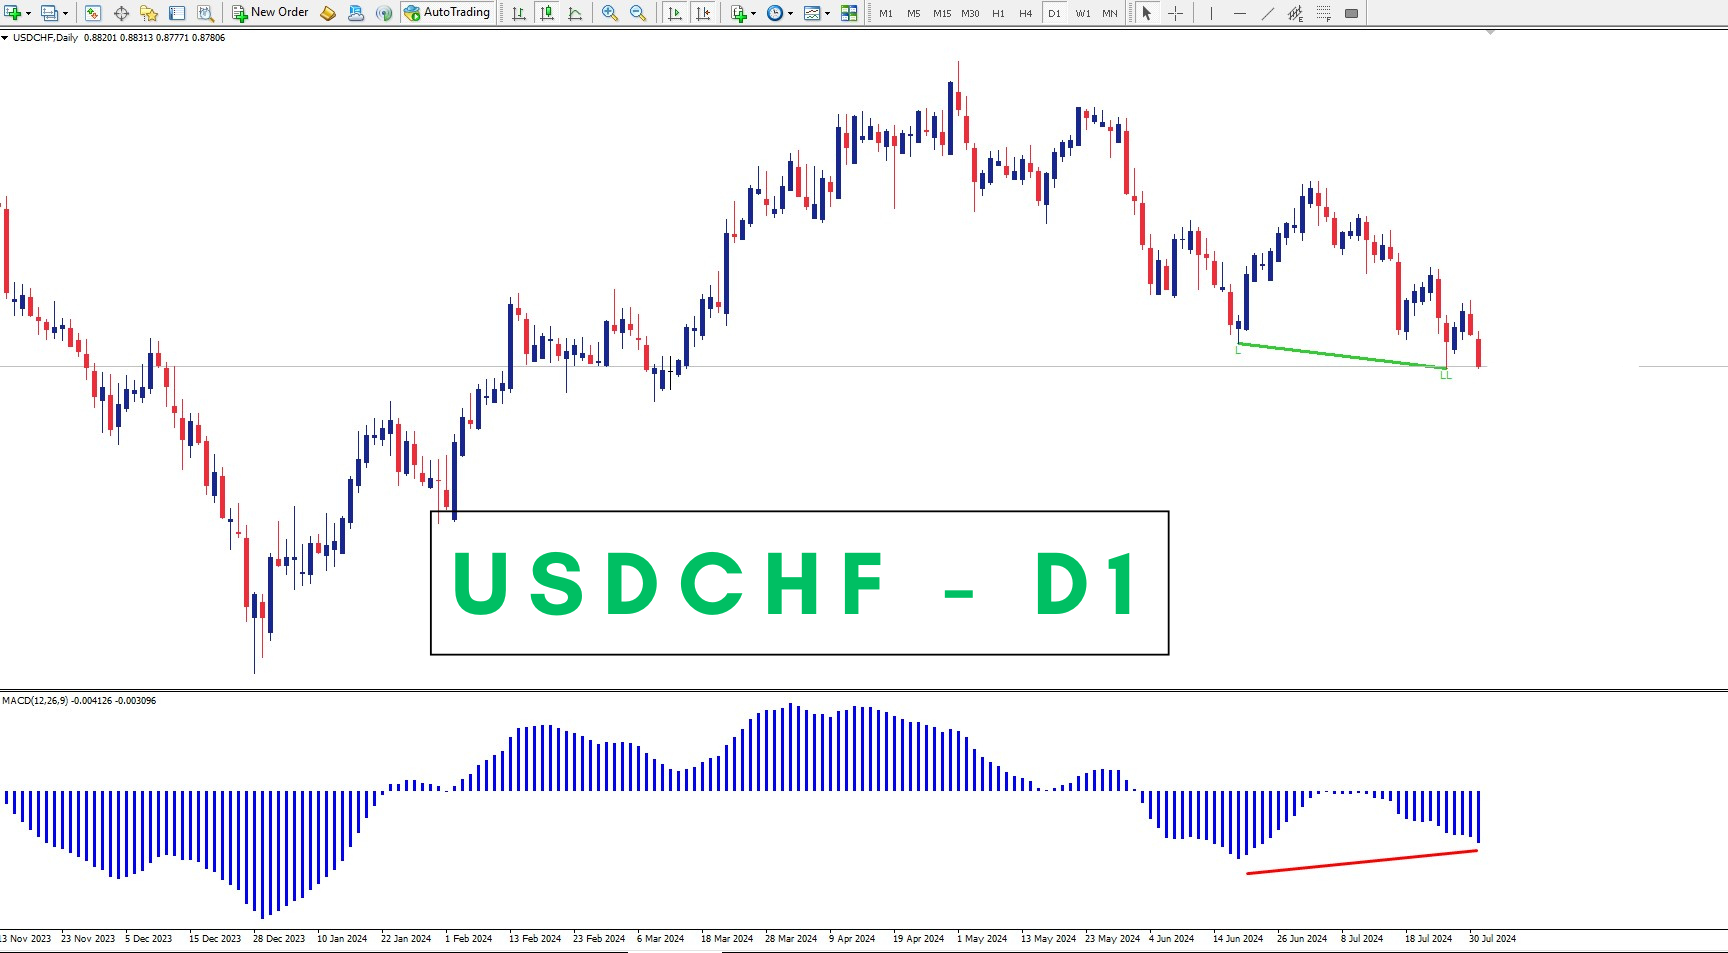
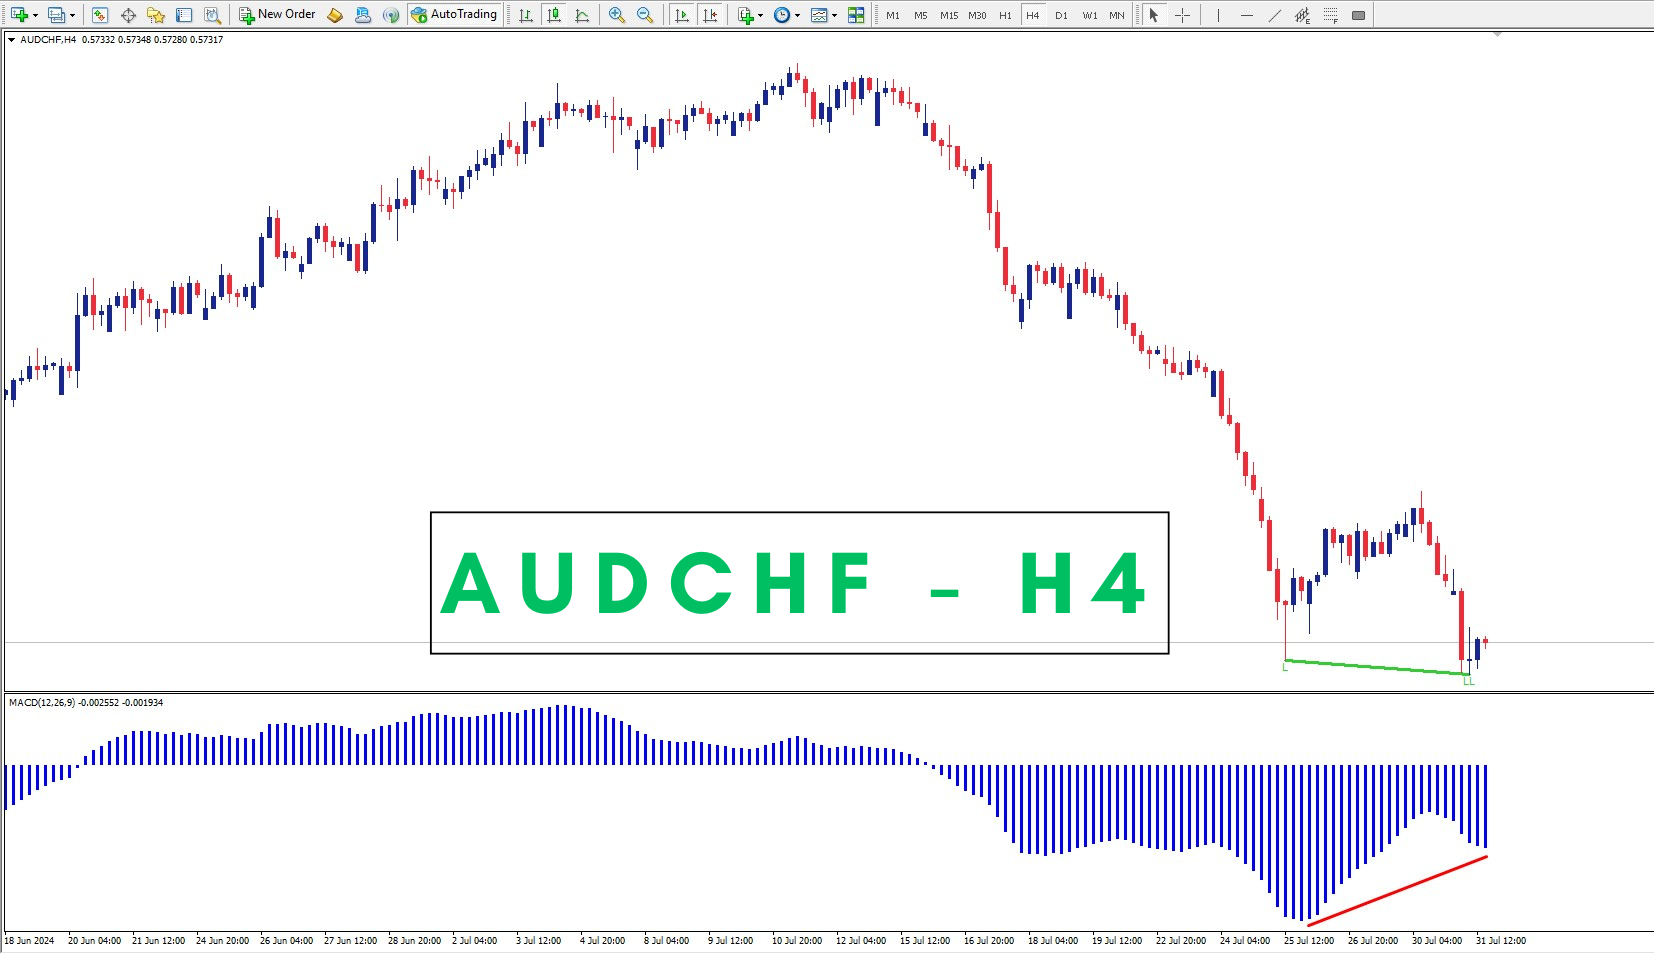
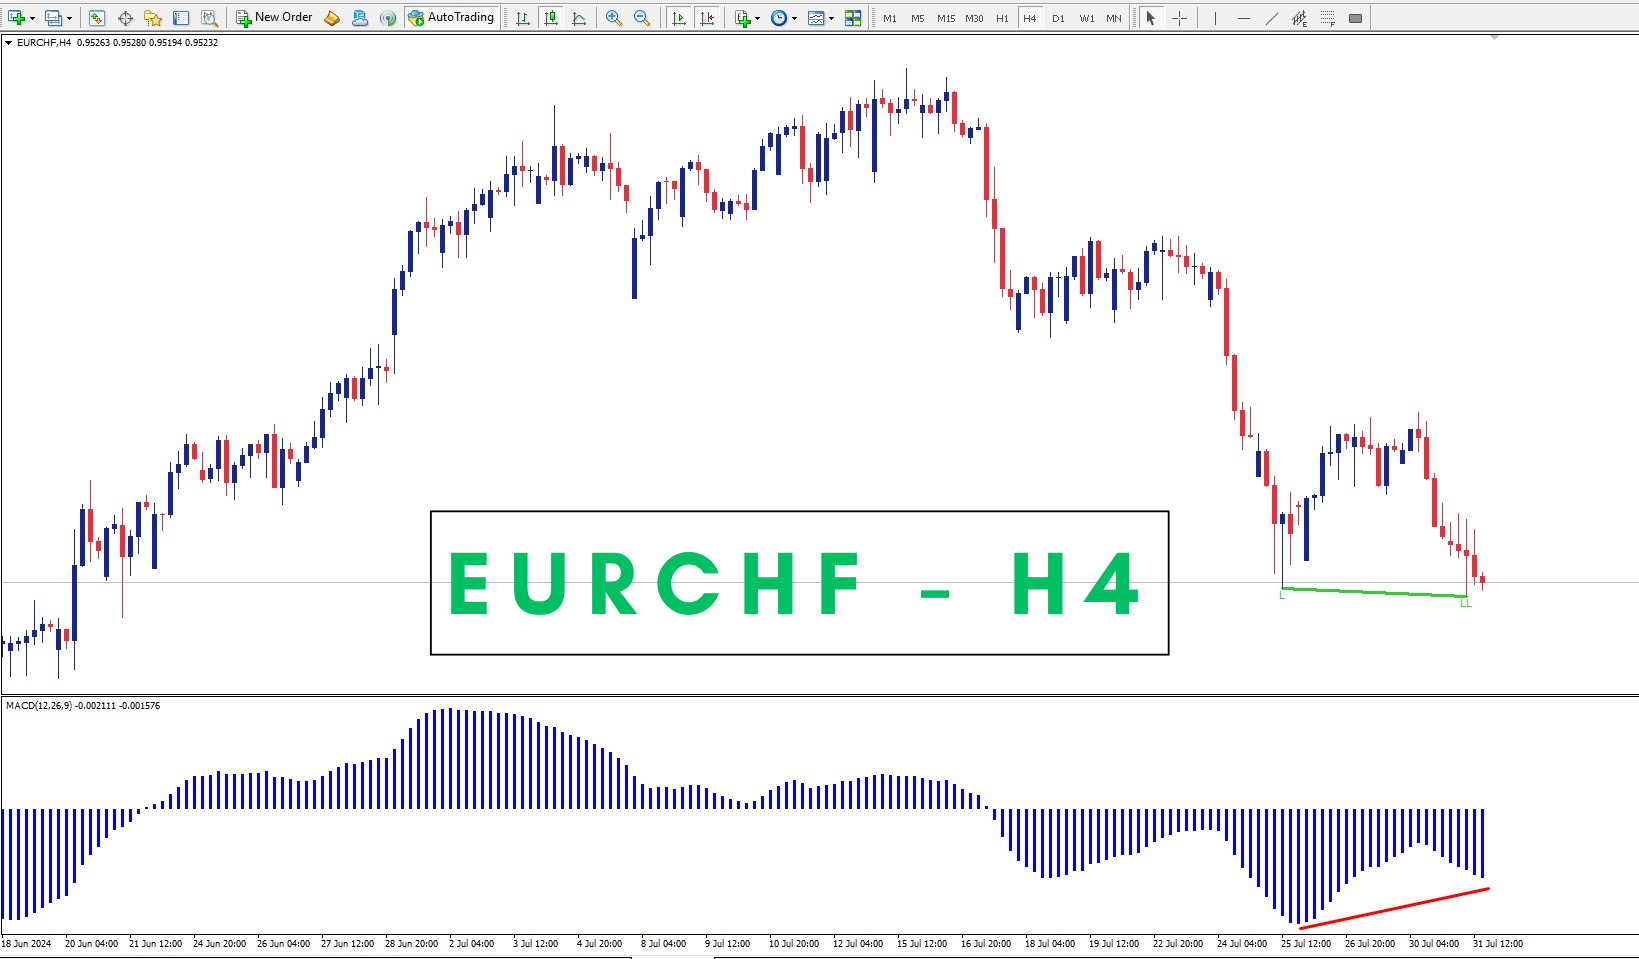
The Smart Divergence Dashboard is your ultimate tool for identifying high-probability trading opportunities. This cutting-edge indicator is meticulously designed to detect Regular Divergences, offering traders a clear and actionable advantage.
MT4 Version - https://www.mql5.com/en/market/product/120702/
Key Features:
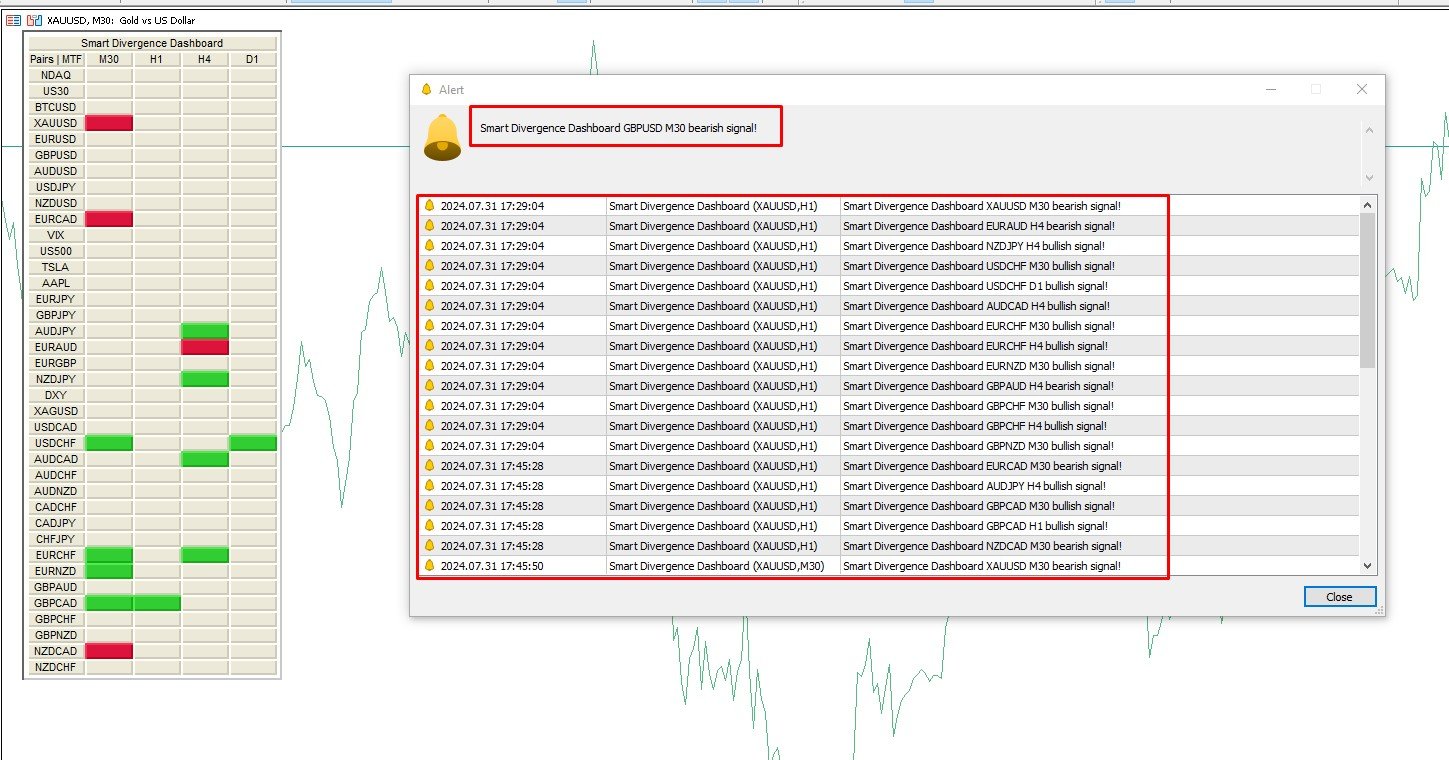
- Real-time Divergence Detection: Instantly pinpoints Higher High/Lower Low and Oscillator Higher Low divergences across multiple currency pairs and timeframes using Awesome Oscillator and MACD.
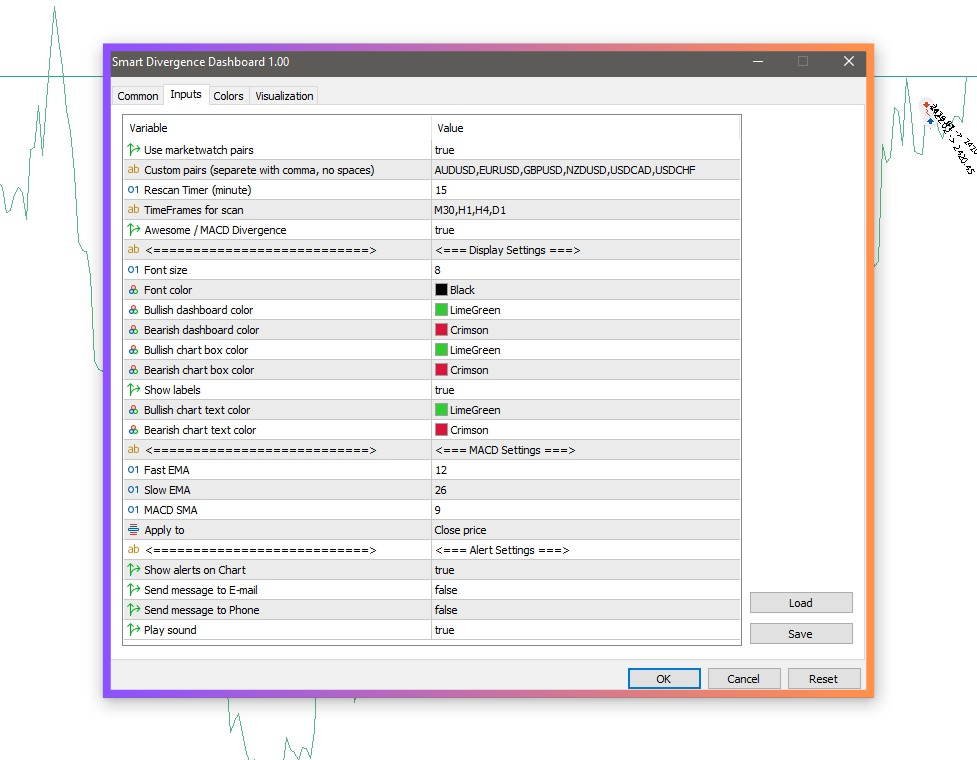
- Intuitive Dashboard: Visualize divergence patterns effortlessly with a user-friendly dashboard layout.
- Customizable Alerts: Receive timely notifications for divergence occurrences, allowing you to react promptly.
- Flexible Settings: Personalize the dashboard to your liking by adjusting font size, color, and layout preferences.
With the Smart Divergence Dashboard, you'll gain a competitive edge by:
- Identifying potential trend reversals or continuations early on
- Making informed trading decisions based on reliable divergence signals
- Saving time and effort by automating divergence detection
- Enhancing your overall trading performance
Experience the difference with the Smart Divergence Dashboard. Whether you're a seasoned trader or just starting, the Smart Divergence Dashboard is a valuable asset to your trading arsenal.
Feel free to contact me if you need any assistance.