• 概要
  • レビュー
  • コメント (3)

Trading Notes MT5

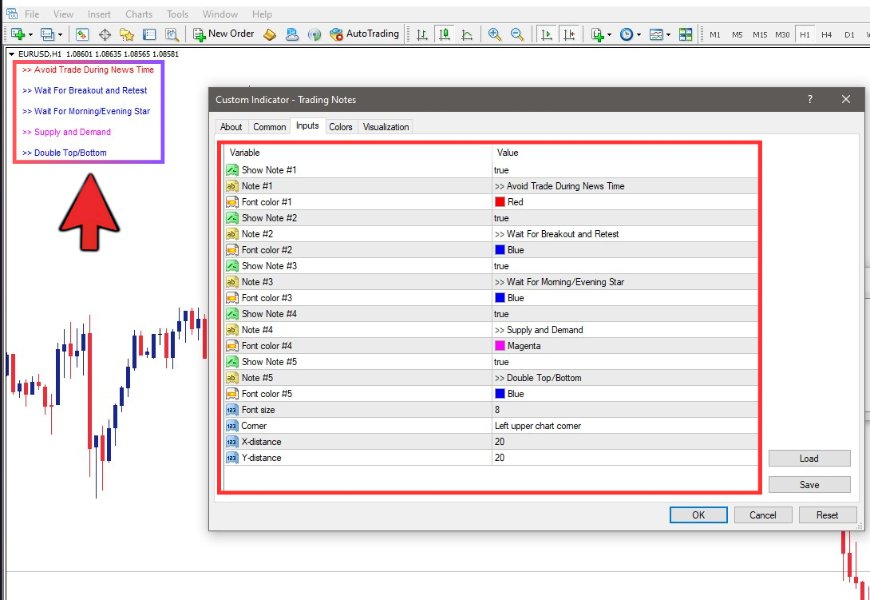
Trading Notes is an innovative tool designed for traders to streamline their decision-making process by allowing them to write and display important reminders or short details directly over their trading charts. This essential feature ensures that traders have quick access to their personalized checklist before opening any positions, enhancing their trading efficiency and accuracy.

Key Features:

  • Five Customizable Input Fields: Trading Notes offers five input fields, each capable of holding up to 300 words. This inputs allows traders to capture detailed notes, strategies, or reminders for reference during trading sessions.

  • Font Customization Options:

    • Font Color: Users can choose the color of their text, ensuring that their notes are clearly visible and distinguishable on their charts.
    • Font Size: The font size can be adjusted to meet individual preferences, making sure the text is readable without cluttering the chart.
  • Display Toggle: Each note input has a True/False option to display or hide the text. This feature allows traders to manage their notes efficiently, showing only the most relevant information when needed.

  • Text Location Options: Traders can position their notes in four different locations on the chart: Top Left, Top Right, Bottom Left, and Bottom Right. This flexibility ensures that the notes are placed in the most convenient and least intrusive area of the chart.

Purpose and Benefits: Trading Notes is designed to help traders maintain a clear and organized approach to their trading activities. By having a visible checklist and important notes directly on their charts, traders can reduce the risk of oversight and make more informed decisions. This tool is particularly beneficial for those who follow complex strategies or need constant reminders of their trading rules and objectives.

Trading Notes is an indispensable tool for traders looking to enhance their trading discipline and efficiency. With its customizable features and user-friendly interface, it ensures that critical information is always at the trader's fingertips, contributing to better trading outcomes.


Please note that we do not offer support for our free products; for comprehensive support and additional features, consider our premium options.

おすすめのプロダクト
MarketPro toolkit
Johannes Hermanus Cilliers
Start earning profits by copying All trades are sent by our successful Forex trader & are extremely profitable. You can earn profits by copying trades daily Trial Period included You'll also get access to extremely powerful trading education which is designed in a simple way for you to become a profitable trader, even if you have no trading experience. https://ec137gsj1wp5tp7dbjkdkxfr4x.hop.clickbank.net/?cbpage=vip
FREE
Lib5 EAPadPRO for MT5
Vladislav Andruschenko
4.4 (5)
MetaTrader5のエキスパートアドバイザーに情報パネルを追加するためのライブラリ。 プログラムの情報とインターフェースが取引で利益をもたらすことを保証することはできませんが、プログラムの最も単純なインターフェースでさえ第一印象を強めることができると断言できます。 エキスパートアドバイザーに パネルを追加するための詳細な説明と手順は、ブログにあります:   LIB-EAPADPROステップバイステップの説明 パネルの詳細な説明と EAPADPROの使用手順 MetaTrader4ライブラリバージョン 追加のプロセスは 10のステップで 構成されており、それらについては記事で詳しく説明しています。 ライブラリのインストール このサイトからライブラリをインストールします。 エキスパートアドバイザーを開きます。 コードをインストールするためのサンプルとステップバイステップガイド、ファイル Exp-EAPADPRO LIBRARY TEST(ブログにあります)を開き ます。 推奨事項に記載されているように各ステップを実行するか、サイトからのステップバイステップの説明を使用してください
FREE
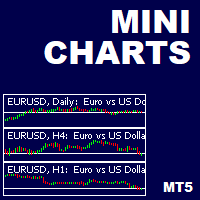
This is a utility indicator that creates mini charts on left side of the chart you are looking at. It is very useful to watch many timeframes simultaneously, without having to change between multiple charts. Its configuration is very simple. You can have up to 4 mini charts opened. They automatically load the template of the "parent" chart. If you have any doubt please contact me. Enjoy! This is a free indicator, but it took hours to develop. If you want to pay me a coffee, I appreciate a lot
FREE
Exact Time — detailed time on the seconds chart. The utility shows the opening time of the selected candle. This is necessary when working with seconds charts. For example, it can be used on a seconds chart built using the " Seconds Chart " utility, which helps to build seconds chart in the MT5 terminal. Use the CTRL key to turn on/off the time display on the chart.
FREE
Short description : TheTrendHunterMax   is a LIMITED VERSION tool that can be used either as a trading robot for automated trading or just a signal provider for manual trading.  As an EA, it uses the techniques we usually employ in trading like determining the highs and lows on the trading chart. With this, it determines the trend convergence and divergence in the chart. Combined with the volatility, price movements, it analyzes the possible order type that can be most profitable. By defaul
FREE
After purchasing, you can request and receive any two of my products for free! После покупки вы можете запросить и получить два любых моих продукта бесплатно! The utility is designed for manual placement of pending orders at the high and low of yesterday. The program has a built-in trailing stop, virtual take profit and stop loss. Unworked orders are deleted at the end of the day or manually. You may be interested in my other products:  https://www.mql5.com/ru/users/vypchela/seller Settings
FREE
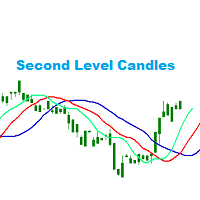
Second Level Candles And Alligator Indicators 每12秒产生一个K线,而且自带Alligator指标,对超短线选手交易非常有帮助。程序启动时可能不成功,是因为MT5 MqlTick 数据加载少的原因。可以通过修改显示的数据参数避免,比如display=100,程序正常之后再将参数调大 display=300 。如果数据不正常,也可以采用重新加载的方式解决。 如果您对这个指标有任何建议,请联系作者。  Second Level Candles And Alligator Indicators  produced a candle per 12 seconds,include Alligator, it's helpful to Short-Term Trading。You'd better reload the indicator every start MT5 or change display parameter to reslove data bug. Please attach author when  you had some su
FREE
Intervals
Alexandre Borela
5 (3)
このプロジェクトが好きなら、5つ星レビューを残してください。 インスタグラムでフォロー:borelatech 大規模なボリュームを取引するには、複数の楽器/チャートを調べる必要があります 新しい機会を見つける, このインジケータは、特定の特定のプロットによってあなたを助ける 数またはそのサフィックスの複数のレベルによって、それらを自動的に更新します 価格が変更されると、そうでなければ退屈なタスク。 例えば、GBPUSDでは、インジケーターの4つのインスタンスを チャートをプロットする: 線長100バーの各0.01間隔。 線の長さ25バーの0.0075間隔で終わる各価格。 線長50バーの0.0050間隔で終わる各価格。 25バーの線長で0.0025間隔で終わる各価格。 このようにして、定規に似ているので、この例が非常に見られます。 スクリーンショット。 また、色やラインのスタイルを異なるスタイルで設定できます。 レベルを視覚化しやすいようにします。
FREE
Follow The Line MT5
Oliver Gideon Amofa Appiah
4.52 (29)
This indicator obeys the popular maxim that: "THE TREND IS YOUR FRIEND" It paints a GREEN line for BUY and also paints a RED line for SELL. (you can change the colors). It gives alarms and alerts of all kinds. IT DOES NOT REPAINT and can be used for all currency pairs and timeframes. Yes, as easy and simple as that. Even a newbie can use it to make great and reliable trades. NB: For best results, get my other premium indicators for more powerful and reliable signals. Get them here: https://www.m
FREE
Hello friends. I wrote this utility specifically for use in my profile with a large number of Expert Advisors and sets ("Joint_profiles_from_grid_sets"   https://www.mql5.com/en/blogs/post/747929 ). Now, in order to limit losses on the account, there is no need to change the "Close_positions_at_percentage_of_loss" parameter on each chart. Just open   one   additional chart, attach this utility and set the desired percentage for closing all trades on the account. The utility has the following fu
FREE
QuantumAlert RSI Navigator is a free indicator available for MT4/MT5 platforms, its work is to provide "alerts" when the market is inside "overbought and oversold" regions in the form of "buy or sell" signals. This indicator comes with many customization options mentioned in the parameter section below, user can customise these parameters as needful. Join our MQL5 group , where we share important news and updates. You are also welcome to join our private channel as well, contact me for the priva
FREE
Donchian Pro
Paulo Henrique Faquineli Garcia
5 (3)
The Donchian Channel Channels are among the most popular tools of technical analysis, as they visually convey to the analyst the limits within which most price movement tends to occur. Channel users know that valuable information can be obtained at any time, whether prices are in the central region of a band or close to one of the border lines. One of the best known techniques to explore these concepts is Bollinger Bands. However, John Bollinger was not the only one to research the applicatio
FREE
LT Nrtr
Sie Samuel Roland Youl
強力なNRTR(Nick Rypock Trailing Reverse)インディケーターをご紹介します。トレンドの反転を特定し、効果的なトレーリングストップレベルを設定することを目指すトレーダーにとって必須のテクニカルツールです。ニック・ライポックによって開発されたこのインディケーターは、常に変化する市場条件に適応する独自のアルゴリズムを採用しており、どんなトレーダーのツールキットにも欠かせない存在となっています。 以下は、トレーダーがこのインディケーターを使用する人気のある方法です: 1. トレンドの反転:NRTRインディケーターは、トレンドが反転する予兆があるときに明確なシグナルを生成します。インディケーターラインが価格チャートを交差することに注意し、トレンドの方向が変わる可能性を示します。 2. トレーリングストップ:NRTRは、トレンド市場で利益を保護する頼りになるトレーリングストップツールとしても機能します。価格が望む方向に動くと、NRTRラインが価格の下または上に動的に追随し、適応可能なストップロスレベルを提供します。 カスタマイズ可能なパラメータ:NR
FREE
This indicator calculates the volume profile and places labels that correspond to the VAH, VAL and POC levels, for each candle individually. Indicator operation features The indicator works on the timeframes from M3 to MN, but it uses the history data of smaller periods: M1 - for periods from M3 to H1, M5 - for periods from H2 to H12, M30 - for the D1 period, H4 - for the W1 period, D1 - for the MN period. The color and location of the VAL, VAH and POC labels on the current candle are consider
FREE
Are you tired of drawing trendlines every time you're analyzing charts? Or perhaps you would like more consistency in your technical analysis. Then this is for you. This indicator will draw trend lines automatically when dropped on a chart. How it works Works similar to standard deviation channel found on mt4 and mt5. It has 2 parameters: 1. Starting Bar 2. Number of bars for calculation The   starting bar   is the bar which drawing of the trend lines will begin, while the   number of bars for c
FREE
Swiss VWAPsimple Motivation Did not find free VWAP that works, the one that I found craseh. So I created a VWAP which calculates values only for the actual day. So computer resouces are not over stressed. What is VWAP, how is it used?  VWAP stands for Volume Weighed Average Price, it calculates the running sum of tick volume and the runnung sum of price times tickvolume. The division of these sums result in a weighed price (Sum P*V/Sum V). The calculation starts normally at midnight. The value
FREE
Tick Database — export of tick database from MT5 terminal to MT4. The utility provides access to the tick database in real time. This is necessary to generate synthetic charts in the MT4 terminal, which initially does not provide for loading a tick database. For example, you can organize permanent access to the tick database for the " Seconds Chart " utility, which create seconds charts in the MT4 terminal. If the opening time of the last candle in the terminals is different, then you need to sp
FREE
Simple Weis Wave
Jean Jacques Huve Ribeiro
3.67 (3)
One of the best tools for analyzing volume, Weis Wave was idelized by David Weis, to facilitate the reading of directional flow. For the VSA method disciples it is an evolution of the practices created by Richard Wycoff, facilitating a predictive reading of the market, always seeking an accumulation and distribution of the negotiated contracts. Cumulative wave volume  Range of wave ( removed) Average Wave volume Ref "Tim Ord lectures" ( removed)
FREE
This indicator is a zero-lag indicator and displays  strength of trend change . True Trend  Oscillator Pro works best in combination with True Trend Moving Average Pro that displays exact trend as is. Oscillator value is exact price change in given direction of the trend. True Trend Moving Average Pro: https://www.mql5.com/en/market/product/103586 If you set PERIOD input parameter to 1 this indicator becomes a sharpshooter for binary options. Developers can use True Trend Oscillator in E
FREE
This Tradepanel is an Utility for Traders Who want ot use Basic MoneyManagement for Calculation of Lotsize  I have created the basic edition only to give an Overview with Limited Functionality Full Features are available with  Auto TradePanel  Pro. (This is Only Because it can not be Tested in Strategy Tester ).  Complete Description is available at  "Auto TradePanel Pro".  in This Version Basic Functionality ( Calculation of Lotsize ) open /close Positions is working in the same way as in Pro
FREE
インディケータは現在のクオートを作成し、これを過去のものと比較して、これに基づいて価格変動予測を行います。インジケータには、目的の日付にすばやく移動するためのテキスト フィールドがあります。 オプション: シンボル - インジケーターが表示するシンボルの選択; SymbolPeriod - 指標がデータを取る期間の選択; IndicatorColor - インジケータの色; HorisontalShift - 指定されたバー数だけインディケータによって描画されたクオートのシフト; Inverse - true は引用符を逆にします。false - 元のビュー。 ChartVerticalShiftStep - チャートを垂直方向にシフトします (キーボードの上下矢印)。 次は日付を入力できるテキストフィールドの設定で、「Enter」を押すとすぐにジャンプできます。
Volume Weighted Average Price or VWAP is an indicator wich shows different average prices on chart. This is very useful to find strong negotiation price areas and as trend following. Configurations: Day, Week and Month - Show different VWAPs according to the period. You can change each line style on "colors" tab. Any doubt or suggestion please contact us. Enjoy! This is a free indicator, but it took hours to develop. If you want to pay me a coffee, I appreciate a lot   <3 PayPal, Skrill, Ne
FREE
Pairs Navigator   is a simple and easy-to-use tool that allows you to view all of your charts in a single window. This eliminates the need to open multiple charts from the Market Watch window, saving you time and effort. Pairs Navigator is also very lightweight, so it will not put a strain on your RAM or cause your MT4/5 platform to hang. To use Pairs Navigator, simply drag and drop the currency pairs you want to view into the Pairs Navigator window. You can then easily switch between charts by
FREE
The utility draws reversal levels using the formulas for each of the selected number of candles: Pivot = (high + close + low) / 3 R1 = ( 2 * Pivot) - low S1 = ( 2 * Pivot) - high R2 = Pivot + (R1 -S1) R3 = high + ( 2 * (Pivot - low)) S2 = Pivot - (R1 - S1) S3 = low - ( 2 * (high - Pivot)) H = high L = low U = if the candle is bullish, then close. Otherwise - open D = if the candle is bullish, then open. Otherwise - close On any timeframe. After a new candle closes on the calculated timefr
FREE
HiperCube レンコ キャンドルへようこそ このインジケーターは、市場の実際の情報を提供し、それをレンコ キャンドル スタイルに変換します。 定義 レンコ チャートは、価格変動を測定およびプロットする金融チャートの一種で、レンガ (またはバー) を使用して価格の動きを表します。従来のローソク足チャートとは異なり、レンコ チャートは時間ベースの情報を表示せず、価格変動のみに焦点を当てています。 機能: インジケーターを別のウィンドウに表示 キャンドルの色をカスタマイズ キャンドル/レンガのサイズをピップ単位でカスタマイズ Chat gptとAIが開発に使用されました レンコを使用した戦略の例: トレンドを特定 レンコ キャンドルでプルバックとエングルフィングを待つ エントリーする SL エングルフィングの下限 TP リスク リワード 1:2、1:3... これは例であり、基本または新しい戦略になる可能性があることに注意してください。ただし、実際のアカウントで使用する前に試してテストしてください。この情報は、レンコ キャンドル ハイパーキューブ インジケーターの使用方
FREE
Value Chart Candlesticks
Flavio Javier Jarabeck
4.7 (10)
The idea of a Value Chart indicator was presented in the very good book I read back in 2020 , " Dynamic Trading Indicators: Winning with Value Charts and Price Action Profile ", from the authors Mark Helweg and David Stendahl. The idea is simple and the result is pure genius: Present candlestick Price analysis in a detrended way! HOW TO READ THIS INDICATOR Look for Overbought and Oversold levels. Of course, you will need to test the settings a lot to find the "correct" one for your approach.
FREE
Free automatic Fibonacci is an indicator that automatically plots a Fibonacci retracement based on the number of bars you select on the BarsToScan setting in the indicator. The Fibonacci is automatically updated in real time as new highest and lowest values appears amongst the selected bars. You can select which level values to be displayed in the indicator settings. You can also select the color of the levels thus enabling the trader to be able to attach the indicator several times with differe
FREE
Axilgo PipPiper CoPilot
Theory Y Technologies Pty Ltd
5 (2)
Axilgo Pip Piper CoPilot Elevate your trading game with the Axilgo Pip Piper CoPilot, the first in our revolutionary Pip Piper Series. This all-inclusive toolset is meticulously crafted for serious traders, focusing on key areas such as Risk Management, Trade Management, Prop Firm Rule Compliance, and Advanced Account Management . With CoPilot, you’re not just investing in a tool—you’re gaining a strategic partner in the intricate world of trading. Important Notice: To ensure you receive the fu
FREE
Combining the best of Price Action , Directional Movement , and Divergence/Convergence analysis, Candle Color Trend is a easy and reliable way to identify trend direction. The indicator automatically paints the candles according to the assumption that an uptrend is defined by prices that form a series of higher highs and higher lows. In contrast, a downtrend is defined by prices that form a series of lower highs and lower lows. Additionally, ADX Wilder indicator is used to measure trend weakness
FREE
Gap Catcher
Mikita Kurnevich
5 (3)
Read more about my products Gap Cather - is a fully automated trading algorithm based on the GAP (price gap) trading strategy. This phenomenon does not occur often, but on some currency pairs, such as AUDNZD, it happens more often than others. The strategy is based on the GAP pullback pattern. Recommendations:  AUDNZD  TF M1  leverage 1:100 or higher  minimum deposit 10 USD Parameters:  MinDistancePoints - minimum height of GAP  PercentProfit - percentage of profit relative to GAP lev
FREE
このプロダクトを購入した人は以下も購入しています
このライブラリを使用すると、任意の EA を使用して取引を管理でき、説明に記載されているスクリプト コードを使用して任意の EA に簡単に統合でき、完全なプロセスを示すビデオのデモ例も利用できます。 - 指値注文、SL 指値注文、利食い指値注文の発行 - マーケット、SLマーケット、TPマーケットの注文を行う - 指値注文の変更 - 注文をキャンセルする - 注文のクエリ - レバレッジ、マージンの変更 - 位置情報の取得 もっと... MT5 に Binance チャートがない場合を除き、暗号チャートのレンタルはオプションです。 スクリプトのデモについては、 ここをクリックしてください トレーディングパネルでの取引をご希望の場合は、 この製品に興味があるかもしれません
The library is dedicated to help manage your trades, calculate lot, trailing, partial close and other functions. Lot Calculation Mode 0: Fixed Lot. Mode 1: Martingale Lot (1,3,5,8,13) you can use it in different way calculate when loss=1 ,when profit=0. Mode 2: Multiplier Lot (1,2,4,8,16) you can use it in different way calculate when loss=1 ,when profit=0. Mode 3: Plus Lot (1,2,3,4,5) you can use it in different way calculate when loss=1 ,when profit=0. Mode 4: SL/Risk Lot calculate based on
WalkForwardOptimizer MT5
Stanislav Korotky
3.86 (7)
WalkForwardOptimizer library allows you to perform rolling and cluster walk-forward optimization of expert advisers (EA) in MetaTrader 5. To use the library include its header file WalkForwardOptimizer.mqh into your EA source code, add call provided functions as appropriate. Once the library is embedded into EA, you may start optimization according to the procedure described in the User guide . When it's finished, intermediate results are saved into a CSV file and some special global variables.
Order Book, known also as Market Book, market depth, Level 2, - is a dynamically updated table with current volumes of orders to buy and to sell specific financial instument at price levels near Bid and Ask. MetaTrader 5 provides the means for receiving market book from your broker, but in real time only, without access to its history. The library OrderBook History Library reads market book state in the past from archive files, created by OrderBook Recorder . The library can be embedded into you
Native Websocket
Racheal Samson
5 (5)
An   easy to use, fast,  asynchronous   WebSocket library  for MQL5. It supports: ws://   and   wss://  (Secure "TLS" WebSocket) text   and   binary   data It handles: fragmented message  automatically (large data transfer) ping-pong   frames  automatically (keep-alive handshake) Benefits: No DLL required. No OpenSSL installation required. Up to 128 WebSocket Connections from a single program. Various Log Levels for error tracing Can be synchronized to MQL5 Virtual Hosting . Completely native to
MetaCOT 2 CFTC ToolBox is a special library that provides access to CFTC (U.S. Commodity Futures Trading Commission) reports straight from the MetaTrader terminal. The library includes all indicators that are based on these reports. With this library you do not need to purchase each MetaCOT indicator separately. Instead, you can obtain a single set of all 34 indicators including additional indicators that are not available as separate versions. The library supports all types of reports, and prov
This is a simplified and effective version of the library for walk forward analysis of trading experts. It collects data about the expert's trade during the optimization process in the MetaTrader tester and stores them in intermediate files in the "MQL5\Files" directory. Then it uses these files to automatically build a cluster walk forward report and rolling walk forward reports that refine it (all of them in one HTML file). Using the WalkForwardBuilder MT5 auxiliary script allows building othe
Cryptocurrency analysis has never been easier with Crypto Charts for MetaTrader 5. Now, trading on BitMEX has never been easier with BitMEX Trading API for MetaTrader 5. BitMEX Trading API library was built to be as easy to use as possible. Just include the library into your Expert Advisor or Script, call the corresponding methods and start trading! Features Trade on BitMEX and BitMEX Testnet. Build and automate your strategies. Concern more with the trading strategy logic and less with the c
Teclado trader, é uma BIBLIOTECA que você pode chamar no OnChartEvent para abrir posição de compra/venda/zerar, os botões padrões são: V = venda C = compra Z = zerar posições a mercado S = zerar posições opostas e depois a mercado X = zerar posições opostas Além da função de teclado, é possível mostrar os estados do ExpertAdvisor usando o MagicId, com informação de: lucro mensal, semanal, diario, e posição aberta, para isto use o OnTick, ou qualquer outro evento (OnTimer / OnTrade / OnBookEv
Goliath Mt5
Nicolokondwani Biscaldi
Goliath MT5 - scalper fully automated Expert Advisor for medium-volatile forex markets P roperties: The Library trades 10 currency pairs (USDCHF, EURCHF, EURGBP, AUDUSD, USDCAD, GBPUSD, EURUSD, NZDUSD, CADCHF, EURAUD, EURCAD, AUDJPY) The Library does not use martingale The Library sets a fixed stop loss and take profit for all orders The Library only trades a user input volume The Library can be installed on any currency pair and any timeframe Recommendations: Before using on a real account,
Binance Library
Hadil Mutaqin SE
5 (1)
The library is used to develop automatic trading on Binance Spot Market from MT5 platform. Support all order types: Limit, Market, Stop-Limit and Stop-Market. Support margin trading. Automatically display the chart on the screen. Usage: - Open MQL5 demo account - Move BinanceLib.ex5 from folder \MQL5\Scripts\Market to MQL5\Libraries - Download Header   file and EA sample https://www.mql5.com/en/code/download/34972_260999.zip Copy Binance.mqh header file to folder \MQL5\Include Copy  BinanceEA-
Gold plucking machine   Gold plucking machine is an Expert Advisor designed specifically for trading gold. The operation is based on opening orders using the Fast and Slow lines indicator, thus the EA works according to the "Trend Follow" strategy, which means following the trend. Use grid strategy to place orders without stop loss operation, so please make sure the account has sufficient funds. magic number      -  is a special number that the EA assigns to its orders. Lot Multiplier        -
Gold plucking machine S   Gold plucking machine  S Gold plucking machine S   is an Expert Advisor designed specifically for trading gold. The operation is based on opening orders using the Fast and Slow lines indicator, thus the EA works according to the "Trend Follow" strategy, which means following the trend. Use grid strategy to place orders without stop loss operation, so please make sure the account has sufficient funds. magic number        -  is a special number that the EA assigns to its
The library is used to develop automatic trading on Binance Futures Market from MT5 platform. Support all order types: Limit, Market, Stop-Limit, Stop-Market , StopLoss and TakeProfit. Automatically display the chart on the screen. Usage: - Open MQL5 demo account - Move BinanceFuturesLib.ex5 from folder \MQL5\Scripts\Market to MQL5\Libraries -  Download Header file and EA sample https://www.mql5.com/en/code/download/34976_252386.zip Copy BinanceFutures.mqh header file to folder \MQL5\Include C
The Trade Tracker Library is used to automatically detect and display trade levels on custom charts. It is an especially useful add-on for EAs that trade on custom charts in MT5. With the use of this library, the EA users can see trades as they are placed via the EA (Entry, SL & TP levels) in real-time. The header file and two examples of EA skeleton files are attached in the comments section (first comment). The library will automatically detect the tradable symbol for the following custom
MT4/5通用交易库(  一份代码通用4和5 ) #ifdef __MQL5__      #define KOD_TICKET ulong      #define KOD_MAGIC   long #else        #define KOD_TICKET long      #define KOD_MAGIC   int #endif class ODLIST; #import "K Trade Lib Pro 5.ex5"       //祝有个美好开始,运行首行加入    void StartGood() ;    //简单开单    long OrderOpen( int type, double volume, int magic, string symbol= "" , string comment= "" , double opprice= 0 , double sl= 0 , double tp= 0 , int expiration= 0 , bool slsetmode= false , bool tpsetmode= false );    //复杂开单
If you're a trader looking to use Binance.com and Binance.us exchanges directly from your MetaTrader 5 terminal, you'll want to check out Binance Library MetaTrader 5. This powerful tool allows you to trade all asset classes on both exchanges, including Spot, USD-M   and COIN-M futures, and includes all the necessary functions for trading activity. With Binance Library MetaTrader 5, you can easily add instruments from Binance to the Symbols list of MetaTrader 5, as well as obtain information ab
1. What is this The MT5 system comes with very few optimization results. Sometimes we need to study more results. This library allows you to output more results during backtest optimization. It also supports printing more strategy results in a single backtest. 2. Product Features The results of the optimized output are quite numerous. CustomMax can be customized. The output is in the Common folder. It is automatically named according to the name of the EA, and the name of the same EA will be au
Matrix is the foundation of complex trading algorithms as it helps you perform complex calculations effortlessly and without the need for too much computation power, It's no doubt that matrix has made possible many of the calculations in modern computers as we all know that bits of information are stored in array forms in our computer memory RAM, Using some of the functions in this library I was able to create machine learning robots that could take on a large number of inputs To use this libra
T5L Library is necessary to use the EAs from TSU Investimentos, IAtrader and others. It contains all the functions framework needed to Expert Advisors working properly.  ツ - The Expert Advisors from  TSU Investimentos does not work without this library,  the T5L library can have updates during the year - At this Library you will find several funcionalities like order sends, buy and sell, trigger entry points check, candlestick analyses, supply and demmand marking and lines, and much more. 
AO Core
Andrey Dik
3 (2)
AO Core is the core of the optimization algorithm, it is a library built on the author's HMA (hybrid metaheuristic algorithm) algorithm. Pay attention to the MT5 Optimization Booster product , which makes it very easy to manage the regular MT5 optimizer . An example of using AO Core is described in the article: https://www.mql5.com/ru/articles/14183 https://www.mql5.com/en/blogs/post/756510 This hybrid algorithm is based on a genetic algorithm and contains the best qualities and properties of
EA Toolkit
Esteban Thevenon
EA Toolkit   is a library that allows any developer to quickly and easily program Advisor experts. It includes many functions and enumerations such as trailing stop, lot, stop loss management, market trading authorisations, price table updates, trading conditions and many more. Installation + Documentation : You will find all the information to install this library and the documentation of its functions on this GitHub : https://github.com/Venon282/Expert-Advisor-Toolkit WARNING : The installa
This is standard library built for flexible neural Networks with performance in mind. Calling this Library is so simple and takes few lines of code:    matrix Matrix = matrix_utils.ReadCsv( "Nasdaq analysis.csv" );       matrix x_train, x_test;    vector y_train, y_test;         matrix_utils.TrainTestSplitMatrices(Matrix,x_train,y_train,x_test,y_test, 0.7 , 42 );    reg_nets = new CRegressorNets(x_train,y_train,AF_RELU_,HL, NORM_MIN_MAX_SCALER); //INitializing network       reg_nets.RegressorN
このライブラリは、キーと値の配列をソートするために使用されます。多くの場合、値をソートする必要があります。 Python言語のように sorted(key_value.items(), key = lambda kv:(kv[ 1 ], kv[ 0 ])) インポート機能 利用シーン例 1. グリッド EA 注文は始値に従って並べ替えられます void SortedByOpenPride()   {    long     OrderTicketBuffer[];    double   OpenPriceBuffer[];    for ( int i = PositionsTotal ()- 1 ; i>= 0 ; i--)      {        if (m_position.SelectByIndex(i))         {          OrderTicketBuffer[i] = long (m_position.Ticket());          OpenPriceBuffer[i] = m_position.PriceOpen();  
Intro to Range Breakout Strategy (pre-close clearance) Range = yesterday high - Yesterday low On track = opening price + range *k; Lower rail = Open price - range *K Stop-loss closing position: When the price breaks up the upper track or breaks down the lower track, it breaks the opening price of the day again Parameters: Pairs List (comma separated)       = "GBPUSD,GBPJPY,USDJPY,XAUUSD,XTIUSD,USTEC"; - TimeFrame = PERIOD_D1; - MagicNumber      = 60037;          - OrderComment     = "RangeBre
Want to get all events like Previous/Forecast/Actual values for each news to analyze/predict it? By this simple library you can do it easily,Just import/integrate the library into your system,then get all possible values for each news   Even In Strategy Tester   . Note: Please add the address " https://www.forexfactory.com/ " of news feed at your MT5 tab > Tools > Options > Expert Advisors > Check Allow web request for listed URL. Since the WebRequest() function can't be called from indicator ba
A Simple Moving Average (SMA) is a statistical indicator used in time series analysis. This indicator represents the arithmetic mean of a sequence of values over a specific period of time. SMA is used to smooth short-term fluctuations in data, helping to highlight the overall trend or direction of changes. This aids analysts and traders in better understanding the general dynamics of the time series and identifying potential trends or changes in direction.  More information you can find in Wiki 
Hello everyone! I am a professional MQL programmer , Making EAs, Indicators and Trading Tools for my clients all over the world. I build 3-7 programs every week but I seldomly sell any ready-made Robots. Because I am fastidious and good strategy is so few...  this EA is the only one so far I think its good enough to be published here.  As we all know, the Ichimoku indicator has become world popular for decades, but still, only few people knows the right way of using it, and if we check the cl
金融とトレーディング戦略の領域を深く掘り下げ、私は一連の実験を実施し、強化学習に基づくアプローチと強化学習を使用しないアプローチを調査することにしました。 これらの手法を適用して、私は現代のトレーディングにおけるユニークな戦略の重要性を理解する上で極めて重要な微妙な結論を導き出すことができました。 ニューラル ネットワーク アドバイザーは、初期段階では目覚ましい効率性を示したにもかかわらず、長期的には非常に不安定であることが判明しました。 市場のボラティリティ、トレンドの変化、外部事象などのさまざまな要因により、企業の運営に混乱が生じ、最終的には不安定化につながりました。 この経験を武器に、私は課題を受け入れ、独自のアプローチを開発し始めました。 私の焦点は、集められた最良のインジケーターを異なるパラメーター設定で利用するアドバイザーを作成することに集中していました。 このアドバイザーは、私の独自の戦略に基づいており、さまざまなパラメーター設定を持つ 14 の指標を同時に採用し、何時間ものデータ分析と綿密なテストから生まれました。
Introducing "TG Risk Service Manager" — your comprehensive toolkit for swift and precise risk management and lot size calculations in the dynamic world of trading. Designed to streamline development processes and enhance trading strategies, this indispensable library equips developers with essential tools for optimizing risk assessment and trade profitability. Metatrader4 Version |  All Products  |  Contact   Key Features: Efficient Lot Size Calculation : Harness the power of precise lot size
作者のその他のプロダクト
The Smart Liquidity Profile is color-coded based on the importance of the traded activity at specific price levels, allowing traders to identify significant price levels such as support and resistance levels, supply and demand zones, liquidity gaps, consolidation zones, Buy-Side/Sell-Side Liquidity and so on.  Smart Liquidity Profile allows users to choose from a number of different time periods including 'Auto,' 'Fixed Range,' 'Swing High,' 'Swing Low,' 'Session,' 'Day,' 'Week,' 'Month,' 'Quart
The Smart Liquidity Profile is color-coded based on the importance of the traded activity at specific price levels, allowing traders to identify significant price levels such as support and resistance levels, supply and demand zones, liquidity gaps, consolidation zones, Buy-Side/Sell-Side Liquidity and so on.  Smart Liquidity Profile allows users to choose from a number of different time periods including 'Auto,' 'Fixed Range,' 'Swing High,' 'Swing Low,' 'Session,' 'Day,' 'Week,' 'Month,' 'Quar
Introducing the Volume Order Blocks indicator, a game-changing tool designed for traders who demand precision and clarity in their market analysis. This advanced indicator not only identifies order blocks but also integrates crucial volumetric data, allowing you to gauge the strength of these blocks with unparalleled accuracy. MT4 version -  https://www.mql5.com/en/market/product/121237/ Key Features of the Volume Order Blocks: Bullish & Bearish Order Blocks: Easily visualize and differentiat
This is the best Support and Resistance Indicator on the market, and it shows both confirmed Support and Resistance as well as Retests. Support & Resistance: Support marks where buying demand halts price declines, acting as a safety net. Resistance caps price surges, driven by selling pressure. Traders leverage these levels to predict reversals, plan entries, exits, and manage risks, making them trading's fundamental guideposts. You can also find Premium and Discount Levels, Strong High/Low,  
FREE
Price Retest MT5
Suvashish Halder
4.75 (4)
Introducing our exciting new Price Retest indicator! Get instant alerts when the price retests, giving you a powerful edge in your trading strategy. Remember to do your own analysis before making any moves in the market. MT4 Version -  https://www.mql5.com/en/market/product/118031 Here’s a detailed explanation of how the Price Retest indicator works, its components, and how you can incorporate it into your trading strategy: The Price Retest indicator is designed to notify traders when the price
FREE
Introducing Order Blocks Breaker , a brand-new way to identify and leverage order blocks in your trading strategy. After developing multiple order block tools with unique concepts, I’m proud to present this tool that takes things to the next level. Unlike previous tools, Order Blocks Breaker not only identifies order blocks but also highlights Breaker Order Blocks —key areas where the price is likely to retest after a breakout. MT5 -  https://www.mql5.com/en/market/product/124102/ This tool inco
Introducing the   Volume Order Blocks  indicator, a game-changing tool designed for traders who demand precision and clarity in their market analysis. This advanced indicator not only identifies order blocks but also integrates crucial volumetric data, allowing you to gauge the strength of these blocks with unparalleled accuracy. MT5 version -  https://www.mql5.com/en/market/product/121238/   Key Features of the Volume   Order Blocks: Bullish & Bearish Order Blocks:   Easily visualize and dif
The "Power of Three" (PO3) is a concept developed by the Inner Circle Trader (ICT) to illustrate a three-stage approach used by smart money in the markets:   Accumulation, Manipulation, and Distribution . ICT traders view this as a foundational pattern that can explain the formation of any candle on a price chart. In simple terms, this concept is effective for any time frame, as long as there's a defined start, highest point, lowest point, and end. MT4 -  https://www.mql5.com/en/market/product/1
FREE
Smart Liquidity Levels is a valuable tool for identifying optimal liquidity levels, enabling retail traders like us to strategically set our stop-loss orders. T he essential tool for traders seeking to maximize their trading success.  The liquidity level is a critical component of inner circle trading (ICT). It assists us in determining when and how we should enter the market. Watch the video for detailed instructions. Here's why understanding liquidity levels is crucial in trading and how our
Price Retest
Suvashish Halder
5 (3)
Introducing our exciting new Price Retest indicator! Get instant alerts when the price retests, giving you a powerful edge in your trading strategy. Remember to do your own analysis before making any moves in the market. MT5 Version -  https://www.mql5.com/en/market/product/118159/ Here’s a detailed explanation of how the Price Retest indicator works, its components, and how you can incorporate it into your trading strategy: The Price Retest indicator is designed to notify traders when the pric
FREE
Smart Fibo Zones   are powerful, auto-generated Fibonacci Retracements that are anchored to key   market structure shifts . These zones serve as critical   Supply and Demand   levels, guiding you to identify potential price reactions and confirm market direction.  Fibonacci  calculations, widely used by professional traders, can be complex when it comes to identifying highs and lows. However,  Smart Fibo Zones  simplify this process by automatically highlighting order blocks and key zones, compl
Consolidation Zone   Indicator is a powerful tool designed for traders to identify and capitalize on consolidation patterns in the market. This innovative indicator detects consolidation areas and provides timely alerts when the price breaks above or below these zones, enabling traders to make informed trading decisions. MT4 Version :  https://www.mql5.com/en/market/product/118734 Key Features: 1.   Consolidation Detection :    -   Precise Identification : The Consolidation Zone Indicator a
FREE
Candle Scanner Dashboard is an incredibly powerful tool in the financial markets. It excels at detecting market reversals, trend changes, and retracements. The dashboard displays patterns as they are identified, and with a simple click on each pattern, you can view them on their dedicated charts to precisely locate their occurrences. With its capability to detect 11 popular bullish and 11 bearish patterns, you can trust the dashboard to handle pattern identification effortlessly. It provides an

The   Area of Interest (AOI) Indicator   is a powerful tool designed to help traders identify key market zones where price reactions are highly probable. This indicator specifically highlights two critical zones: Seller AOI (Area of Interest) : This zone represents areas where sellers are likely to enter the market, often acting as resistance. When the price approaches or touches this zone, it signals that a potential sell-off could occur. Buyer  A OI (Area of Interest) : The BOI zone identifie
FREE
Smart Fibo Zones are powerful, auto-generated Fibonacci Retracements that are anchored to key market structure shifts . These zones serve as critical Supply and Demand levels, guiding you to identify potential price reactions and confirm market direction.  Fibonacci calculations, widely used by professional traders, can be complex when it comes to identifying highs and lows. However, Smart Fibo Zones simplify this process by automatically highlighting order blocks and key zones, complete with St
Introducing   Volume Orderflow Profile , a versatile tool designed to help traders visualize and understand the dynamics of buying and selling pressure within a specified lookback period. Perfect for those looking to gain deeper insights into volume-based market behavior! MT4 Version -  https://www.mql5.com/en/market/product/122656/ The indicator gathers data on high and low prices, along with buy and sell volumes, over a user-defined period. It calculates the maximum and minimum prices during t
SMT (Smart Money Technique) Divergence refers to the price divergence between correlated assets or their relationship to inversely correlated assets.  By analyzing SMT Divergence, traders can gain insights into the market's institutional structure and identify whether smart money is accumulating or distributing assets.  Every price fluctuation should be confirmed by market symmetry, and any price asymmetry indicates an SMT Divergence, suggesting a potential trend reversal. MT5 Version -  https:/
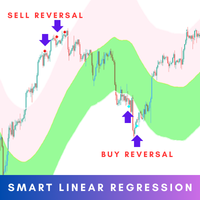
The   Smart Linear Regression   indicator is a powerful, non-repainting tool designed for traders looking for enhanced accuracy in market analysis. Unlike the typical linear regression channels that often repaint, this indicator provides reliable insights without changing past values, making it more trustworthy for forecasting future price movements. MT4 Version -  https://www.mql5.com/en/market/product/124893/ Overview: The   Smart Linear Regression   Indicator goes beyond the basic linear regr
The Area of Interest (AOI) Indicator is a powerful tool designed to help traders identify key market zones where price reactions are highly probable. This indicator specifically highlights two critical zones: Seller AOI (Area of Interest) : This zone represents areas where sellers are likely to enter the market, often acting as resistance. When the price approaches or touches this zone, it signals that a potential sell-off could occur. Buyer  A OI (Area of Interest) : The BOI zone identifies re
FREE
This is the best Support and Resistance Indicator on the market, and it shows both confirmed Support and Resistance as well as Retests. Support & Resistance: Support marks where buying demand halts price declines, acting as a safety net. Resistance caps price surges, driven by selling pressure. Traders leverage these levels to predict reversals, plan entries, exits, and manage risks, making them trading's fundamental guideposts. You can also find Premium and Discount Levels, Strong High/Low, Wea
FREE
Consolidation Zone Indicator is a powerful tool designed for traders to identify and capitalize on consolidation patterns in the market. This innovative indicator detects consolidation areas and provides timely alerts when the price breaks above or below these zones, enabling traders to make informed trading decisions. MT5 Version :  https://www.mql5.com/en/market/product/118748 Key Features: 1. Consolidation Detection :    - Precise Identification : The Consolidation Zone Indicator accurat
FREE
The Smart Divergence Dashboard is your ultimate tool for identifying high-probability trading opportunities. This cutting-edge indicator is meticulously designed to detect Regular Divergences, offering traders a clear and actionable advantage. MT5 Version -  https://www.mql5.com/en/market/product/120703/ Key Features: Real-time Divergence Detection: Instantly pinpoints Higher High/Lower Low and Oscillator Higher Low divergences across multiple currency pairs and timeframes using   Awesome Oscill
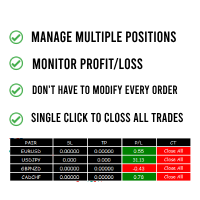
Tired of manually adjusting stop-loss and take-profit levels for multiple positions across different pairs? The Manage Multiple Positions Expert Advisor is your solution. MT4 Version -  https://www.mql5.com/en/market/product/120916/ This powerful tool streamlines your trading experience by allowing you to manage multiple positions on a single pair with ease. Modify stop-loss and take-profit levels for all open positions on a specific pair with a single click. Plus, the EA provides clear visibili
This is one of the most popular and highly rated   volatility index (VIX)   indicators on the market. It provides the same readings as the VIX does for stock indexes. However, this indicator works across all asset classes.  VIX Fix Finds Market Bottoms.  This indicator is not for inexperienced traders. Use it for day and swing trading. MT4 Version -  https://www.mql5.com/en/market/product/112238 Bernard Baruch summed it out best: "Markets fluctuate." The Chicago Board Options Exchange (CBOE) Vo
FREE
Order Block Tracker is here to solve one of the biggest challenges traders face: identifying order blocks. Many traders fail to spot these critical zones, often missing out on key market entries. But with Order Block Tracker , you no longer have to worry about that. This advanced indicator automatically highlights these crucial zones for you, giving you the confidence to enter the market at the right time. MT5 Version -  https://www.mql5.com/en/market/product/123362/ Key Features of Order Block
Volume Delta Candles offer a straightforward way to analyze trading activity within each candle, making it easier to see what's happening without needing an extra volume indicator. This tool uses lower timeframe or real-time data to show the percentage of buying and selling volume within a candle as a colored bar. Make sure you understand Volume and Volume Delta before jumping in. If you’re not sure, reach out to me first for a quick rundown. But if you're already familiar, you're good to go! Ke
Introducing   Order Blocks Breaker , a brand-new way to identify and leverage order blocks in your trading strategy. After developing multiple order block tools with unique concepts, I’m proud to present this tool that takes things to the next level. Unlike previous tools,   Order Blocks Breaker   not only identifies order blocks but also highlights   Breaker Order Blocks —key areas where the price is likely to retest after a breakout. MT4 -  https://www.mql5.com/en/market/product/124101/ This t
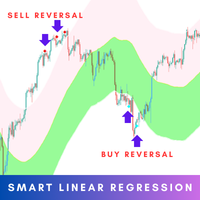
The Smart Linear Regression indicator is a powerful, non-repainting tool designed for traders looking for enhanced accuracy in market analysis. Unlike the typical linear regression channels that often repaint, this indicator provides reliable insights without changing past values, making it more trustworthy for forecasting future price movements. MT5 Version -  https://www.mql5.com/en/market/product/124894/ Overview: The Smart Linear Regression Indicator goes beyond the basic linear regression c
Dominant Candle Finder is a significant candlestick on a price chart that stands out due to its size, volume, or price movement compared to surrounding candles. It often indicates strong buying or selling pressure and can be used to identify potential reversal points, breakouts, or continuations in the market. Dominant candles can serve as key indicators for traders to make informed decisions, providing insights into market sentiment and potential future price movements. MT4 Version -  https://w
We mark the fair value gap (FVG) and wait for the price to reach that zone, but sometimes it reverses before getting there. This can happen because we didn't notice the Balanced Price Range (BPR). My tools will enhance your analysis by displaying everything on the chart, helping you identify potential price reversal areas so you can make informed decisions about when to enter the market. MT5 -  https://www.mql5.com/en/market/product/119228/ So, what is BPR or Balanced Price Range? A Balanced Pr
フィルタ:
レビューなし
レビューに返信