Separated Volume
- インディケータ
- Ivan Stefanov
- バージョン: 1.1
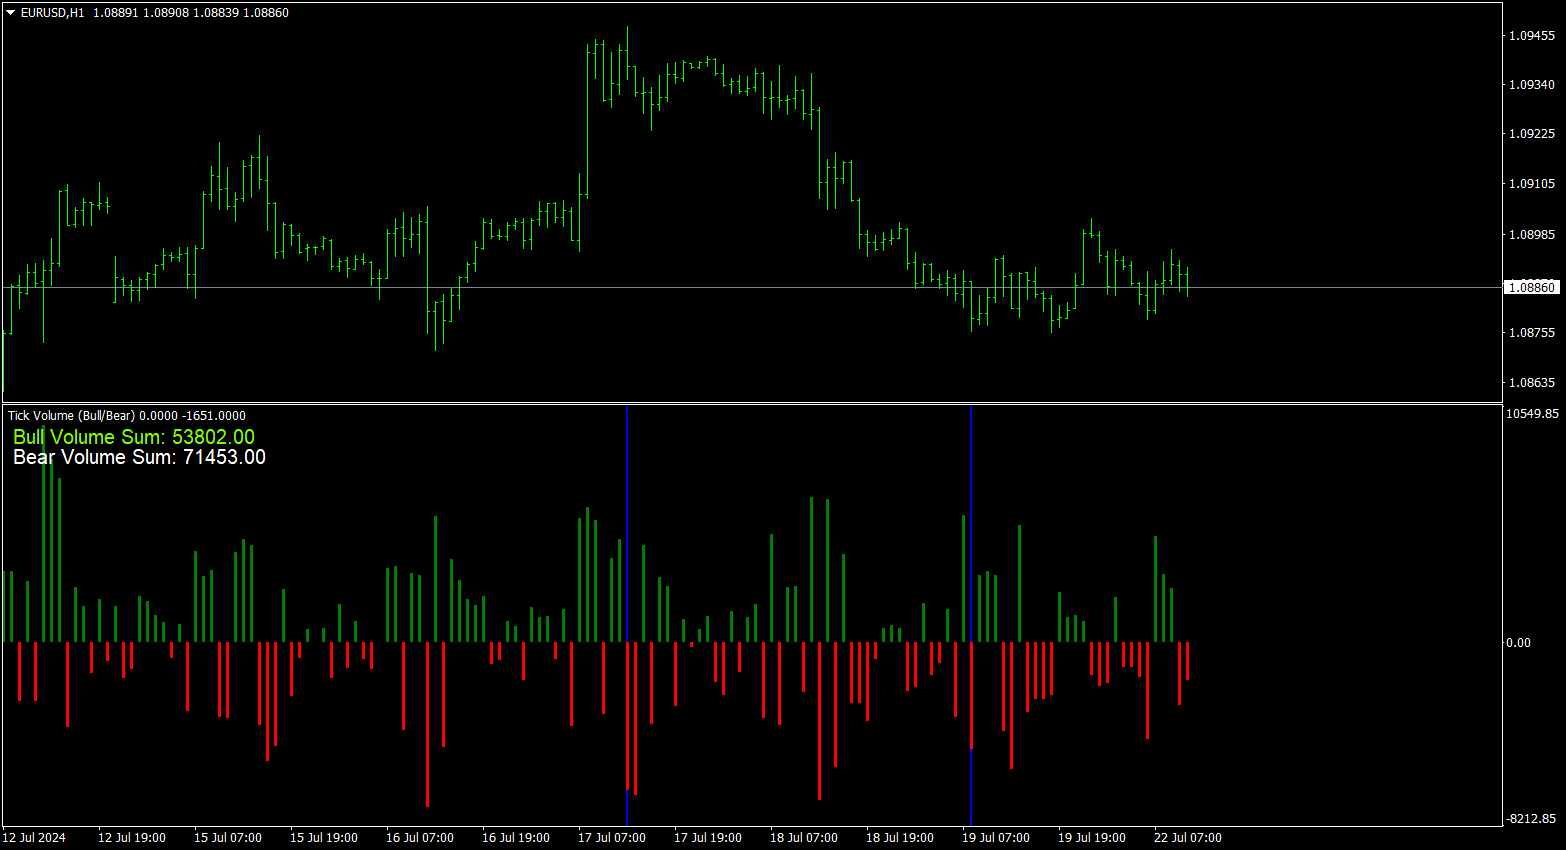
このインディケータは、外為市場のティックボリュームを強気と弱気に効果 的に分けます。
さらに、選択した任意の期間の強気と弱気のティックボリュームの合計を計算し、表示する機能を提供します。
チャート上の2本の青い線を動かすことで簡単に期間を調整でき、お客様の取引ニーズに合わせたカスタマイズ可能で正確な出来高分析が可能です。
もしお役に立つようでしたら、レビューをお寄せください!
それでは、良いお取引を!
このインディケータは、外為市場のティックボリュームを強気と弱気に効果 的に分けます。
さらに、選択した任意の期間の強気と弱気のティックボリュームの合計を計算し、表示する機能を提供します。
チャート上の2本の青い線を動かすことで簡単に期間を調整でき、お客様の取引ニーズに合わせたカスタマイズ可能で正確な出来高分析が可能です。
もしお役に立つようでしたら、レビューをお寄せください!
それでは、良いお取引を!