• 概要
  • レビュー
  • コメント
  • 最新情報

Advance Currency Meter

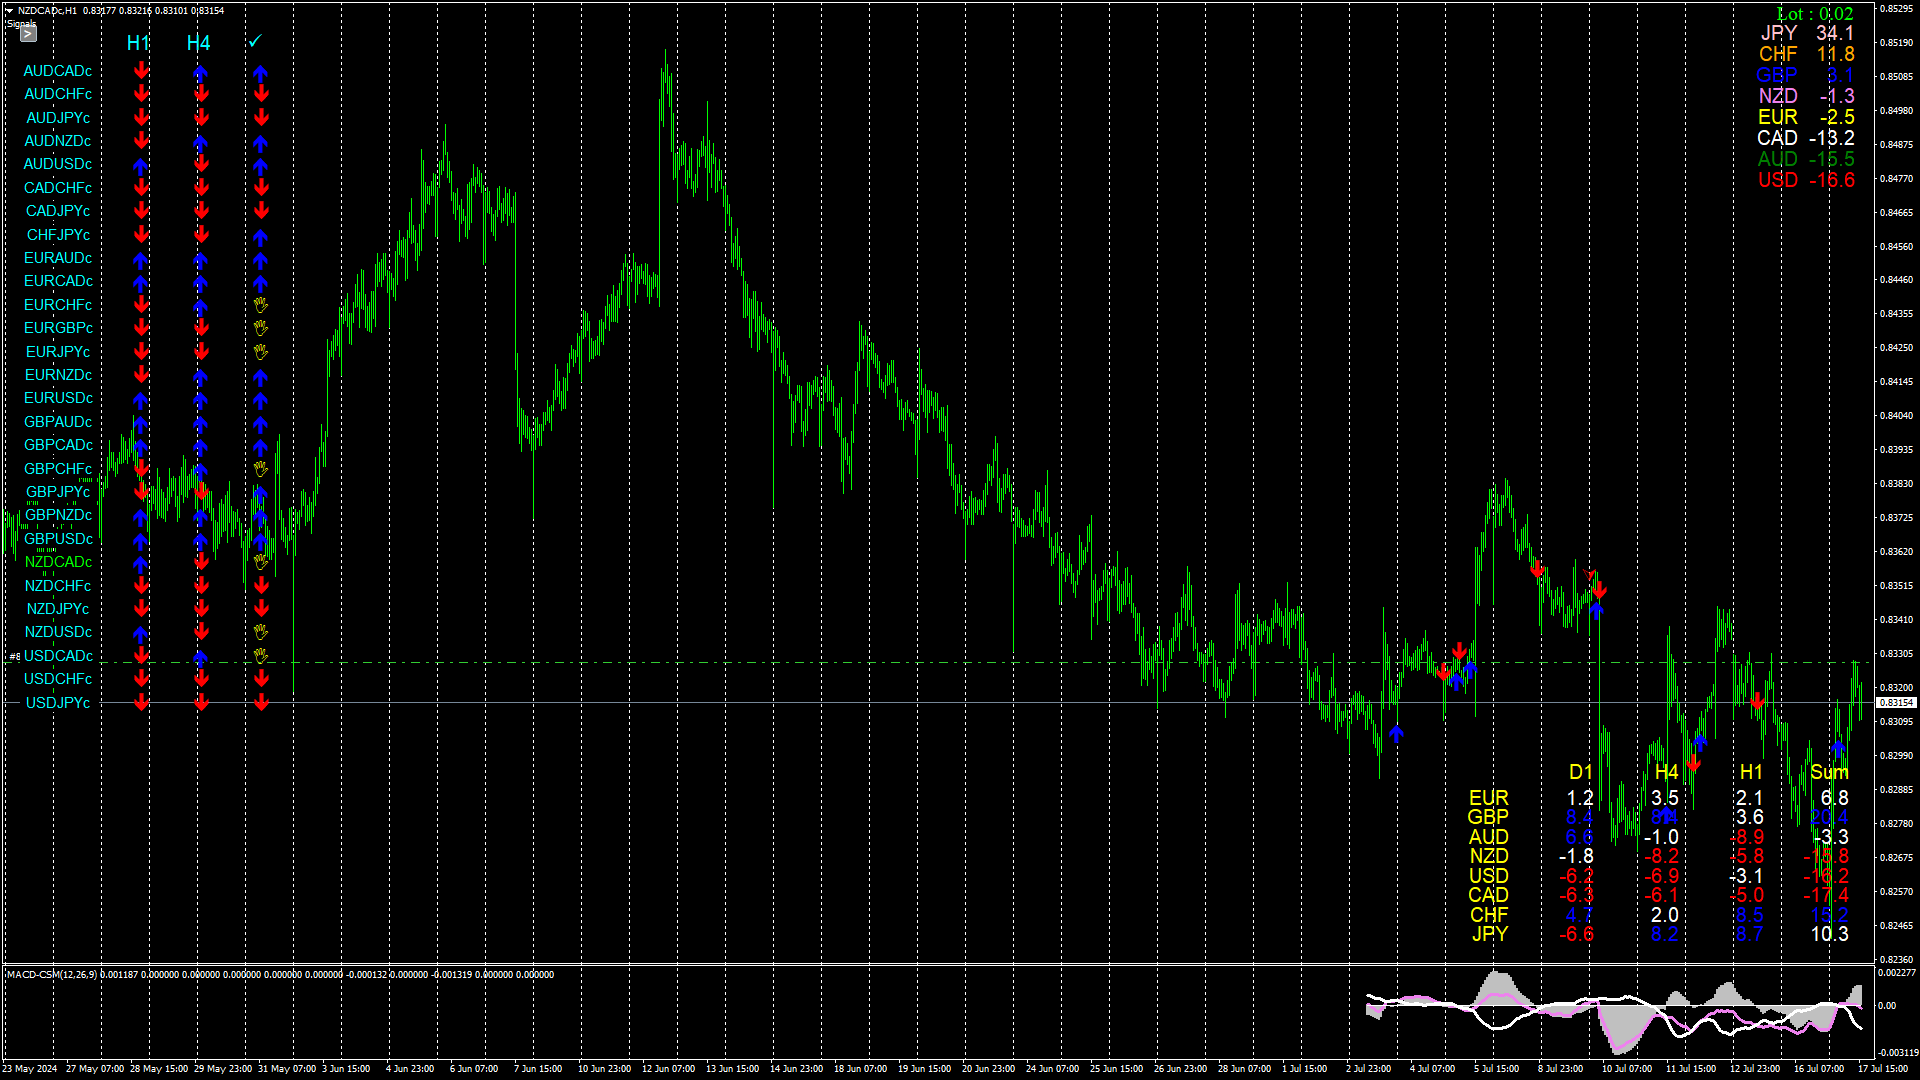
Advance Currency Meter is a currency meter that detects strong market trends.

This indicator is good for scalping, intraday trading and swing trading. The indicator will detect short term to long term market trends.

This will give you good insight which currencies are best to trade as of the moment.


Note : Kindly contact me before you make any purchases. Works well with my MACD Currency Strength Meter

おすすめのプロダクト
VR Cub
Vladimir Pastushak
VR Cub は、質の高いエントリーポイントを獲得するためのインジケーターです。このインジケーターは、数学的計算を容易にし、ポジションへのエントリーポイントの検索を簡素化するために開発されました。このインジケーターが作成されたトレーディング戦略は、長年にわたってその有効性が証明されてきました。取引戦略のシンプルさはその大きな利点であり、初心者のトレーダーでもうまく取引することができます。 VR Cub はポジション開始ポイントとテイクプロフィットとストップロスのターゲットレベルを計算し、効率と使いやすさを大幅に向上させます。取引の簡単なルールを理解するには、以下の戦略を使用した取引のスクリーンショットを見てください。 設定、設定ファイル、デモ版、説明書、問題解決方法は、以下から入手できます。 [ブログ] レビューを読んだり書いたりすることができます。 [リンク] のバージョン [MetaTrader 5] エントリーポイントの計算ルール ポジションをオープンする エントリーポイントを計算するには、VR Cub ツールを最後の高値から最後の安値までストレッチする必要があります。
Noize Absorption Index - is the manual trading system that measures the difference of pressure between bears forces and bulls forces. Green line - is a noize free index that showing curent situation. Zero value of index shows totally choppy/flat market.Values above zero level shows how powerfull bullish wave is and values below zero measures bearish forces.Up arrow appears on bearish market when it's ready to reverse, dn arrow appears on weak bullish market, as a result of reverse expectation. S
Forex Gump
Andrey Kozak
2.83 (6)
Forex Gump is a fully finished semi-automatic trading system. In the form of arrows, signals are displayed on the screen for opening and closing deals. All you need is to follow the instructions of the indicator. When the indicator shows a blue arrow, you need to open a buy order. When the indicator shows a red arrow, you need to open a sell order. Close orders when the indicator draws a yellow cross. In order to get the most effective result, we recommend using the timeframes H1, H4, D1. There
これは、キャンドルの終値を予測する指標です。 このインジケータは、主にD1チャートでの使用を目的としていますが. この指標は、従来の外国為替取引とバイナリオプション取引の両方に適しています。 インジケーターは、スタンドアロンのトレーディングシステムとして使用することも、既存のトレーディングシステムへの追加として機能させることもできます。 このインジケーターは、現在のキャンドルを分析し、キャンドル自体の内部の特定の強度係数と、前のキャンドルのパラメーターを計算します。 したがって、この指標は、市場の動きのさらなる方向性と現在のキャンドルの終値を予測します。 この方法のおかげで、この指標は、短期の日中取引だけでなく、中期および長期の取引にも適しています。 インジケーターを使用すると、市場の状況の分析中にインジケーターが生成する潜在的な信号の数を設定できます。 インジケーターの設定には、このための特別なパラメーターがあります。 また、インジケーターは、チャート上のメッセージの形式で、電子メールで、およびPUSH通知の形式で、新しい信号について通知することができます。 購入後は必ず私に書いて
Monster Harmonics Indicator is a harmonic pattern indicator. It recognizes Gartley, Bat, Crab, Butterfly, Cypher, White Swan, Black Swan, Shark and several other patterns. Projected patterns that are not yet completed are recognized, too. Monster even shows the PRZ (Potential Reversal Zone). Users can add their own user defined patterns to Monster. Besides the current pattern, Monster also shows all patterns in the symbols history. Monster will provide alerts for developing patterns. Introduced
Owl smart levels
Sergey Ermolov
4.58 (55)
MT5版  |   FAQ Owl Smart Levels Indicator   は、 Bill Williams   の高度なフラクタル、市場の正しい波構造を構築する Valable ZigZag、エントリの正確なレベルをマークする Fibonacci レベルなどの一般的な市場分析ツールを含む 1 つのインジケーター内の完全な取引システムです。 利益を得るために市場と場所に。 戦略の詳細な説明 インジケータを操作するための指示 顧問-取引助手 プライベートユーザーチャット ->購入後に私に書いて、私はプライベートチャットにあなたを追加し、あなたはそこにすべてのボーナスをダウンロードすることができます 力はシンプルさにあります! Owl Smart Levels   取引システムは非常に使いやすいので、専門家にも、市場を勉強し始めて自分で取引戦略を選択し始めたばかりの人にも適しています。 戦略と指標に秘密の数式や計算方法が隠されているわけではなく、すべての戦略指標は公開されています。 Owl Smart Levels を使用すると、取引を開始するためのシグナルをすばやく確認し、
Reversal Pattern Pro
Boonyapagorn Rodvattanajinda
Reversal Patterns Pro Reversal Patterns Pro is a Price Action (PA) analytical tool that scans the reversal patterns.  - Finds and marks the most dependable Japanese candlestick patterns in real-time. - Supports all time frames (Best for Scalping) - Doesn't repaint making it an exceptional indicator for Expert Advisors. Input parameters : - Support & Resistance Mode ( true or false ) for enabling advanced filtering - Donchian Period - RSI Period - RSI Oversold Level - RSI Overbought Level - 
トレンドトレーディング は、タイミングのプルバックとブレイクアウトにより、市場で起こっているトレンドから可能な限り利益を得るように設計された指標です。確立されたトレンドの中で価格が何をしているかを分析することにより、取引の機会を見つけます。 [ インストールガイド | 更新ガイド | トラブルシューティング | よくある質問 | すべての製品 ] 自信を持って効率的に金融市場を取引する むち打ちにならずに確立されたトレンドから利益を得る 収益性の高いプルバック、ブレイクアウト、早期の逆転を認識する この指標は、独自の品質とパフォーマンスを分析します 複数時間枠のダッシュボードを実装します インジケーターは再描画されていません 電子メール/音声/視覚アラートを実装します 確立されたトレンドは多くの取引機会を提供しますが、ほとんどのトレンド指標はそれらを完全に無視しています。インジケーターの解釈はかなり簡単です: (1) トレンドの変化 (2) トレンドの方向への後退 (3) トレンドの方向へのブレイクアウト 赤いダッシュ は下降トレンド中の修正です 青いダッシュ は上昇ト
This is a new strategy for SUPPLY DEMAND areas It is based on a calculation using the tick volume to detect the big price action in market for both bear /bull actions this smart volume action candles are used to determine the supply and demand areas prices in between main supply and demand lines indicate sideway market  up arrows will be shown when prices moves above the main supply and the secondary supply lines Down arrows will be shown when prices moves below the main demand and the secondary
Trade with Gann on your side!! MASTER CIRCLE 360 CIRCLE CHART, originally created by Gann admitted that this is “The Mother of all charts”. It is one of the last studies that this great trader left for us. The numeric tab le is apparently quite simple like all the tables and is based on square numbers, the SQUARE OF 12 and is by evolution, one of the most important square numbers. Here we can find CYCLE, PRICE AND TIME thanks to angles and grades, to show past and future support and resistance.
インディケータは現在のクオートを作成し、これを過去のものと比較して、これに基づいて価格変動予測を行います。インジケータには、目的の日付にすばやく移動するためのテキスト フィールドがあります。 オプション: シンボル - インジケーターが表示するシンボルの選択; SymbolPeriod - 指標がデータを取る期間の選択; IndicatorColor - インジケータの色; HorisontalShift - 指定されたバー数だけインディケータによって描画されたクオートのシフト; Inverse - true は引用符を逆にします。false - 元のビュー。 ChartVerticalShiftStep - チャートを垂直方向にシフトします (キーボードの上下矢印)。 次は日付を入力できるテキストフィールドの設定で、「Enter」を押すとすぐにジャンプできます。
5 signal in 1  Product     TimeFrame   Recommend   1m-5m recommend  signal   TF  5m    Banks Pro Binary Option is Indicator for binary option Can Use Manaul Trade or Robot on Platform  Mt2Trading  https://www.mt2trading.com/?ref=104    Time Trading   good work  EU session    Recommend  Curency   EUR  GBP USD        careful   AUD JPY      Recommend  Martingale 2-5 Step   Recommend  set profit  2%-5%/Day Setting Brake  News Event High volatility   recommend  15-30 min Have Problem Contract
This is a trend indicator without redrawing Developed instead of the binary options strategy (by the color of the Martingale candlestick) Also works well in forex trading When to open trades (binary options) A signal will appear in the place with a candle signaling the current candle It is recommended to open a deal for one candle of the current timeframe M1 and M5 When a blue dot appears, open a deal up When a red dot appears, open a trade down. How to open trades on Forex. When a signal is rec
The Th3Eng PipFinite indicator is based on a very excellent analysis of the right trend direction with perfect custom algorithms. It show the true direction and the best point to start trading. With StopLoss point and Three Take Profit points. Also it show the right pivot of the price and small points to order to replace the dynamic support and resistance channel, Which surrounds the price. And Finally it draws a very helpful Box on the left side on the chart includes (take profits and Stop loss
トレンドキャッチャー: アラートインジケーター付きのトレンドキャッチャーストラテジーは、市場トレンドやポテンシャルなエントリーポイントやエグジットポイントを特定するのに役立つ多目的な技術分析ツールです。動的なトレンドキャッチャーストラテジーを備えており、市場状況に適応してトレンドの方向を明確に視覚化します。トレーダーは、自身の好みやリスク許容度に合わせてパラメーターをカスタマイズできます。このインジケーターはトレンドの識別を支援し、ポテンシャルなリバーサルをシグナルし、トレイリングストップのメカニズムとして機能し、市場への迅速な対応のためのリアルタイムアラートを提供します。 特徴: - トレンドの識別:上昇トレンドと下降トレンドをシグナルします。 - トレンドのリバーサル:ローソク足の色が上昇から下降に変わった場合やその逆の場合に、ポテンシャルなリバーサルを警告します。 - リアルタイムアラート:新しいトレンドの識別に対するアラートを生成します。 推奨事項: - 通貨ペア:EURUSD、AUDUSD、XAUUSDなど... - タイムフレーム:H1。 - アカウン
FREE
PipFinite Exit EDGE
Karlo Wilson Vendiola
4.88 (161)
Did You Have A Profitable Trade But Suddenly Reversed? In a solid strategy, exiting a trade is equally important as entering. Exit EDGE helps maximize your current trade profit and avoid turning winning trades to losers. Never Miss An Exit Signal Again Monitor all pairs and timeframes in just 1 chart www.mql5.com/en/blogs/post/726558 How To Trade You can close your open trades as soon as you receive a signal Close your Buy orders if you receive an Exit Buy Signal. Close your Sell orde
"The trend is your friend" is one of the best known sayings in investing, because capturing large trendy price movements can be extremely profitable. However, trading with the trend is often easier said than done, because many indicators are based on price reversals not trends. These aren't very effective at identifying trendy periods, or predicting whether trends will continue. We developed the Trendiness Index to help address this problem by indicating the strength and direction of price trend
The RTrends indicator does two things: first, it automatically draws the layout of the price chart by plotting trend lines and, secondly, it produces bearish and bullish signals. The layout reflects the fractal nature of the market. Trends from different time horizons are applied simultaneously on the chart. Thus, from a single chart a trader can see trend lines of higher timeframes. The lines, depending on the horizon, differ in color and width: the older the horizon, the thicker the line is. T
Introducing the "Magic Trades" for MetaTrader 4 – your ultimate tool for precision trading in dynamic markets. This innovative indicator revolutionizes the way you perceive market trends by harnessing the power of advanced analysis to detect subtle changes in character, paving the way for optimal trading opportunities. The Magic Trades Indicator is designed to empower traders with insightful entry points and well-defined risk management levels. Through its sophisticated algorithm, this indica
フィボナッチリトレースと拡張ラインツール DiNapoliポイント取引方法とゴールデンセクション取引を使用するトレーダーにとって理想的なMT4プラットフォームのフィボナッチリトレースと拡張ラインツール 主な特長: あなたはフィボナッチリトレースメントの複数のセットを直接描くことができ、重要なリターンポイント間の関係は一目瞭然です。 2.フィボナッチ拡張を描画することができます。 3.フィボナッチフォールドバックとラインの延長は、簡単な観察と数値表示のために左右に動かすことができます。 4.チャートは非常に爽やかな 5.数字キーでサイクルを切り替えることができます。 ファンクションキー: 1。 [戻るを押す、要求に応じて描画する、最大8つのグループにする 2。拡張]を描くには[押す] 3。 \を押すと、現在のサイクルの下にあるすべての拡張機能と折り畳みが削除されます 4。フォールドバックを移動して削除して展開する (1)最初のフォールドバックセットのF5行をクリックします。 一度クリックすると(黄色に変わります)、キーボードのDel
Was: $249  Now: $99   Market Profile defines a number of day types that can help the trader to determine market behaviour. A key feature is the Value Area, representing the range of price action where 70% of trading took place. Understanding the Value Area can give traders valuable insight into market direction and establish the higher odds trade. It is an excellent addition to any system you may be using. Blahtech Limited presents their Market Profile indicator for the MetaTrader community. Ins
Gyroscope        professional forex expert   (for EURUSD, GBPUSD, USDJPY, AUDUSD, USDCHF, EURGBP, EURJPY, NZDUSD, USDCAD, EURCHF, AUDJPY, CADJPY pairs)   alyzing the market using the Elliot Wave Index. Elliott wave theory is the interpretation of processes in financial markets through a system of visual models (waves) on price charts. The author of the theory, Ralph Elliott, identified eight variants of alternating waves (of which five are in the trend and three are against the trend). The mo
This is an arrow indicator without a future function,developed based on the most advanced profit trading algorithms.It has the most innovative and advanced dual trend analysis module, as well as the latest and highly effective market trend prediction algorithm.Trends are your friends, and following larger trends can earn the maximum profit in foreign exchange. This indicator helps traders identify current trends and track them. Someone once made a profit of 10 times in a week by relying on it.No
Advanced version of CyberZingFx Volume Plus, the ultimate MT4 indicator for traders seeking highly accurate buy and sell signals. With an additional strategy and price action dot signals that enhances its effectiveness, this indicator offers a superior trading experience for professionals and beginners alike. The CyberZingFx Volume Plus Advanced version combines the power of volume analysis and historical price data with an additional strategy, resulting in even more precise and reliable signals
The main idea of this indicator is rates analysis and prediction by Fourier transform. Indicator decomposes exchange rates into main harmonics and calculates their product in future. You may use the indicator as a standalone product, but for better prediction accuracy there is another related indicator - FreqoMaster - which uses FreqoMeterForecast as a backend engine and combines several instances of FreqoMeterForecast for different frequency bands. Parameters: iPeriod - number of bars in the ma
まず第一に、この取引ツールはノンリペイント、ノンリドロー、ノンラグの指標であり、プロの取引に理想的ですことを強調する価値があります。 オンラインコース、ユーザーマニュアル、デモ。 スマートプライスアクションコンセプトインジケーターは、新米から経験豊富なトレーダーまで、非常 に強力なツールです。Inner Circle Trader AnalysisやSmart Money Concepts Trading Strategiesなど、20以上の有用な指標を1つに組み合わせています。このインジケーターはスマートマネーコンセプトに焦点を当て、大手機関の取引方法を提供し、彼らの動きを予測するのに役立ちます。 特に、流動性分析に優れており、機関がどのように取引しているかを理解しやすくしています。市場のトレンドを予測し、価格の動きを慎重に分析するのに優れています。機関の戦略とトレードを合わせることで、市場の動向についてより正確な予測ができます。このインジケーターは多目的であり、市場構造を分析し、重要な注文ブロックを特定し、さまざまなパターンを認識するのに優れています。 このインジケー
This unique multi-currency strategy simultaneously determines the strength of trends and market entry points, visualizing this using histograms on the chart. The indicator is optimally adapted for trading on the timeframes М5, М15, М30, Н1. For the convenience of users, the indicator renders the entry point (in the form of an arrow), recommended take profit levels (TP1, TP2 with text labels) and the recommended Stop Loss level. The take profit levels (TP1, TP2) are automatically calculated for
The Chaikin Oscillator is a technical indicator developed by Marc Chaikin that combines price and volume data to measure the accumulation and distribution of a financial instrument. It aims to identify potential buying and selling opportunities in the market. The Chaikin Oscillator is calculated by subtracting a 10-day exponential moving average of the Accumulation Distribution Line (ADL) from a 3-day exponential moving average of the ADL. Here's how to use the Chaikin Oscillator indicator in tr
Requirements Optimized to work with   EURUSD-EURCHF-USDJPY, AUDUSD-CADJPY-AUDNZD, CHFJPY-NZDJPY-NZDUSD For timeframe 4H. *(Minimum recommended deposit is $300 for each Pair) for initial lot set to 0.10, My favorite Pair are (CHFJPY-NZDJPY-EURUSD-AUDNZD-USDJPY) Warning it will be SALE only 5 Copys at 60$ Then it will be update up to 200$  You can use it the way it is, For new Set Files will be add on (Comments) ECN broker with low spread is recommended to get better results. Setup is
このプロダクトを購入した人は以下も購入しています
TRANSACTION SPEEDは、大口注文がいつどこで市場に集積され、その恩恵を受けているかを示す最高品質の指標です。トレンドの変化を非常に早い段階で検知します。インジケーターであると同時にトレーディングシステムでもあります。そのコンセプトはユニークで、驚くほど収益性が高い。 FXでは、ティックボリュームはボリュームと呼ばれ、誤解を招きやすい。実際は、単位時間当たりの価格変動であり、事実上、取引速度(TRANSACTION SPEED)です。 このインジケーターは、FXにおける出来高の概念を完全に見直し、正しい方法で論理的に定義し、このロジックを適用することで、ユニークで正確なトップレベルの収益ツールになります。 スピードが上がれば、それはより大きな関心とそれに対応するエントリーとエグジットのサインです。 使い方は? このインジケーターは、市場の取引スピードを測定・比較するため、まず最初に行うべきことは以下の通りです。 比較を行う期間を選択することです。 通常、15日前が比較の出発点となります。 インジケータに日付を入力して実行する。 30分または1時間のタイムフレー
WARNING: PRICE IS SUBJECT TO RISE AT ANY TIME. GET YOUR COPY TODAY TO AVOID MORE COST! Dear Traders I am so glad to introduce to you my other tool called the Forex Sniper Entries Indicator. This tool is designed to help serious traders and investors capture big moves in the currency price movements. The philosophy behind this tool is all about winning big and riding the price movement from its beginning until the maximum point. We want to capture those big moves in both down and up markets as mu
IA Trendx3 PRO
Marco Aurelio Santos Costa
What if God Created a Trade System? No miracles... Just see how mathematics can be effective in the market. We managed to combine technical analysis / price action into indicators, creating the best setup for trading, be it in Forex, Indices, or stocks. It took us 2 years to create something that really works, and now it's time for you to discover it. TrendX3 is a revolution in trend analysis. Based on advanced algorithms and real-time data, it provides valuable insights so that you can make inf
WARNING!! THIS SWORD IS TOO SHARP!    ONLY 10 COPIES LEFT FOR THE NEXT PRICE TO BE 8,000$ FOR UNLIMITED PLAN. Dear traders I am very glad once again to introduce to you my other tool called "Forex Sword Indicator". In short this tool is meant to give you an edge over the market that you have been waiting for  so long. Now, here it is. It is a very very simple tool but yet a dangerous sword. I call it a  Holy grail indicator!. I will not talk a lot about this tool. Just let the tool speak by itse
Automatic, live & interactive picture of all trendlines. Assign push, email and sound alerts to the lines of your choice and be informed about price rollback, breakout, rollback after breakout, number of rollbacks, line expiration by double breakout. Correct, drag or delete the lines and interactively tune the line system. https://youtu.be/EJUo9pYiHFA . Chart examples https: //www.mql5.com/en/users/efficientforex Price Interaction Events All events are effective immediately and only after on
サポート と 抵抗レベルインジケーター( Support and resistance )をダウンロードできます。 インジケーターは、水平とトレンドのサポートと抵抗レベルを 表示します 。 インジケーター設定: トレンド( Trends ) トレンド又は水平のサポートと抵抗レベルの表示モード設定 はい( Yes )-トレンドレベルしか表示しない いいえ( No )- 水平 レベルしか表示しない リソース使用( UseResource ) インジケーターに組み込まれているリソースの使用モード設定。 はい( Yes )-商品リソースからのジグザグ( ZigZag )インジケーターを使用すること。 いいえ( No )-ジグザグ( ZigZag )ユーザーインジケーターを使用すること。 履歴バー( HistoryBar ) レベルが表示される履歴バーの数 バー数( CountBar ) 現在のバーを始め、サポートと 抵抗レベル が検索されるバーの数 商品で使用されている ジグザグ ( ZigZag ) インジケーターの設定 : デプス( Depth ) 前の値 より 偏差( Deviatio
The [GRAFF] III manual trading system is based on multiple MetaTrader (MT4) indicators. Together, the entire PACK of GRAFF III indicators makes an advanced trading tool. The system consists of over 20 different custom-built indicators which have been carefully selected and tested in the long term to produce strong and efficient trading signals. The particular indicators are based on different mathematical formulas, so the entire system is calibrated to remove false signals from its own indicator
You can fins our other products from link : https://www.mql5.com/en/users/drbastem/seller   Also, you can ask all your questins from email : haskayafx@gmail.com or mobile : +90 530 867 5076 or @MehmetBastem    on telegram application This indicator is used to determine the trend. Standard Three Moving Average and ADX indicators are used. It has the indicator warning system (audio, e-mail) and three types of alerts, including messages to mobile phone. It shows the best performance on M5. When
This indicator is used to determine the trend. Standard Three Moving Average and ADX indicators are used. It has the indicator warning system (audio, e-mail) and three types of alerts, including messages to mobile phone. It shows the best performance on M5. When the trend value reaches the value set, the warning system is activated. This indicator works only with Forex symbols. Inputs SoundAlarm = true - Sound Alert Sendmail=true - Send an e-mail in case of a buy or sell signal Sendnotificatio
You can fins our other products from link : https://www.mql5.com/en/users/drbastem/seller   Also, you can ask all your questins from email : haskayafx@gmail.com or mobile : +90 530 867 5076 or @MehmetBastem    on telegram application This indicator is used to determine the trend. Standard MACD indicator is used. It has the indicator warning system: beep, e-mail and has three types of alerts, including messages to mobile phone. It shows the best performance on the chart of 5 minutes. When the
Primus Trading Engine is a trading system that combines price action,ratio based indicators & custom indicators to create this leading indicator with a multi-timeframe approach to give you high probability trade setups for forex,CFD cash/futures,metals & binary option to assist in making predictions on what is MOST likely to happen in the market Main Chart Features Price Action Signal-Arrow displayed on a specific bar;NOT buy/sell arrow;DOES NOT repaint;Bullish arrow on a bullish bar,price is l
The arrows are calculated with: -     2 Parabolic  parameters -     2 ADX parameters -     4 Stochastic parameters We recommend to combine it with Parabolic, ZigZag or Elliot waves indicator. Always trade the trend! If you make sure to draw your trend lines and support/resistance zones you will just have to wait for the signal to appear. Take the trade. For Binary Options it is advisable to set the expiry time to 5-15 min in M1 chart. THIS INDICATOR IS ZERO REPAINT Best assets to trade: -
Let´s try to make some real money! Call me profit addicted. I thought why not try to make THE dream come reality. With discipline, a clear strategy and this indicator I focus on entering the perfect trades. This indicator is very easy to use as you will get perfect entry points for Put or Call trades. The arrows are calculated with: -     Momentum  parameters -     Candle stick patterns -     Fundamental Price action We recommend to combine it with Parabolic, ZigZag or Elliot waves indic
Golden Chip provides Basic Market Structure, Fibonacci, supply and Demand Zones. Letting you identify when a sell off point is approaching or whne a buy opportunity is arriving. The awesome thing about Golden Chip is that, you will see rejection levels or continuation before ANYBODY ! This indicator moves directly with price and lines up perfectly with the Chart. Some indicators would lag but NOT this one ! Golden Chip is amazing for Clean chart (Naked Chart). GOLDEN CHIP IS ONLY ON METATRADER (
mql5を通じて私との連絡を購入したらお願いします。そのため、ダッシュボードがプラットフォームで正しく機能することを確認できます。 ネストされた外国為替ゾーンは、バウンスとブレイクアウトエリアを見つけるために1つのチャートですべてのキーレベルをフェッチするように設計されています。 想像できるすべてのものが複数の時間枠から1つのダッシュボードにフェッチされ、ネストされた合流点を見つけて需要と供給の領域を供給します。 ダッシュボードが高得点を示している場合、その領域から反応を得る可能性が高いサポートと抵抗および価格の明確な識別。明確な理解のために他の例を確認するか、私にメッセージを送ってください それは何を計算しますか:     サポート抵抗     需要と供給     概数     フラクタル     ボリンジャー     偏差ゾーン     買われ過ぎと売られ過ぎのエリア     勢いの指標     方向指示器     移動平均     RSI     STOCH     日平均     週平均     月平均     ダブルトップス
You can fins our other products from link : https://www.mql5.com/en/users/drbastem/seller   Also, you can ask all your questins from email : haskayafx@gmail.com or mobile : +90 530 867 5076 or @MehmetBastem    on telegram application This system created by using Corrected MACD, Different time zone support and resistant points,  Parabolic Sars, Bollinger band, 4 moving average, stochastic oscillator and ADX. In this system, Using parabolic Sars reverse bar count,  Pips difference between clo
This indicator prepared by using 57 days moving averagr and least square method. It can only work for 1 hr time interval. Once a signal created. It is creating order and 2 limit orders. It works in CFD pairs as well as in Forex pairs. You can fins our other products from link : https://www.mql5.com/en/users/drbastem/seller Also, you can ask all your questins from email : haskayafx@gmail.com or mobile : +90 530 867 5076 or @MehmetBastem on telegram application This system is for Long term and pr
This system created by using Corrected MACD,ADX, Different time zone support and resistant points,  Parabolic Sars, Bollinger band, 9 moving average, stochastic oscillator and ADX. In this system, Using parabolic Sars reverse bar count,  Pips difference between closing price and last parabolic Sars in the direction of signal and Trend strength.   Note that this system is not martingale, this system is creating limit order.    Best result for the orders are 25 Pips in USD, 50 Pips in GBP. Best
This system created by using Corrected MACD,ADX, Different time zone support and resistant points,  tree Parabolic Sars,two Bollinger band, 3 moving average, stochastic oscillator and ADX. In this system, Using parabolic Sars reverse bar count,  Pips difference between closing price and last parabolic Sars in the direction of signal and Trend strength.   Note that this system is not martingale, this system is creating limit order.    Best result for the orders are 45 Pips in USD, 75 Pip
This system created by using  Stochastic oscillator and moving average.  Entrance value and take profit values can be seen by system.  This is system for Long term and profitable. this system can be used for 15 minutes time frame. This system is not  repaints.         This system is for Long term and profitable.  Signals are shown as arrows. as an optional,  you can set a voice alarm or email notification  You can fins our other products from link : https://www.mql5.com/en/users/drbastem/seller
This indicator prepared by using 311,1298 days moving average and Calculates the Envelopes.    This system can be used for 5M time frame.     This system is for Long term and profitable.    Signals are shown as arrows. as an optional,    you can set a voice alarm or email notification    You can fins our other products from link : https://www.mql5.com/en/users/drbastem/seller    Also, you can ask all your questins from email : haskayafx@gmail.com or mobile : +90 530 867 5076 or @MehmetBastem   
This indicator prepared by using 311,1298 days Haskaya Trend Bandse and Calculates the strand ADX.    This system can be used for 5M time frame.     This system is for Long term and profitable.    Signals are shown as arrows. as an optional,    you can set a voice alarm or email notification    You can fins our other products from link : https://www.mql5.com/en/users/drbastem/seller    Also, you can ask all your questins from email : haskayafx@gmail.com or mobile : +90 530 867 5076 or @Meh
This indicator is created by considering volume divergence with price that is outcome of Bollinger band and Envolpes indicators crossing. It won’t repaint.  It is providing 1 market and three pending orders.  If it is followed with patient, it is providing remarkable profit at the end.  This indicator will be on sale soon on expert advisor. Target is calculated for buy orders as follow 1. 50 pips standard 2. Top Bollinger band 3. Sell Signal Target is calculated for buy orders as follow 1. 50
https://youtu.be/t3SLLgcEEPM This indicator prepared by  using Moving Averages, Bollingers Bands .    This system can be used for 5M time frame and Gold Symbols (XAUUSD).     This system is for Long term and profitable.    Signals are shown as arrows. as an optional,    you can set a voice alarm or email notification    You can fins our other products from link : https://www.mql5.com/en/users/drbastem/seller    Also, you can ask all your questins from email : haskayafx@gmail.com or mobile : +90
This indicator prepared by  using Haskayafx Target Line Indicators .    This system can be used for 30M time frame and All Symbols.     This system is for Long term and profitable.    Signals are shown as arrows. as an optional,    you can set a voice alarm or email notification    You can fins our other products from link : https://www.mql5.com/en/users/drbastem/seller    Also, you can ask all your questins from email : haskayafx@gmail.com or mobile : +90 530 867 5076 or @MehmetBastem 
This system never paints.   This system created by using Envolpes bands and reverse bar count.   This indicator is only working in M5 period.   This system is for long term and profitable.   Signals are shown as arrows. as an optional limit orders.   You can set a voice alarm or email notification.   You can fins our other products from link : https://www.mql5.com/en/users/drbastem/seller   Also, you can ask all your questins from email : haskayafx@gmail.com or mobile : +90 530 867 5076 or @Meh
PROMOÇÃO LIMITADA, NA COMPRA DE 1 INDICADOR VOCÊ LEVA CLUBINARIAS 6.0 , 5.1 e DonForex DE BRINDE!! ATÉ FINAL DO MÊS! -NA HORA DA COMPRA SELECIONAR COMBINAR COM O VENDEDOR OU BUSCAR PESSOALMENTE, A ENTREGA É DIGITAL EM POUCOS SEGUNDOS ==> VEJA O VIDEO PARA TIRAR AS SUAS DUVIDAS <== ==> VÍDEO OPERANDO NO YOUTUBE ROBÔ FEITO COM MUITO ESFORÇO E CARINHO E QUE ESTA TRAZENDO ÓTIMOS LUCROS APESAR DE EXISTIREM PESSOAS QUE APENAS VENDEM ROBÔS FAKES DE OPERAÇÕES , ACREDITO QUE SERIA M
This system never paints.   This system uses 30 standard MT4 indicators.   This indicator is only working in M5 period.   This system is for long term and profitable.   Signals are shown as arrows. as an optional limit orders.   You can set a voice alarm or email notification.   You can fins our other products from link : https://www.mql5.com/en/users/drbastem/seller   Also, you can ask all your questins from email : haskayafx@gmail.com or mobile : +90 530 867 5076 or @MehmetBastem    on teleg
ZO Signal
Trung Le Hoang
5 (2)
ZO SIGNAL analysis on multiple time frames with ZO check setup. Combining other products of ZO SYSTEM :  https://www.mql5.com/en/users/lht2341990/seller These are indicators of thinking and require you to understand ZO System. For more details please see the wiki or contact the Zo Trader team. Wiki :  http://zoindicator.com/ /*-------------------------------------------------------------------------------------------------------------------------------------------------------------------------
This is a Dashboard Indicator based on Bruce's Price Predictor Indicator . This Dashboard will Give you a visual to see the trend direction without having to flip through timeframes, so you can always be trading in direction of the trend, with little effort.  I Recommend   www.CoinexxBroker.com  as a great broker and the one I personally use *Non-Repainting Dashboard Arrows *For Desktop MT4 Only *Great For Scalping *Great For Swing Trading *Dashboard Arrow Entry Alerts *Dashboard Arrow Signals
作者のその他のプロダクト
MAJOR CHANGES HAS BEEN MADE. Parameter description will be changed. EXPECT ANOTHER UPDATE BEFORE JUNE ENDS. PRICE WILL GO UP AFTER THE FINAL UPDATE. True Currency Meter with Email and SMS push notifications! Have you ever wondered why would some pairs would move more than others, and 100 pips on EURGBP is bigger than 100 pips on EURUSD? And during the news, some would move 200 pips but some would only move 150 pips? This is the key to the newly developed "28 pairs" True Currency Strength Met
(Currently 30% OFF) Before reading the description of this indicator, I just want to introduce to you following concept Moving Average Line - Typical moving average which is based on one chart alone.  Currency Strength Line - The moving average of a certain pair in which the strength is based on 28 pairs. Can be said as the real moving average line. Moving Average indeed is one of the most popular indicator which almost every trader use. Currency Strength Meter is also a trend indicator whic
Think of the rarest pair you can think of. And I assure you that this indicator can compute it's strength. This Currency Meter will literally calculate any currency pairs, either it is the Major Pairs, Metals, CFD's, Commodities, Crypto Currency like Bitcoin/BTC or Ethereum/ETH and even stocks. Just name it and you will get it! There is no currency pair this Currency Meter can solve. No matter how rare or exotic is that currency, it will always be solved by this Currency meter which on a real-ti
MACDは、最も人気のある勢いとトレンドの指標の1つです。 通貨強度メーターは、複数の通貨に基づくトレンドインジケーターでもあります。 MACD通貨強度メーターは、MACDと通貨強度メーターのアルゴリズムを備えた1つのチャートインジケーターです。 また、ダッシュボードに28のメジャーペアとマイナーペアが表示されるワンクリック機能があり、特定のペアをクリックすると、チャートが自動的に選択したチャートに変わります。 製品の利点 インジケーターの使用方法に関する記録されたウェビナー 資金管理、入場、TPおよび出口戦略のための完全なシステム 入力パラメータ MACD設定-高速および低速のEMA値を入力します。デフォルト値は12,26,9です 折れ線グラフの種類、ダッシュボード、市場動向 表示設定-フォント通貨の色、信号の色、線の色、X軸とY軸のオブジェクトの配置 コンピューター、電子メール、チャートアラート
Fibonacci Currency Strength Meter (FCSM) Early Access Sale!! This new product is still in the process of adding new features and settings. For early bird buyers. The Price will be 50% Sale. In a few weeks, the product will be done. Go Grab your copy while it's still cheap. More details will be added soon. Things to be added. Alert Levels Mobile and Email Alert From it's name, Fibonacci Currency Strength Meter is a combination of Fibonacci levels and Currency Strength Meter. The plot of Fib
*注記 : 早期購入者向けに 40% 割引! 無料EAのリリースは11月の第2週となります 無料 EA が利用可能になり次第、割引は終了します RSi インジケーターは、特定の商品またはペアが買われすぎまたは売られすぎていることを示す最も人気のあるインジケーターの 1 つです。 通貨強さメーターは、複数の通貨に基づくトレンド指標でもあります。 RSi通貨強さメーターは、R​​Siと通貨強さメーターのアルゴリズムを備えた1つのチャート指標です。 また、ワンクリック機能もあり、28 のメジャーペアとマイナーペアがダッシュボードに表示され、特定のペアをクリックすると、チャートが選択したチャートに自動的に変更されます。 製品の利点: 取引を管理するための無料のEA。詳細についてはメッセージをください 入力パラメータ RSi 設定 - デフォルトのパラメータは、65/35 レベルの期間 14 です。レベルが高くても低くても、信号は少なくなりますが、より正確になります。 折れ線グラフ、ダッシュボード、市場動向の種類 表示設定 - フォントの通貨の色、信号の色、線の色、および
Think of the rarest pair you can think of. And I assure you that this indicator can compute it is strength. This Currency Meter will literally calculate any currency pairs, either it is a major pair, metal, CFD, commodity, cryptocurrency like Bitcoin/BTC or Ethereum/ETH and even stocks. Just name it and you will get it! There is no currency pair this Currency Meter cannot solve. No matter how rare or exotic is that currency, it will always be solved by this Currency meter on a real-time basis. S
フィルタ:
レビューなし
レビューに返信
バージョン 1.2 2024.07.25
Licensed
バージョン 1.1 2024.07.22
Added some settings