AD Fix mt4
- インディケータ
- Sabina Fik
- バージョン: 1.0
- アクティベーション: 5
The Accumulation/Distribution (AD) Technical Indicator is a tool used in technical analysis to determine whether an asset is being accumulated (bought) or distributed (sold) in the market.
Key Characteristics of the AD Indicator:
Purpose: The AD indicator is used to assess the balance between buying (accumulation) and selling (distribution) of an asset. This helps traders and investors evaluate the strength of the current trend and potential reversals.
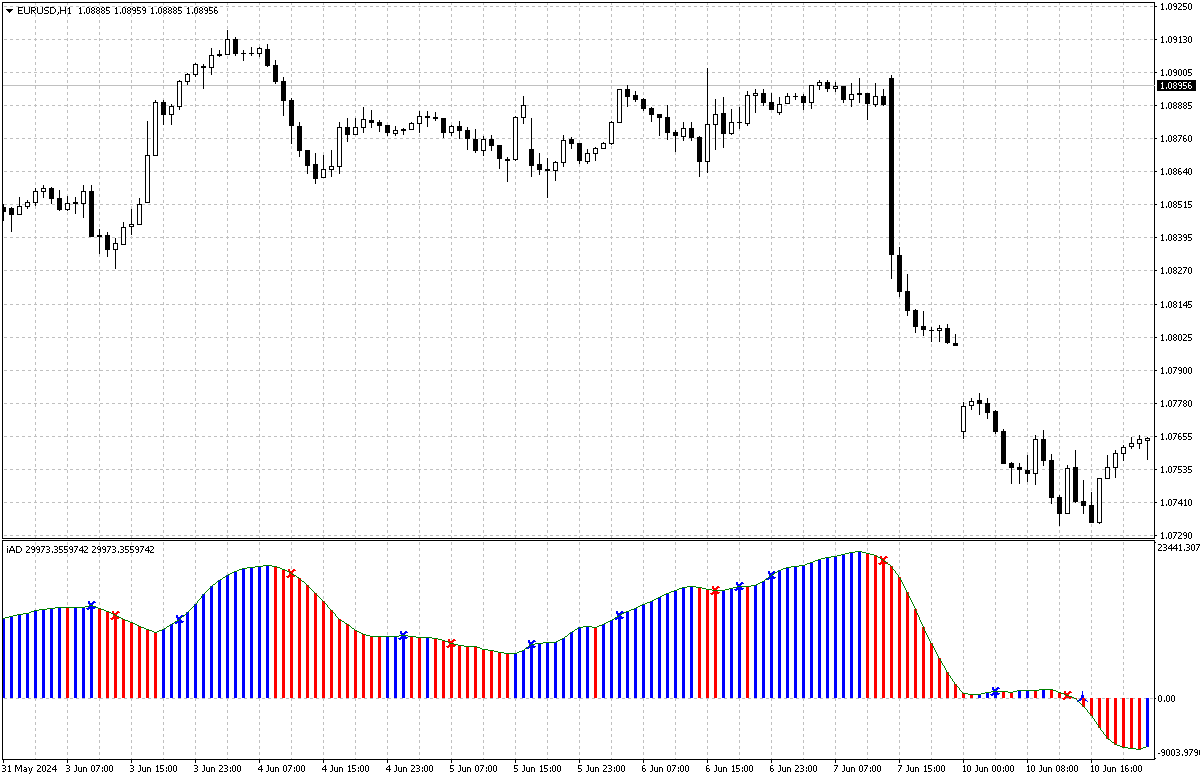
Interpretation:
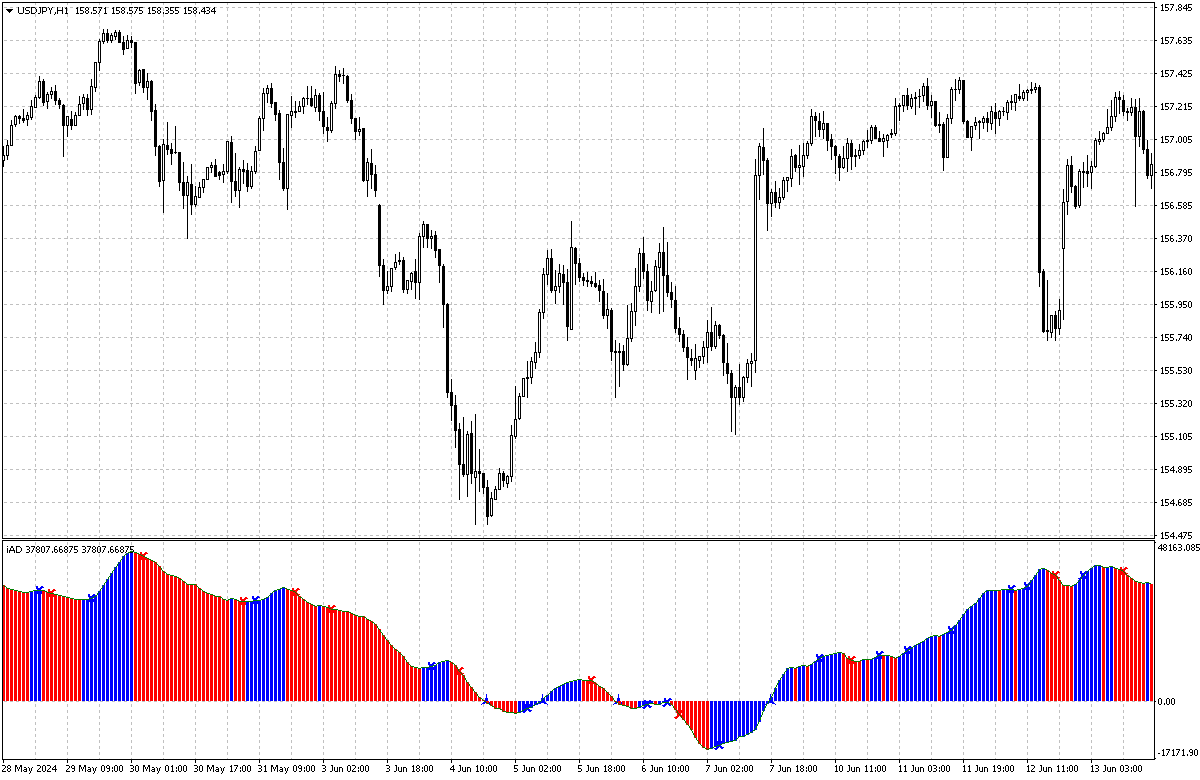
- Rising Indicator: When the AD indicator rises, it indicates that buying is prevailing in the market, which may suggest accumulation of the asset.
- Falling Indicator: When the AD indicator falls, it indicates that selling is prevailing in the market, which may suggest distribution of the asset.
- Divergences: A discrepancy between the asset's price movement and the AD indicator line can indicate potential trend reversals. For example, if the price rises but the AD indicator falls, it may suggest weakness in the upward trend.
Application: The AD indicator is often used in conjunction with other technical indicators to confirm or refute signals. For instance, it can be combined with volume indicators or trend lines for more precise market analysis.
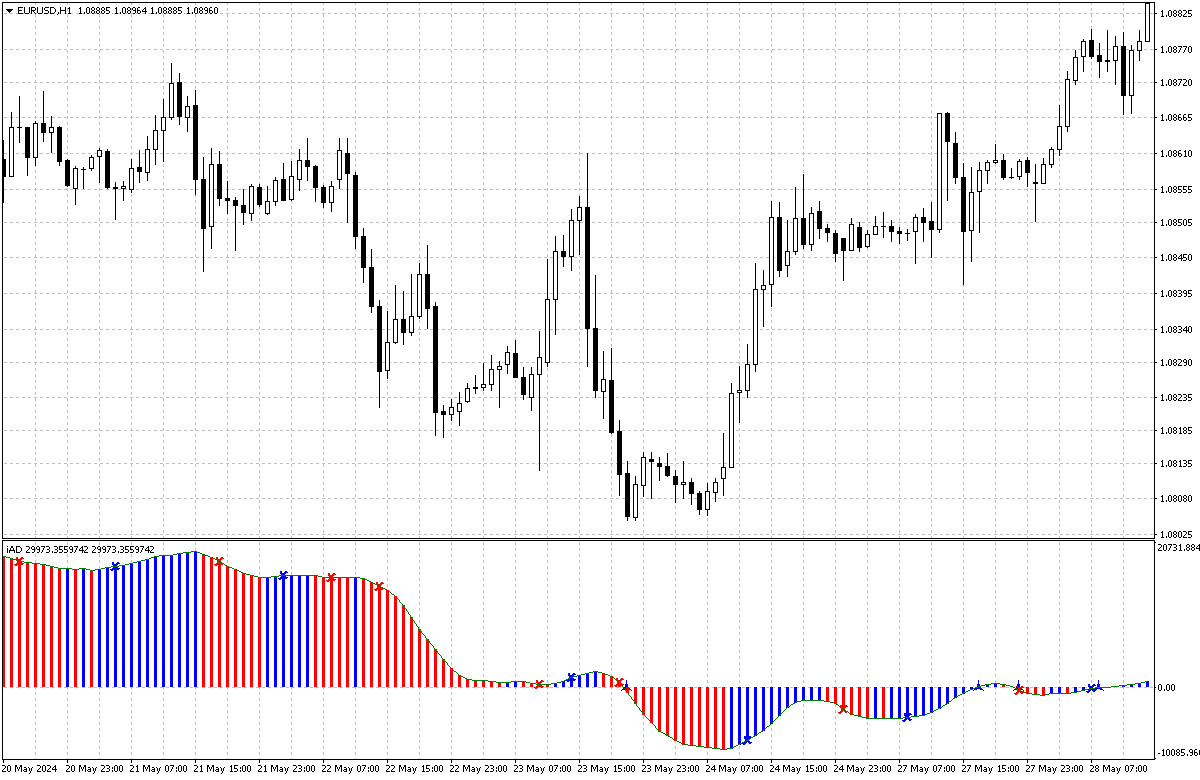
Usage Example:
- Buying: A trader might consider buying an asset if the AD indicator shows a steady rise, indicating accumulation.
- Selling: A trader might consider selling an asset if the AD indicator shows a steady fall, indicating distribution.
The AD indicator is a powerful tool for market analysis, helping traders make more informed decisions based on price and volume data.
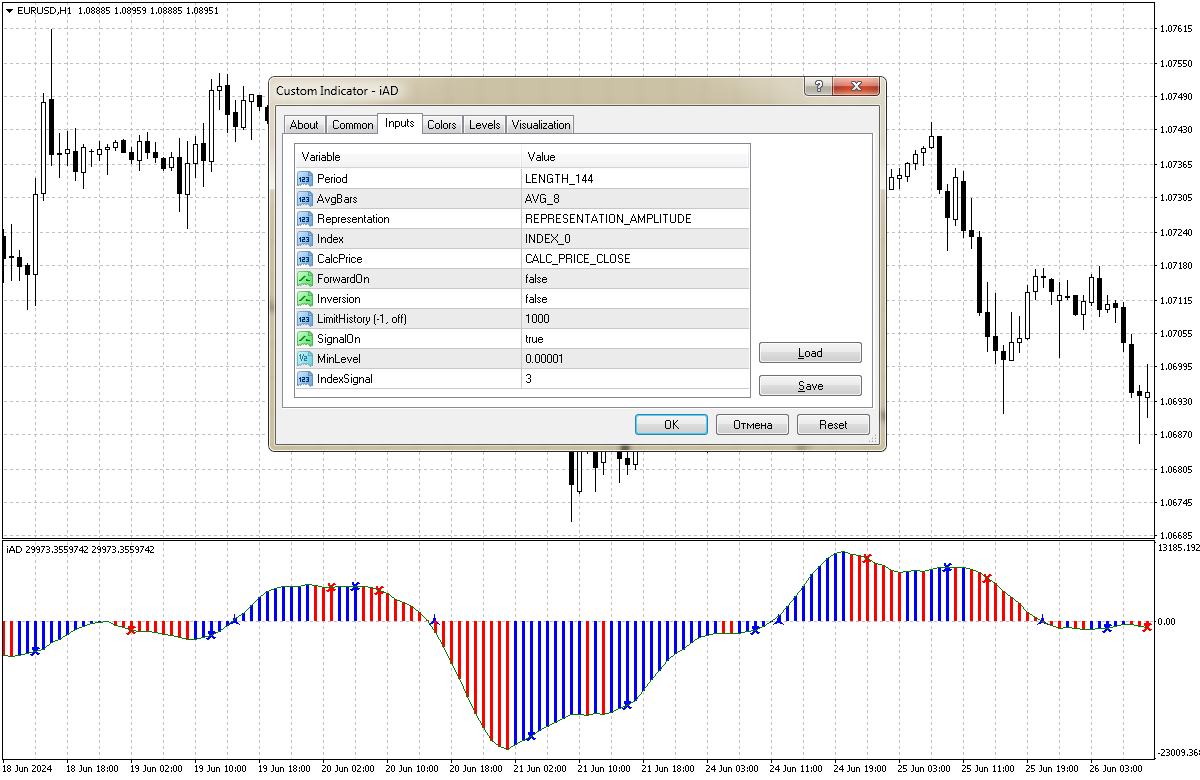
Indicator Parameters
-
Period: The number of bars for calculation. Possible options:
- LENGTH_1 = 1
- LENGTH_2 = 2
- LENGTH_3 = 3
- LENGTH_5 = 5
- LENGTH_8 = 8
- LENGTH_13 = 13
- LENGTH_21 = 21
- LENGTH_34 = 34
- LENGTH_39 = 39
- LENGTH_55 = 55
- LENGTH_89 = 89
- LENGTH_144 = 144
- LENGTH_233 = 233
- LENGTH_377 = 377
- LENGTH_610 = 610
-
AvgBars: Averaging of the final indicator line. Possible options:
- AVG_1 = 1
- AVG_2 = 2
- AVG_3 = 3
- AVG_5 = 5
- AVG_8 = 8
- AVG_13 = 13
- AVG_21 = 21
- AVG_34 = 34
-
Representation: Possible ways to project the indicator. Possible options:
- REPRESENTATION_AMPLITUDE
- REPRESENTATION_SPEED
- REPRESENTATION_ACCELERATION
Additional Indicator Parameters
- Index: The index from which to start the calculation.
- CalcPrice: Apply to the price.
- ForwardOn: Allow forward calculation on the history (the latest bars will not be displayed). Function created for research.
- Inversion: Inversion of the chart.
- LimitHistory: Limit on the history for displaying the indicator.
- SignalOn: Ability to display signal points.
- MinLevel: Price delta of the last two bars when calculating signal points.
- IndexSignal: The number of bars that must consecutively fall or rise to fix the signal.
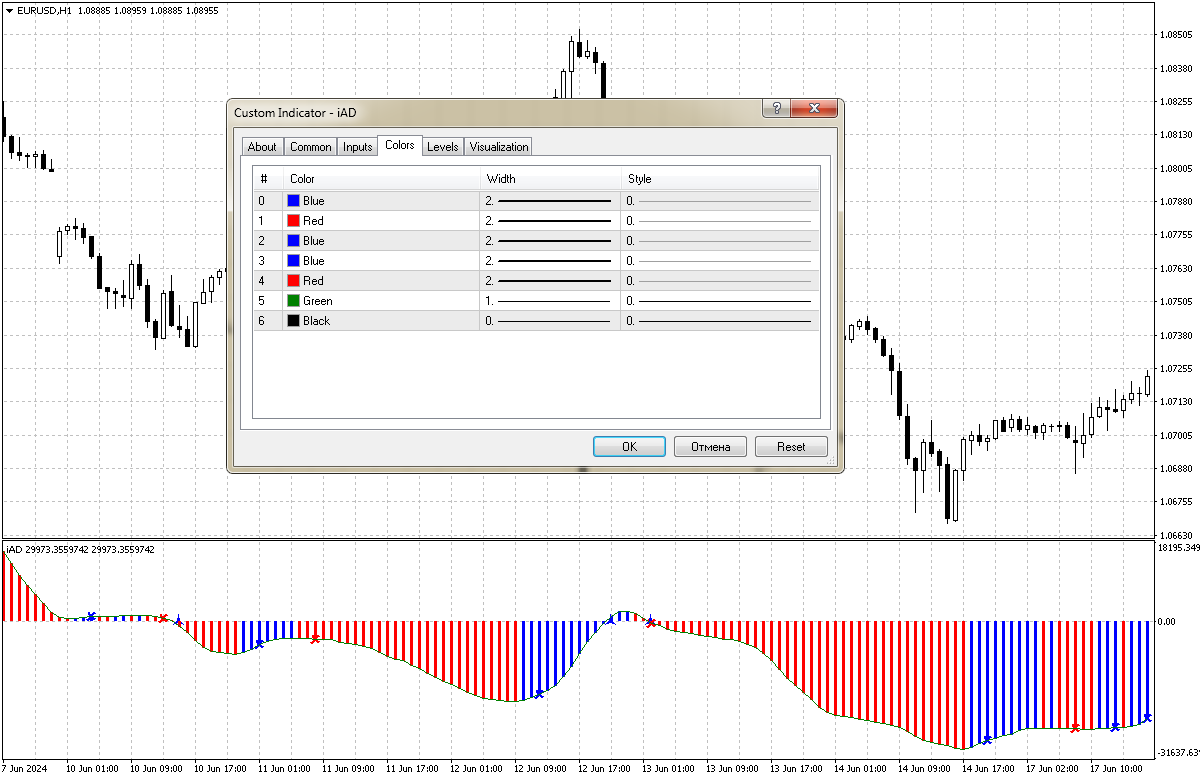
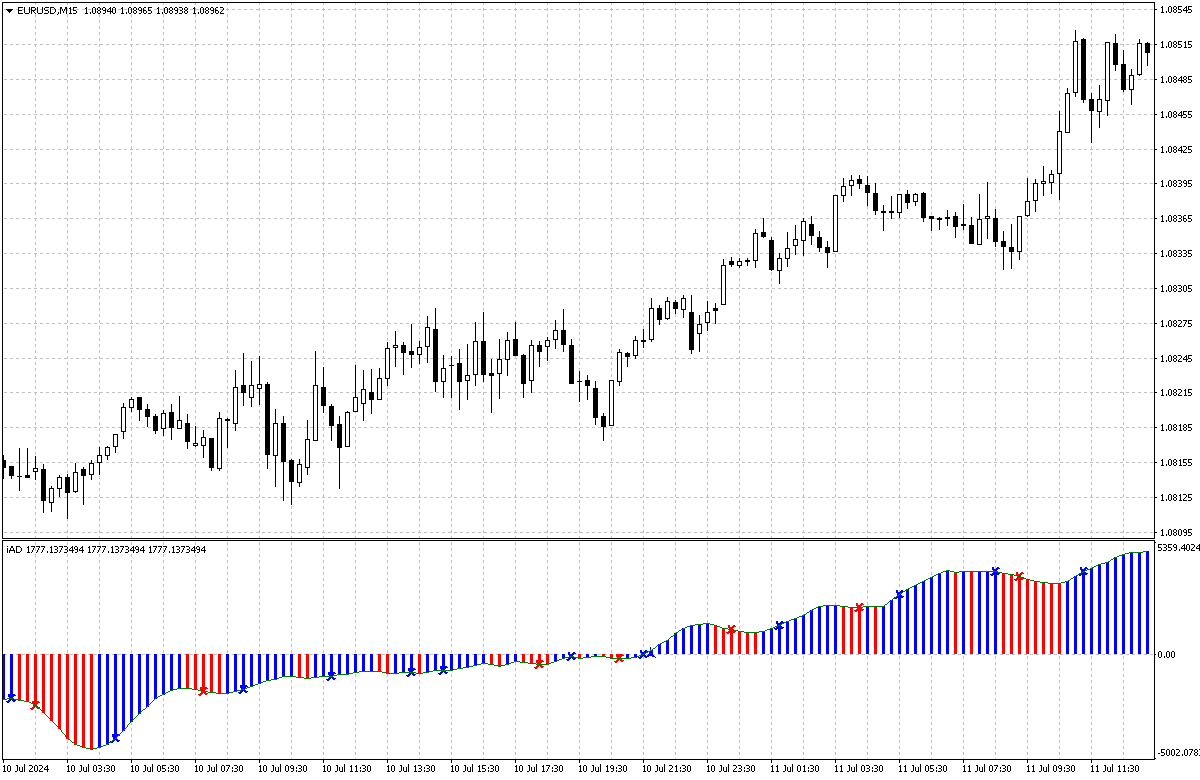
Visualization
Amplitude is the maximum distance an object oscillates from its equilibrium position.
Speed is how fast the object moves. Geometrically, speed indicates the direction and magnitude of the object's movement at each moment.
Acceleration is how quickly the object's speed changes. Geometrically, it can be represented as an arrow that always points towards the mean position.
Amplitude — This is the maximum height the pendulum reaches from its lowest point (equilibrium position).
Speed — This is how fast the pendulum moves. It is highest when the pendulum passes through the lowest point and zero when the pendulum reaches its highest points.
Acceleration — This is the force that brings the pendulum back to its average position. It is highest at the extreme points and zero at the middle point.
These concepts are interconnected and describe different aspects of the movement of an oscillating object.