• 概要
  • レビュー
  • コメント
  • 最新情報

Body Size Strength

ボディサイズストレングスインジケーター

概要

ボディサイズストレングスインジケーター は、日々の価格変動を分析するための包括的な計算スイートを提供し、取引戦略を大幅に強化することができる実用的な洞察を提供します。

主な機能

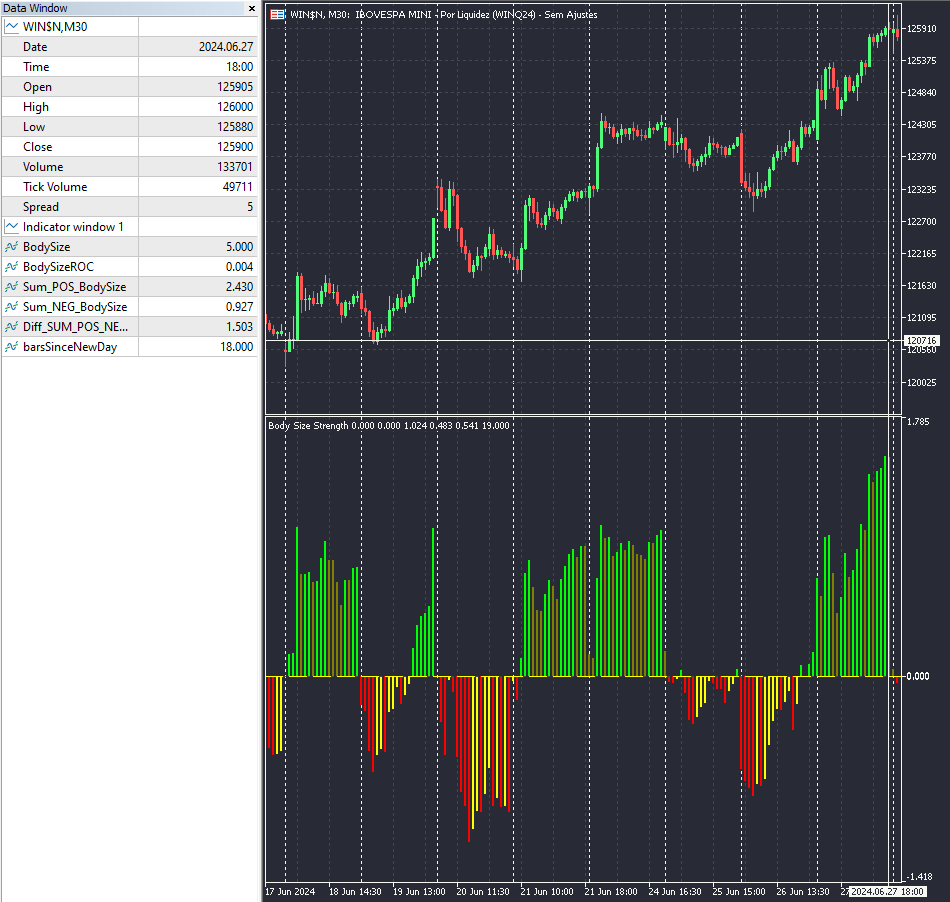
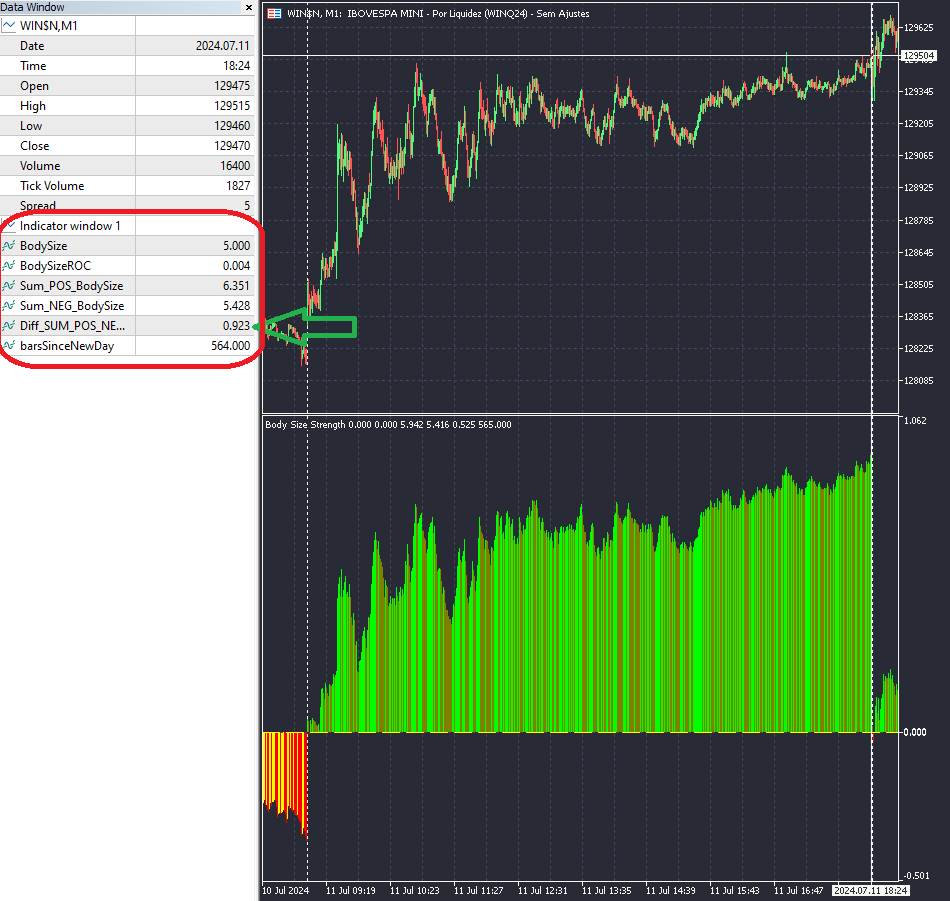
  • 5つの広範なバッファ: BodySize、BodySizeROC、Sum_POS_BodySize、Sum_NEG_BodySize、および Diff_SUM_POS_NEG_BodySize バッファを含み、市場のダイナミクスの詳細でニュアンスのあるビューを提供します。
  • ボディサイズ計算: 終値と始値の絶対差を測定し、価格のボラティリティについての明確な洞察を提供します。日中取引に不可欠です。
  • BodySizeROC: 価格変動の変化率を評価し、ユーザー定義の乗数でスケーリングし、トレーダーが市場の強度とトレンドの強さを評価できるようにします。
  • 累積メトリクス: 正と負の価格変動の累積合計を別々に追跡し、毎日リセットして正確な日中分析のための新鮮で関連性のあるデータを提供します。
  • 純変動分析: 正と負の価格変動の差を計算し、カラーコード付きのヒストグラムで表示し、迅速かつ正確な解釈が可能です。

ボディサイズストレングスインジケーターを選ぶ理由

定量トレーダーは、このインジケーターが提供する広範な計算とバッファを評価するでしょう。アルゴリズム取引システムとシームレスに統合され、戦略の精度と信頼性を向上させます。その詳細なメトリクスと包括的な分析により、市場での優位性を求める人にとって不可欠なツールです。

入力パラメーター

  • ReferencePrice: LastDayClose と DailyOpen のどちらかを選択してリファレンス計算を行い、戦略の柔軟な策定が可能です。
  • Multiplier: 整数値を使用して変化率 (ROC) の計算スケールをカスタマイズし、市場の動きに関するパーソナライズされた洞察を提供します。
  • PlotType: データを視覚化するための複数のプロットオプションから選択し、取引戦略に最適な方法を選択します。
  • EnableLogging: 詳細なデバッグとパフォーマンス分析のためにログを有効または無効にします。

ボディサイズストレングスインジケーター で取引戦略の可能性を最大限に引き出しましょう。今すぐ購読して、この不可欠なツールにアクセスし、定量取引を新たな高みに引き上げましょう。

おすすめのプロダクト
Free automatic Fibonacci is an indicator that automatically plots a Fibonacci retracement based on the number of bars you select on the BarsToScan setting in the indicator. The Fibonacci is automatically updated in real time as new highest and lowest values appears amongst the selected bars. You can select which level values to be displayed in the indicator settings. You can also select the color of the levels thus enabling the trader to be able to attach the indicator several times with differe
FREE
Marca Dagua
Erison Francisco De Sales
3 (1)
Adiciona marca d'água com nome do ativo em negociação. Pode ser ajustado definindo tamanho da fonte e coloração do texto. Testado com vários ativos do mercado B3 e Forex  Adione ao gráfico e configure de acordo com a necessidade. Caso tenha problemas sinta-se a-vontade para nos avisar e providenciaremos a correção logo que possível. ______________________________
FREE
ピボットポイントフィボRSJは、フィボナッチレートを使用してその日のサポートラインとレジスタンスラインを追跡するインジケーターです。 この壮大な指標は、フィボナッチレートを使用してピボットポイントを通じて最大7レベルのサポートとレジスタンスを作成します。 価格がこのサポートとレジスタンスの各レベルを尊重する方法は素晴らしいです。そこでは、オペレーションの可能な入口/出口ポイントを認識することができます。 特徴 最大7レベルのサポートと7レベルの抵抗 レベルの色を個別に設定します 入力 ピボットタイプ ピボットフィボRSJ1 =フィボ比1の計算 ピボットフィボRSJ2 =フィボ比2の計算 ピボットフィボRSJ3 =フィボ比3の計算 ピボットフィボクラシック=クラシックピボット計算 最小ピボットレベル ピボット3レベル ピボット4レベル ピボット5レベル ピボット6レベル ピボット7レベル それでも質問がある場合は、ダイレクトメッセージで私に連絡してください: https://www.mql5.com/ja/users/robsjunqueira/
FREE
VI Vortex
Fernando Lahude Ritter
4.67 (3)
Description : Enhance Your Trading Strategy with the Advanced Vortex Indicator for MT5! Discover the power of the Vortex Indicator (VI), a robust technical analysis tool now available for MetaTrader 5. This custom-built indicator is designed to help traders identify trends and reversals, offering a critical edge in the dynamic Forex market. Key Features: Dynamic Trend Identification : With the VI's unique calculations of VI+ (positive) and VI- (negative) lines, you can easily spot trend strength
FREE
Functional in the Forex market. Functional in the B3 market - Bolsa Brasil Balcão. Motivation The technical Fibonacci retraction indicator for many is essential and the basis for all market movement forecasts. The name of the tool comes from the Italian mathematician Leonardo de Pisa (13th century). This DEMO version will work in Meta Trader with Demo and Strategy Tester. To purchase the Full version that works on a Real account, click on: https://www.mql5.com/en/market/product/38089
FREE
This Indicator draws Fibonacci Extension levels in two different ways. You can select whether to draw Fibonacci Extension levels based on your favourite ZigZag settings or you can let the indicator to draw Fibonacci Extension  level based on given number of Bars or Candles.  You can also set Mobile and Email notification for your favourite Extension  levels individually. With this indicator you will not have to feel lonely as the it can generate Voice alerts, which will keep you focused on your
トレンドキャッチャー: アラートインジケーター付きのトレンドキャッチャーストラテジーは、市場トレンドやポテンシャルなエントリーポイントやエグジットポイントを特定するのに役立つ多目的な技術分析ツールです。動的なトレンドキャッチャーストラテジーを備えており、市場状況に適応してトレンドの方向を明確に視覚化します。トレーダーは、自身の好みやリスク許容度に合わせてパラメーターをカスタマイズできます。このインジケーターはトレンドの識別を支援し、ポテンシャルなリバーサルをシグナルし、トレイリングストップのメカニズムとして機能し、市場への迅速な対応のためのリアルタイムアラートを提供します。 特徴: - トレンドの識別:上昇トレンドと下降トレンドをシグナルします。 - トレンドのリバーサル:ローソク足の色が上昇から下降に変わった場合やその逆の場合に、ポテンシャルなリバーサルを警告します。 - リアルタイムアラート:新しいトレンドの識別に対するアラートを生成します。 推奨事項: - 通貨ペア:EURUSD、AUDUSD、XAUUSDなど... - タイムフレーム:H1。 - アカウン
FREE
Spike Catch Pro 22:03 release updates Advanced engine for searching trade entries in all Boom and Crash pairs (300,500 and 1000) Programmed strategies improvements Mx_Spikes (to combine Mxd,Mxc and Mxe), Tx_Spikes,   RegularSpikes,   Litho_System,   Dx_System,   Md_System,   MaCross,   Omx_Entry(OP),  Atx1_Spikes(OP),   Oxc_Retracement (AT),M_PullBack(AT) we have added an arrow on strategy identification, this will help also in the visual manual backtesting of the included strategies and see h
FREE
XCalper CandleTimer
Aecio de Feo Flora Neto
4.45 (20)
This auxiliary indicator displays time left before closing on the current timeframe with continuous update . It also shows the last trade price and variation from a previous day close in percentage and points. This indicator is pretty handy for daytraders and scalpers who want to precisely monitor closing and opening of candles. Indicator parameters Show in shifted end - Default: False. Display time and values on screen. If True, Displays only time to close aside last candle. Distance from the
FREE
Price Ray
Keni Chetankumar Gajanan -
4.88 (8)
Price Ray indicator is a utility that will improve the way you trade. Primarily, it shows the Bid, Ask or Last price as a line ray which beams till the current candle, last visible chart candle or extended to all candle bars. The enhanced features in this indicator provide information in an area where you focus most, right next to the current candle. You can select text to be shown above or below the Price ray. The indicator is fully customizable, allowing it to fit any strategy requirements. Th
FREE
Donchian Channel is an indicator created by Richard Donchian. It is formed by taking the highest high and the lowest low of the last specified period in candles. The area between high and low is the channel for the chosen period. Its configuration is simple. It is possible to have the average between the upper and lower lines, plus you have alerts when price hits one side. If you have any questions or find any bugs, please contact me. Enjoy!
FREE
Easy GOLD MT5
Franck Martin
4.37 (19)
Easy Gold is the latest addition to the BotGPT family. It is surprising and very powerful. It is ideal for beginners due to its simplicity.  There is absolutely nothing to do, it's 100% automated, simply indicate the percentage of risk you want to take per trade and the EA is ready. Whatever your capital, the EA takes care of everything. Optimized on (XAUUSD).  Unleash all the power with the professional version (AGI Gold) and its connection to the neural network, available in my store. My othe
FREE
Follow The Line MT5
Oliver Gideon Amofa Appiah
4.42 (31)
This indicator obeys the popular maxim that: "THE TREND IS YOUR FRIEND" It paints a GREEN line for BUY and also paints a RED line for SELL. (you can change the colors). It gives alarms and alerts of all kinds. IT DOES NOT REPAINT and can be used for all currency pairs and timeframes. Yes, as easy and simple as that. Even a newbie can use it to make great and reliable trades. NB: For best results, get my other premium indicators for more powerful and reliable signals. Get them here: https://www.m
FREE
Multset  This is inte_plays indicator, which helps the trader to enter the trades appropriately it plots an arrow when there is appropriate environment which permits trading Features 1. Sends push notification on mobile devices  2. Plots arrow on chart when the setting is found TimeFrame Is suggested to be used on higher time frames only, especially starting 15min and above for proper moves For more informations please  Visit:  https://t.me/Tz_Fx_Lab Subscribe to our Youtube channel:  htt
FREE
The concept is simple: Plotting Price behavior within several periods of time. Some Symbols behave very well during the trading day - with this I mean Intraday trading - and this behavior ends up plotting effectively well with the proposed Exponential Moving Averages in this indicator... Obviously that this behavior could not be seen in all Symbols, but you can give it a try... Just drop this indicator in a chart and you will see for yourself... This indicator is intended for "Feeling the Trend
FREE
The indicator detects and displays М. Gartley's Butterfly pattern. The pattern is plotted by the extreme values of the ZigZag indicator (included in the resources, no need to install). After detecting the pattern, the indicator notifies of that by the pop-up window, a mobile notification and an email. The pattern and wave parameters are displayed on the screenshots. The default parameters are used for demonstration purposes only in order to increase the amount of detected patterns. Parameters
Fibonacci and RSI. Demo versión only works with GBPUSD. For full version, please, visit visit https://www.mql5.com/en/market/product/52101 The indicator is a combination of the Fibonacci and RSI indicators. Every time the price touches one of the fibonacci levels and the rsi condition is met, an audible alert and a text alert are generated. Parameters number_of_candles : It is the number of candles that will be calculated. If you put 100, the indicator will give you the maximum and min
FREE
Are you tired of drawing trendlines every time you're analyzing charts? Or perhaps you would like more consistency in your technical analysis. Then this is for you. This indicator will draw trend lines automatically when dropped on a chart. How it works Works similar to standard deviation channel found on mt4 and mt5. It has 2 parameters: 1. Starting Bar 2. Number of bars for calculation The   starting bar   is the bar which drawing of the trend lines will begin, while the   number of bars for c
FREE
Unlock the full potential of your Pro Thunder V9 indicator with our revolutionary new plugin - Auto Trend Lines! Are you looking for a competitive edge in today's dynamic market? Look no further. With Auto Trend Lines, you can harness the power of precise market trend analysis to make informed trading decisions. This innovative plugin seamlessly integrates with your Pro Thunder V9 indicator, providing you with real-time trend data and pinpointing exact entry and exit points for your trades. Key
FREE
Auto Fib Retracements
Ross Adam Langlands Nelson
4.33 (6)
Automatic Fibonacci Retracement Line Indicator. This indicator takes the current trend and if possible draws Fibonacci retracement lines from the swing until the current price. The Fibonacci levels used are: 0%, 23.6%, 38.2%, 50%, 61.8%, 76.4%, 100%. This indicator works for all charts over all timeframes. The Fibonacci levels are also recorded in buffers for use by other trading bots. Any comments, concerns or additional feature requirements are welcome and will be addressed promptly. 
FREE
Best SAR MT5
Ashkan Hazegh Nikrou
5 (1)
説明 :  外国為替市場(PSAR)で専門的で人気のあるインジケーターの1つに基づいた新しい無料インジケーターをご紹介します。このインジケーターは元のパラボリックSARインジケーターの新しい変更です。プロSARインジケーターでは、ドットと価格チャートのクロスオーバーを見ることができます。クロスオーバーはシグナルではありませんが、動きの終わりの可能性について話します。新しい青いドットで購入を開始し、最初の青いドットの1 atr前にストップロスを配置し、最後にドットが価格チャートを横切るとすぐに終了できます。 売買シグナルを開く方法は? 最初の青い点によるオープンバイトレードと最初の赤いドットによるオープンセルトレード 正しいストップロスはどこにありますか? 安全なストップロスは最初のドットにある可能性があります(最初の青いドットの買いの場合と最初の赤い点の売りの場合) 正しいテイクプロフィットはどこにありますか? テイクプロフィットはストップロス距離とRRに基づいて調整できるので、私の提案は2 RRで、ストップロスの2倍です。 利益を上げているのにtpを達成でき
FREE
The Penta-O is a 6-point retracement harmonacci pattern which usually precedes big market movements. Penta-O patterns can expand and repaint quite a bit. To make things easier this indicator implements a twist: it waits for a donchian breakout in the right direction before signaling the trade. The end result is an otherwise repainting indicator with a very reliable trading signal. The donchian breakout period is entered as an input. [ Installation Guide | Update Guide | Troubleshooting | FAQ | A
FREE
Bollinger Bands B
Flavio Javier Jarabeck
5 (3)
John Bollinger created this indicator in 2010 as a way to read the original indicator (Bollinger Bands) in a more "technical" way, shown as an oscillator. The typical range of the Bollinger Bands %B is 0 - 0.5 - 1.0, where "0" represents the lower band, the "0.5" the middle band, and "1" the upper band. The line on the indicator represents the Closing prices. As simple as that. SETTINGS Bollinger Bands period of analysis Standard Deviation multiplier Shift Price type to be analyzed If you
FREE
Necessary for traders: tools and indicators Waves automatically calculate indicators, channel trend trading Perfect trend-wave automatic calculation channel calculation , MT4 Perfect trend-wave automatic calculation channel calculation , MT5 Local Trading copying Easy And Fast Copy , MT4 Easy And Fast Copy , MT5 Local Trading copying For DEMO Easy And Fast Copy , MT4 DEMO Easy And Fast Copy , MT5 DEMO 高度なボリンジャーバンド: 1.ボリンジャーレールは方向によって色が変わります」 2.ボリンジャーアウターレールの伸縮はアウターレールの色の変化でマークされます。」 3.ボリンジャ
FREE
Tops & Bottoms Indicator FREE   Tops abd Bottoms:   An effective indicator for your trades The tops and bottoms indicator helps you to find  ascending and descending channel formations with indications of ascending and/or descending tops and bottoms. In addition, it  show possibles  opportunities with a small yellow circle when the indicator encounters an impulse formation. This indicator provide to you  more security and speed in making entry decisions. Also test our FREE advisor indicator:
FREE
Pivot Points are used by Forex traders to find support and resistance levels based on the previous day's price action. There are various ways to calculate pivot points, including averaging the open, high, low, and close of the previous day's chart price. Forex Traders use a combination of pivot points with moving averages to find trading opportunities in the currency markets. Pivot points are very useful tools that use the previous bars' highs, lows and closings to project support and re
FREE
EMAs Mago Trader
Flavio Javier Jarabeck
4.5 (2)
For those traders and students who follow the famous brazilian trader Igor Rodrigues (Mago Trader) here it is his famous 2 EMAs - based on Phi ratios - and packed with a twist: a Filling Area , to easily and visually spot the corresponding trend on the chart. You can turn On and Off this filling. If you don't know Igor Rodrigues and you are a brazilian trader and student, just google for him... Very simple and useful indicator. If you are looking also for the MACD -based indicator of this trad
FREE
Watermark Centralized Adds a watermark centered with the asset name and chosen period. It is possible to override the font type, font size, font color and separator character. The watermark is positioned behind the candles, not disturbing the visualization. It has automatic re-centering if the window is resized. Hope this indicator helps you, good trading ;)
FREE
Combining the best of Price Action , Directional Movement , and Divergence/Convergence analysis, Candle Color Trend is a easy and reliable way to identify trend direction. The indicator automatically paints the candles according to the assumption that an uptrend is defined by prices that form a series of higher highs and higher lows. In contrast, a downtrend is defined by prices that form a series of lower highs and lower lows. Additionally, ADX Wilder indicator is used to measure trend weakness
FREE
Medias
Claudio Andrade Colares
入力信号平均フィルターを備えたトレンド追跡インジケーター このインジケーターは、移動平均をエントリーシグナルとして使用し、トレンドトラッカーおよびフィルターとして機能します。 移動平均は、さまざまなトレンドの範囲を決定するための鍵となります。 - 標準的な 200 期間の一次平均は、長期的な傾向を示します。 - 50 期間の二次平均は中期的な傾向を示します。 - 20 期間の三次平均は、最も短い傾向を示します。 - 9 期間の平均は、即時アクションのエントリートリガーとして機能します。 このインジケーターはトレーダーにとって貴重なツールであり、市場トレンドの正確かつ包括的な分析を提供し、慎重に選択された移動平均に基づいてタイムリーなエントリーポイントを特定します。 エントリーシグナル平均フィルターを備えたトレンド追跡インジケーターを使用して、取引戦略を強化し、より多くの情報に基づいた意思決定を行います。 今すぐダウンロードして取引結果を高めましょう!
FREE
このプロダクトを購入した人は以下も購入しています
まず第一に、この取引インジケーターは再描画されず、再描画されず、遅延しないことを強調する価値があります。これにより、手動取引とロボット取引の両方に理想的なものになります。 ユーザーマニュアル:設定、入力、戦略。 アトミックアナリストは、価格の強さとモメンタムを利用して市場でより良いエッジを見つけるためのPA価格アクションインジケーターです。ノイズや誤ったシグナルを除去し、取引ポテンシャルを高めるための高度なフィルターを備えています。複雑なインジケーターの複数のレイヤーを使用して、アトミックアナリストはチャートをスキャンし、複雑な数学的計算をシンプルなシグナルと色に変換します。これにより、どのような初心者トレーダーでも理解して使用し、一貫した取引の決定を行うことができます。 「アトミックアナリスト」は、新規および経験豊富なトレーダー向けにカスタマイズされた包括的な取引ソリューションです。プレミアムインジケーターとトップノッチの機能を1つの取引戦略に組み合わせ、すべてのタイプのトレーダーにとって汎用性のある選択肢にします。 デイリートレーディングとスキャルピング戦略:高速で正確な
まず第一に、このトレーディングシステムがノンリペイント、ノンリドロー、ノンラグのインジケーターであることを強調する価値がある。これにより、手動取引とロボット取引の両方に理想的なものになっています。 オンラインコース、マニュアル、プリセットのダウンロード。 「スマートトレンドトレーディングシステム MT5」は、新規および経験豊富なトレーダー向けにカスタマイズされた包括的なトレーディングソリューションです。10以上のプレミアムインジケーターを組み合わせ、7つ以上の堅実なトレーディング戦略を備えており、多様な市場状況に対応する多目的な選択肢となっています。 トレンドフォロー戦略:トレンドを効果的に乗り越えるための正確なエントリーとストップロス管理を提供します。 リバーサル戦略:潜在的なトレンドの反転を特定し、トレーダーがレンジ相場を活用できるようにします。 スキャルピング戦略:高速で正確なデイトレードおよび短期取引のために設計されています。 安定性:すべてのインジケーターはノンリペイント、ノンリドロー、ノンラグであり、信頼性の高いシグナルを保証します。 カスタマイズ:個々の取引の嗜好に合わせ
Quantum Trend Sniper
Bogdan Ion Puscasu
4.91 (46)
ご紹介   クォンタム トレンド スナイパー インジケーターは 、トレンド反転を特定して取引する方法を変革する画期的な MQL5 インジケーターです。 13年以上の取引経験を持つ経験豊富なトレーダーのチームによって開発されました。     クォンタムトレンドスナイパーインジケーター   は、非常に高い精度でトレンドの反転を識別する革新的な方法で、あなたのトレーディングの旅を新たな高みに押し上げるように設計されています。 ***Quantum Trend Sniper Indicatorを購入すると、Quantum Breakout Indicatorを無料で入手できます!*** クォンタム ブレイクアウト インジケーターは、トレンドの反転を特定するとアラートを発し、矢印を示し、3 つのテイクプロフィットレベルを提案します。 初心者トレーダーにもプロのトレーダーにも適しています。 量子EAチャネル:       ここをクリック MT4のバージョン:       ここをクリック 推奨事項: 期間:すべての時間枠。最良の結果を得るには、M
Gold Stuff mt5
Vasiliy Strukov
4.89 (180)
Gold Stuff mt5 は、金専用に設計されたトレンド指標であり、あらゆる金融商品にも使用できます。 インジケーターは再描画せず、遅れません。 推奨時間枠 H1. 設定と個人的なボーナスを得るために、購入後すぐに私に連絡してください!  トレンド スキャナーの強力なサポートを利用して、無料のインジケーターを入手し、プライバシーを守ります。あーみー!   設定 矢印を描く - オンオフ。 チャートに矢印を描く。 アラート - 可聴アラートのオンオフ。 メール通知 - オンオフ。 電子メール通知。 プチ通知 - オンオフ。 プッシュ通知。 次に、色域を調整します。 Gold Stuff mt5 は、金専用に設計されたトレンド指標であり、あらゆる金融商品にも使用できます。 インジケーターは再描画せず、遅れません。 推奨時間枠 H1. 設定と個人的なボーナスを得るために、購入後すぐに私に連絡してください!   設定 矢印を描く - オンオフ。 チャートに矢印を描く。 アラート - 可聴アラートのオンオフ。 メール通知 - オンオフ。 電子メール通知。 プチ通
まず第一に、この取引ツールはノンリペイント、ノンリドロー、ノンラグの指標であり、プロの取引に理想的ですことを強調する価値があります。 オンラインコース、ユーザーマニュアル、デモ。 スマートプライスアクションコンセプトインジケーターは、新米から経験豊富なトレーダーまで、非常 に強力なツールです。Inner Circle Trader AnalysisやSmart Money Concepts Trading Strategiesなど、20以上の有用な指標を1つに組み合わせています。このインジケーターはスマートマネーコンセプトに焦点を当て、大手機関の取引方法を提供し、彼らの動きを予測するのに役立ちます。 特に、流動性分析に優れており、機関がどのように取引しているかを理解しやすくしています。市場のトレンドを予測し、価格の動きを慎重に分析するのに優れています。機関の戦略とトレードを合わせることで、市場の動向についてより正確な予測ができます。このインジケーターは多目的であり、市場構造を分析し、重要な注文ブロックを特定し、さまざまなパターンを認識するのに優れています。 このインジ
The AT Forex Indicator MT5 is a sophisticated trading tool designed to provide traders with a comprehensive analysis of multiple currency pairs. This powerful indicator simplifies the complex nature of the forex market, making it accessible for both novice and experienced traders. AT Forex Indicator uses advanced algorithms to detect trends, patterns and is an essential tool for traders aiming to enhance their forex trading performance. With its robust features, ease of use, and reliable signal
これはMT5のインジケーターで、再描画なしで取引に参入するための正確なシグナルを提供します。 外国為替、暗号通貨、金属、株式、インデックスなど、あらゆる金融資産に適用できます。かなり正確な見積もりを提供し、取引を開始して終了するのに最適な時期を教えてくれます。1つのシグナルを処理しただけでインジケーターの元が取れた例の 動画 (6:22)をご覧ください。Entry PointsPro インジケーターの助けを借りたほとんどのトレーダーの最初の1週間の結果が改善しています。 Telegramグループ に登録してください。Entry Points Proインジケーターのメリットは次の通りです。 再描画のないエントリーシグナル 再描画されるインジケーターでは一度表示されたシグナルが削除されて大きな金銭的損失につながることがありますが、これと異なり、表示されて確認されたシグナルは消えることがありません。 エラーなしの取引開始 インジケーターアルゴリズムによって取引を開始する(資産を売買する)理想的な瞬間を見つけることができます。それを使用するすべてのトレーダーの成功率が向上します。
トレンド スクリーナー インジケーターでトレンド取引の力を解き放ちます。ファジー ロジックと複数通貨システムを活用した究極のトレンド取引ソリューションです。 ファジー ロジックを活用した革新的なトレンド インジケーターである Trend Screener を使用して、トレンド取引を向上させます。 これは、13 を超えるプレミアム ツールと機能、および 3 つの取引戦略を組み合わせた強力なトレンド追跡インジケーターであり、Metatrader をトレンド アナライザーにする多用途の選択肢となります。 期間限定オファー : トレンド スクリーナー インジケーターは、わずか 50 ドルで生涯ご利用いただけます。 (元の価格 125$ ) (オファー延長) Trend Screener の 100% 非再描画精度の揺るぎない精度を体験して、取引の決定が過去の価格変動の影響を受けないようにしてください。 マルチタイムフレームおよびマルチ通貨機能の多用途性を解放し、比類のない自信を持って外国為替、商品、暗号通貨、インデックスの世界を取引できるようにします。 Trend Screener の包括的な
mql5と Telegramの モーニング・ブリーフィングで、詳細とスクリーンショットを含む毎日のマーケット・アップデートをご覧 ください! FX Power MT5 NGは 、長年の人気を誇る通貨強度計FX Powerの次世代モデルです。 この次世代ストレングスメーターは何を提供するのでしょうか?初代FXパワーの魅力すべて プラス GOLD/XAUの強さ分析 より正確な計算結果 個別に設定可能な分析期間 カスタマイズ可能な計算上限値により、さらに優れたパフォーマンスを実現 もっと見たい人のための特別なマルチインスタンス設定 すべてのチャートでお好みの色を無限に設定可能 数え切れないほどの通知オプションにより、重要なことを見逃すことはありません。 Windows 11とmacOSのスタイルで角を丸くした新しいデザイン 魔法のように動くインジケーターパネル FXパワーの主な機能 すべての主要通貨の強さの完全な履歴 すべての時間枠における通貨の強さの履歴 すべてのブローカーとチャートで同一の計算結果 100%信頼できるリアルタイム計算 -> リペイントなし ドロップダウン・リストから
Reversal First Impulse levels (RFI)      INSTRUCTIONS        RUS       -       ENG              R ecommended to use with an indicator   -   TPSpro  TREND PRO -  Version MT4                 A key element in trading is zones or levels from which decisions to buy or sell a trading instrument are made. Despite attempts by major players to conceal their presence in the market, they inevitably leave traces. Our task was to learn how to identify these traces and interpret them correctly. Main functi
TPSpro TRENDPRO  - is a trend indicator that automatically analyzes the market and provides information about the trend and each of its changes, as well as giving signals for entering trades without redrawing! The indicator uses each candle, analyzing them separately. referring to different impulses - up or down impulse. Exact entry points into transactions for currencies, crypto, metals, stocks, indices!  -  Version MT4               DETAILED DESCRIPTION               R ecommended to use with
FX Volume MT5
Daniel Stein
4.94 (17)
mql5と Telegramの モーニング・ブリーフィングで、詳細とスクリーンショットを含む毎日のマーケット・アップデートをご覧 ください! FX Volumeは、ブローカーの視点から市場のセンチメントをリアルに洞察する、最初で唯一の出来高インジケーターです。 ブローカーのような機関投資家が外国為替市場でどのようなポジションをとっているか、COTレポートよりもはるかに速く、素晴らしい洞察を提供します。 この情報をチャート上で直接見ることは、あなたの取引にとって真のゲームチェンジャーであり、画期的なソリューションです。 以下のようなユニークなマーケットデータ洞察から利益を得てください。 比率は 、通貨のロングポジションとショートポジションの比率をパーセントで表示します。 比率の変化は 、選択した期間内のロング比率とその変化率を表示します。 Volumes Totalは 、通貨の取引量(ロングとショート)の合計をロット単位で表示します。 Volumes Long :全通貨のロングポジションの取引量を表示します。 Volumes(ショート )は、全通貨のショートポジションの取引量を表示
Gartley Hunter Multi - An indicator for searching for harmonic patterns simultaneously on dozens of trading instruments and on all possible timeframes. Manual (Be sure to read before purchasing) | Version for MT4 Advantages 1. Patterns: Gartley, Butterfly, Shark, Crab. Bat, Alternate Bat, Deep Crab, Cypher 2. Simultaneous search for patterns on dozens of trading instruments and on all possible timeframes 3. Search for patterns of all possible sizes. From the smallest to the largest 4. A
ご紹介     Quantum Breakout PRO は 、ブレイクアウト ゾーンの取引方法を変革する画期的な MQL5 インジケーターです。 13年以上の取引経験を持つ経験豊富なトレーダーのチームによって開発されました。     クォンタム ブレイクアウト プロ   は、革新的でダイナミックなブレイクアウト ゾーン戦略により、あなたのトレーディングの旅を新たな高みに押し上げるように設計されています。 クォンタム ブレイクアウト インジケーターは、5 つの利益ターゲット ゾーンを備えたブレイクアウト ゾーン上のシグナル矢印と、ブレイクアウト ボックスに基づいたストップロスの提案を提供します。 初心者トレーダーにもプロのトレーダーにも適しています。 量子EAチャネル:       ここをクリック 重要!購入後、インストールマニュアルを受け取るためにプライベートメッセージを送ってください。 推奨事項: 時間枠: M15 通貨ペア: GBPJPY、EURJPY、USDJPY、NZDUSD、XAUUSD アカウントの種類: ECN、Raw、またはス
Bill Williams Advanced is designed for automatic chart analysis using Bill Williams' "Profitunity" system. The indicator analyzes four timeframes at once. Manual (Be sure to read before purchasing) Advantages 1. Automatically analyzes the chart using the "Profitunity" system of Bill Williams. The found signals are placed in a table in the corner of the screen. 2. Equipped with a trend filter based on the Alligator indicator. Most of the system signals are recommended to be used only accordi
ICT, SMC, SMART MONEY CONCEPTS, SMART MONEY, Smart Money Concept, Support and Resistance, Trend Analysis, Price Action, Market Structure, Order Blocks, BOS/CHoCH,   Breaker Blocks ,  Momentum Shift,   Supply&Demand Zone/Order Blocks , Strong Imbalance,   HH/LL/HL/LH,    Fair Value Gap, FVG,  Premium  &   Discount   Zones, Fibonacci Retracement, OTE, Buy Side Liquidity, Sell Side Liquidity, BSL/SSL Taken, Equal Highs & Lows, MTF Dashboard, Multiple Time Frame, BigBar, HTF OB, HTF Market Structure
ブレーカートレーダーになり、価格が反転すると市場構造からの利益が変化します。 注文ブロックブレーカーインジケーターは、トレンドまたは価格の動きが枯渇に近づいており、逆転の準備ができていることを識別します。通常、反転または大規模なプルバックが発生しようとしているときに発生する市場構造の変化について警告します。 この指標は、ブレイクアウトと価格の勢いを識別する独自の計算を使用します。使い果たされる可能性のあるポイントの近くで新しい高値が形成されるたびに、インディケーターはその高値の作成を担当する最後の注文ブロックを描きます。次に、移動する価格とともに注文ブロックを追跡します。その後、価格が反対方向にシフトし、その注文ブロックを突破すると、新しい市場構造を作成し、トレンドまたは大きな後退の可能性のある反転の開始を警告します。 注文ブロックは、高値/安値が作成される前の最後の反対色のろうそくであり、価格がこれらの重要な領域を下抜けすると、トレンドの短期的ま​​たは長期的な反転の兆候です。 特徴 重要な枯渇点での市場構造の変化を警告します 価格が使い果たされるレベルに近づくと、
Matrix Arrow Indicator MT5
Juvenille Emperor Limited
5 (14)
マトリックスアローインジケーターMT5は、すべてのシンボル/商品(外国為替、商品、暗号通貨、インデックス、株式)で使用できる100%再描画されていないマルチタイムフレームインジケーターに続くユニークな10in1トレンドです。マトリックスアローインジケーターMT5は、初期段階で現在のトレンドを判断し、最大10の標準インジケーターから情報とデータを収集します。 平均方向移動指数(ADX) 商品チャネルインデックス(CCI) クラシック平研アシキャンドル 移動平均 移動平均収束発散(MACD) 相対活力指数(RVI) 相対力指数(RSI) 放物線SAR ストキャスティクス ウィリアムズのパーセント範囲 すべてのインジケーターが有効な買いまたは売りシグナルを与えると、対応する矢印がチャートに印刷され、次のろうそく/バーの開始時に強い上昇トレンド/下降トレンドを示します。ユーザーは、使用するインジケーターを選択し、各インジケーターのパラメーターを個別に調整できます。マトリックスアローインジケーターMT5は選択されたインディケーターからのみ情報を収集し、それらのデータのみに基づいてアローを印
Step into the realm of Forex trading with confidence and precision using XQ, a cutting-edge Forex indicator designed to elevate your trading game to unprecedented heights. Whether you're a seasoned trader or just stepping into the world of currency exchange, XQ Forex Indicator empowers you with the insights and signals needed to make informed trading decisions. The signal conditions are a combination of three indicators, and XQ Forex Indicator only display  medium and long-term trends . The ind
Auto Order Block with break of structure based on ICT and Smart Money Concepts (SMC) Futures Break of Structure ( BoS )             Order block ( OB )            Higher time frame Order block / Point of Interest ( POI )    shown on current chart           Fair value Gap ( FVG ) / Imbalance   -  MTF      ( Multi Time Frame )    HH/LL/HL/LH  -  MTF      ( Multi Time Frame )  Choch  MTF      ( Multi Time Frame )  Volume Imbalance     ,  MTF          vIMB Gap’s Power of 3 Equal High
現在33%オフ 初心者にもエキスパートトレーダーにも最適なソリューション このインジケーターは独自の機能と新しい公式を多数内蔵しており、ユニークで高品質かつ手頃な取引ツールです。このアップデートでは、2つの時間枠ゾーンを表示できるようになります。より長いTFだけでなく、チャートTFとより長いTF(ネストゾーンを表示)の両方を表示できます。すべてのSupply Demandトレーダーの皆さんのお気に召すはずです。:) 重要情報の公開 Advanced Supply Demandの可能性を最大化するには、 https://www.mql5.com/ja/blogs/post/720245 にアクセスしてください。   エントリーまたはターゲットの正確なトリガーポイントを正確に特定できれば取引がどのように改善されるか想像してみてください。新しい基盤となるアルゴリズムに基づいて構築されているため、買い手と売り手の間の潜在的な不均衡をさらに簡単に特定できます。これは、最も強い需要と供給のゾーンと、過去のパフォーマンス(古いゾーンを表示)がグラフィカルに表現されるためです。これらの機能は、最適
今、147ドル(いくつかの更新後に499ドルに増加します) - 無制限のアカウント(PCSまたはMac) RelicusRoad ユーザー マニュアル + トレーニング ビデオ + プライベート Discord グループへのアクセス + VIP ステータス 市場の新しい見方 RelicusRoad は、外国為替、先物、暗号通貨、株式、および指数の世界で最も強力な取引インジケーターであり、トレーダーに収益を維持するために必要なすべての情報とツールを提供します。初心者から上級者まで、すべてのトレーダーが成功するためのテクニカル分析と取引計画を提供します。これは、将来の市場を予測するのに十分な情報を提供する重要な取引指標です。意味をなさないチャート上のいくつかの異なる指標ではなく、完全な解決策を信じています.これは、信号、矢印 + 価格アクション情報を表示するオールインワンのインジケーターで、他に類を見ない非常に正確です。 強力な AI に基づいて、RelicusRoad は不足している情報とツールを提供して、あなたを教育し、トレーディングのプロ、成功したトレーダーにします。
TPA True Price Action indicator reveals the true price action of the market makers through 100% non-repainting signals strictly at the close of a candle! TPA shows entries and re-entries, every time the bulls are definitely stronger than the bears and vice versa. Not to confuse with red/green candles. The shift of power gets confirmed at the earliest stage and is ONE exit strategy of several. There are available now two free parts of the TPA User Guide for our customers. The first "The Basics"
AW Trend Predictor MT5
AW Trading Software Limited
4.78 (58)
1 つのシステムでのトレンド レベルとブレイクダウン レベルの組み合わせ。高度なインジケーター アルゴリズムは、市場のノイズをフィルター処理し、トレンド、エントリー ポイント、および可能なエグジット レベルを決定します。インジケーターシグナルは統計モジュールに記録されるため、最適なツールを選択してシグナル履歴の有効性を示すことができます。この指標は、テイクプロフィットとストップロスのマークを計算します。 マニュアルと説明書 ->   ここ / MT4 バージョン ->   ここ インジケーターで取引する方法: Trend Predictor での取引は、たった 3 つの簡単なステップです。 ステップ 1 - ポジションを開く 70% 以上の成功率で買いシグナルが受信されました ステップ 2 - ストップロスの決定 逆信号でトランクを選択 ステップ 3 - テイクプロフィット戦略の定義 戦略 1: TP1 に到達したらポジション全体をクローズする 戦略 2: TP1 に達した時点でポジションの 50% をクローズし、TP2 に達した時点で残りの 50% をクローズします。 戦略 3:
Dark Absolute Trend   is an Indicator for intraday trading. This Indicator is based on   Trend Following  strategy but use also candlestick patterns and Volatility. We can enter in good price with this Indicator, in order to follow the main trend on the current instrument. It is advised to use low spread ECN brokers. This Indicator does   Not repaint   and   N ot lag . Recommended timeframes are M5, M15 and H1. Recommended working pairs: All. I nstallation and  Update Guide   -  Troubleshooting
Easy By Sell is a market indicator for opening and closing positions. It becomes easy to track market entries with alerts. It indicates trend reversal points when a price reaches extreme values ​​and the most favorable time to enter the market. it is as effective as a Fibonacci to find a level but it uses different tools such as an algorithm based on ATR indicators and Stochastic Oscillator. You can modify these two parameters as you wish to adapt the settings to the desired period. My othe
このダッシュボードは、選択されたシンボルの最新の利用可能なハーモニックパターンを表示するので、時間を節約し、より効率的に /   MT4バージョン 。 無料インジケーター:   Basic Harmonic Pattern インジケーター列 Symbol : 選択したシンボルが表示されます。 Trend :   強気または弱気 Pattern : パターンの種類(ガートレー、バタフライ、バット、カニ、サメ、サイファー、ABCD) Entry : エントリー価格 SL: ストップロス価格 TP1: 1回目の利食い価格 TP2: 2回目の利食い価格 TP3:   3回目の利食い価格 Current price :   現在値 Age (in bars):    最後に描画されたパターンの年齢 主な入力項目 Symbols:   "28 Major Currency Pairs "または "Selected Symbols "から選択。 Selected Symbols:   カンマで区切られた監視したいシンボル("EURUSD,GBPUSD,XAUUSD")。ブローカーが
Was: $249  Now: $99   Market Profile defines a number of day types that can help the trader to determine market behaviour. A key feature is the Value Area, representing the range of price action where 70% of trading took place. Understanding the Value Area can give traders valuable insight into market direction and establish the higher odds trade. It is an excellent addition to any system you may be using. Inspired by Jim Dalton’s book “Mind Over Markets”, this indicator is designed to suit the
ICT(情報通信技術)、SMC(スマートマネーコンセプト)、サポートとレジスタンス、トレンド分析、価格アクション、市場構造、オーダーブロック、ブレーカーブロック、モメンタムシフト、強い不均衡、HH/LL/HL/LH、公正な価値ギャップ、FVG、プレミアム&ディスカウントゾーン、フィボナッチリトレースメント、OTE、バイサイド流動性、セルサイド流動性、流動性の空白、市場セッション、NDOG、NWOG、シルバーバレット、ICTテンプレート 金融市場では、正確な市場分析は投資家にとって重要です。市場のトレンドや流動性をより良く理解するために、高度な市場分析のためのユーザーマニュアルを提供しています。以下は、いくつかの機能とその実装方法の簡単な紹介です: 1. 高時間枠の市場構造の表示:    パラメータを設定することで、チャート上に高時間枠の市場構造を表示することができます。これにより、全体的な市場のトレンドと構造をより良く理解することができます。必要に応じて時間枠をカスタマイズし、市場構造をチャート上に表示することができます。 2. 流動性の表示:    流動性は市場
IX Powerは 、FX Powerの無敵の精度をついにFX以外のシンボルにも提供します。 お気に入りの指数、株式、コモディティ、ETF、さらには暗号通貨の短期、中期、長期のトレンドの強さを正確に判断します。 お使いの端末が提供する すべてを分析する ことができます。ぜひお試しいただき、取引 タイミングが大幅に改善 されることをご体験ください。 IXパワーの主な特徴 100%正確で再描画されない計算結果 - ターミナルで利用可能なすべての取引シンボルに対して 予め設定され、さらに個別に設定可能な強度分析期間のドロップダウン選択 Eメール、メッセージ、モバイル通知による無数の通知オプション EAリクエストのためのアクセス可能なバッファ カスタマイズ可能な計算制限により、さらに優れたパフォーマンスを実現 もっと見たい人のための特別なマルチインスタンス設定 すべてのチャートでお好みの色を無限に設定可能 Windows 11とmacOSのスタイルで角を丸くした新しいパネルデザイン サブ・ウィンドウとメイン・チャートの間をシームレスに移動する、魔法のように動くイン
作者のその他のプロダクト
!!! Current price of $30 will be soon increased to $50, so if you want to get a discounted price this is your last chance !!! Look at the screenshots to see how profitable this Expert Advisor is!!! This expert advisor has six types of moving average to choose and a powerful custom optimization metric so you can find the best systems with low stagnation and high net profit for any asset. You enter the position long when bar opens above Moving Average Line and reverse it (close the buy and open a
SuperTrend Fit for low Stagnation [Expert Advisor] !!! Current price of $30 will be soon increased to $50, so if you want to get a discounted price this is your last chance !!! Look at the screenshots to see how profitable this Expert Advisor is!!! This expert advisor uses the Supertrend indicator with an powerful custom optimization metric to help you find the best systems with low stagnation and high net profit. You enter the position long when bar opens above ST indicator and reverse i
Percent Above Below Moving Average low Stagnation [MT4 MT5 Expert Advisor] !!! Current price of $30 will be soon increased to $50, so if you want to get a discounted price this is your last chance !!! Look at the screenshots to see how profitable this Expert Advisor is!!! This expert advisor enters a position when the price moves a percentage distance from a moving average with an powerful custom optimization metric to help you find the best systems with low stagnation and high net profit.
This expert trading tool utilizes two Supertrend indicator lines, one for trend (slow) and the other as entry triggers (fast), with a powerful custom optimization metric to help traders find the best systems with low stagnation and high net profit. Long Entry: Traders enter a long position when the bar opens above the ST Line Slow and the current bar opens above the ST Line Fast. Long Exit: The current bar crosses down the ST Line Fast. Short Entry: Traders enter a short position when the bar op
!!! Current price of $30 will be soon increased to $50, so if you want to get a discounted price this is your last chance !!! Look at the screenshots to see how profitable this Expert Advisor is!!! This expert advisor trades when MACD cross the signal line with a custom optimization metric so you can find the best systems with low stagnation and high net profit for any asset. In addition to the optimization metric you can select acceptance criteria as minimum number of trades and payoff of a tr
!!! Current price of $30 will be soon increased to $50, so if you want to get a discounted price this is your last chance !!! Look at the screenshots to see how profitable this Expert Advisor is!!! The Three (or Triple) Moving Average Trading system uses three moving averages, a short, a medium and long period. Trades long when the short moving average cross up the medium moving average and the medium moving average is higher than the long moving average. When the short moving average cross dow
このエキスパートトレーディングツールは、スーパートレンド指標を強力なカスタム最適化メトリックと組み合わせ、低い停滞と高い純利益を持つ最適なシステムをトレーダーに見つけるために利用されます。 トレーダーは、バーが指標ラインの上または下に開くときにポジション(ロングまたはショート)を入れます。価格がシグナルを「反転」する場合はポジションを退出できます。リスクに基づいて(利益確定、ストップロス)、またはセッション終了時に退出してクローズさせることもできます。その他の機能には、価格の割合で利益確定やストップロスを設定することができること、トレードをより細かく制御するためのエントリーとクロージングの時間を設定できることが含まれます。さらに、1日あたりのトレード回数に制限を設け、定義された利益が得られたときにのみトレーリングストップが開始される機能もあります。 株式、CFD指数、暗号通貨、外国為替に適した価格の割合で利益確定やストップロスを設定してリスクを制御できます。さらに、エントリーとクロージングの時間を設定して、トレードをより細かく制御できます。カスタム最適化メトリックにより、高いCA
!!! Current price of $30 will be soon increased to $50, so if you want to get a discounted price this is your last chance !!! Look at the screenshots to see how profitable this Expert Advisor is!!! This expert advisor has nine types of moving average to choose and a powerful custom optimization metric so you can find the best systems with low stagnation and high net profit for any asset. You enter the position long when bar opens above Moving Average Line and reverse it (close the buy and open
Are you looking for a powerful expert advisor that can help you find the best trading systems with low stagnation and high net profit? Look no further than this expert advisor, which enters a position when the price moves a percentage distance from a moving average. With a variety of moving averages available, including the Simple Moving Average (SMA), Exponential Moving Average (EMA), Smoothed Moving Average (SMMA), Linear Weighted Moving Average (LWMA), Linear Regression Moving Average, and Hu
This expert trading tool utilizes the MACD signal as a trigger, with an optional moving average to confirm the signal. 8 custom fitness function optimization metrics are included to help traders find the best systems with low stagnation and high net profit for any asset. In addition to the optimization metrics, traders can select acceptance criteria such as a minimum number of trades and payoff of a trading system. Expert advisor rules Long entry: MACD line crosses the Signal line upward; [optio
Introducing an expert advisor that uses two Supertrend indicator lines, ST Fast as entry trigger and ST Slow to trade in direction of the trend. This expert advisor is designed to help you find the best systems with low stagnation and high net profit, using a powerful custom optimization metric. The Supertrend indicator is a popular trend-following indicator that helps traders identify the direction of the trend and make trades accordingly. With this expert advisor, you'll be able to use the ST
強力なケルトナー チャネル RSI EA で利益を最大化 - カスタム最適化メトリクスを備えたエキスパート アドバイザー ケルトナー チャネル RSI EA のご紹介。ケルトナー チャネルと RSI シグナルを使用してさまざまな方法で取引できるエキスパート アドバイザーです。 ケルトナー チャネルは、ボラティリティと平均トゥルー レンジに基づいて、価格アクションの上下のバンドをプロットするテクニカル指標です。 RSIは、最近の価格履歴と比較して、資産の価格行動の強さを測定するモメンタム指標です。 ケルトナー チャネル シグナルを使用すると、上下のバンドの上または下で開くバーに基づいて取引を入力できます。 さらに、RSIシグナルを使用すると、RSIの上昇または下降、レベルラインの交差、または方向の変化に基づいて取引を開始できます. エキスパートアドバイザーは、ロングトレードのみ、ショートトレードのみ、またはロングとショートのトレード、1日あたりのトレード数の制限(サイドごと)、テイクプロフィット、%としての固定またはトレーリングストップロス、セッショントレード時間の制限など、さ
「Three Moving Averages Pro」をご紹介します。このストラテジーは、パワフルなカスタム最適化指標を用いた移動平均線を使用した戦略のコレクションであり、低い停滞率と高い純利益を持つ最良の取引システムを見つけるのに役立ちます。 このストラテジーは、2つのエントリー条件と1つの出口条件を使用して、精度と正確性を持って取引を実行します。さまざまなオプションを使用することで、異なる移動平均線の上または下のバーのオープニングにエントリーポジションを設定したり、異なる方向にクロスする移動平均線など、収益性の高い取引を行うために必要なすべてのコントロールを持つことができます。 利益リスクをコントロールするには、テイクプロフィットとストップロスを価格のパーセンテージとして設定することができます。さらに、エントリーとクロージングの時間を設定して、取引に対する追加のコントロールを行うこともできます。カスタム最適化指標を使用することで、トレーダーは高いCAGRと低いドローダウン、低い停滞率を持つシステムを見つけることができます。 「Three Moving Averages Pro」の最
高度なトリガーオプションを備えたトゥルーレンジ強度インジケーター このインジケーターは、日々の価格変動に関連するさまざまな指標を計算および表示します: 指標 トゥルーレンジ (TR): (高値 - 安値, |高値 - 前日終値|, |安値 - 前日終値|) の最大値 TR 変動率 (TR_ROC): 日々の参考価格に対する TR の変動率 ポジティブ TR ROC の日計合計: 1日のポジティブ TR ROC 値の累積 ネガティブ TR ROC の日計合計: 1日のネガティブ TR ROC 値の累積 ポジティブおよびネガティブ TR ROC の日計合計の差: TR ROC の純累積 使用法 インジケーターを別のチャートウィンドウに追加します 入力から希望するプロットタイプ、値タイプ、およびトリガータイプを選択します インジケーターを使用して日々のボラティリティと価格変動の傾向を評価します カラーヒストグラムは純累積トレンドの迅速な視覚的リファレンスを提供します 注: このインジケーターは毎取引日の始めに計算をリセットします
高低強度インジケーター 概要 高低強度インジケーター は、日中の新しい高値と安値がどのくらい頻繁に発生するかを 監視および表示するために設計された強力なツールであり、ピークとトラフとしても知られています。 または、高値と安値の頻度を追跡します。このインジケーターは、市場のトレンドや潜在的な反転を強調し、 市場分析や取引戦略を強化したいと考える投資家、日中のトレーダー、クオンツトレーダーにとって不可欠なツールです。 主な機能 このインジケーターは、「Count New Daily Highs and Lows」と「Count Highs and Lows」の2つの異なる方法で動作します。 「Count New Daily Highs and Lows」モードでは、日中の新しい高値と安値を追跡し、毎日の市場のピークとトラフに関する洞察を提供します。 「Count Highs and Lows」モードでは、現在の期間内の高値と安値をカウントして、即時の価格アクション分析を行います。各モードは、Cumulative Highs、 Cumulative Lows、および High Low
フィルタ:
レビューなし
レビューに返信
バージョン 240.715 2024.07.15
Input to choose 2 methods for the calculation of the "Body Size Strength":
- Body Size
- Body Size ROC