Insight Pro MT4
- インディケータ
- Nikola Pocuca
- バージョン: 1.0
- アクティベーション: 10
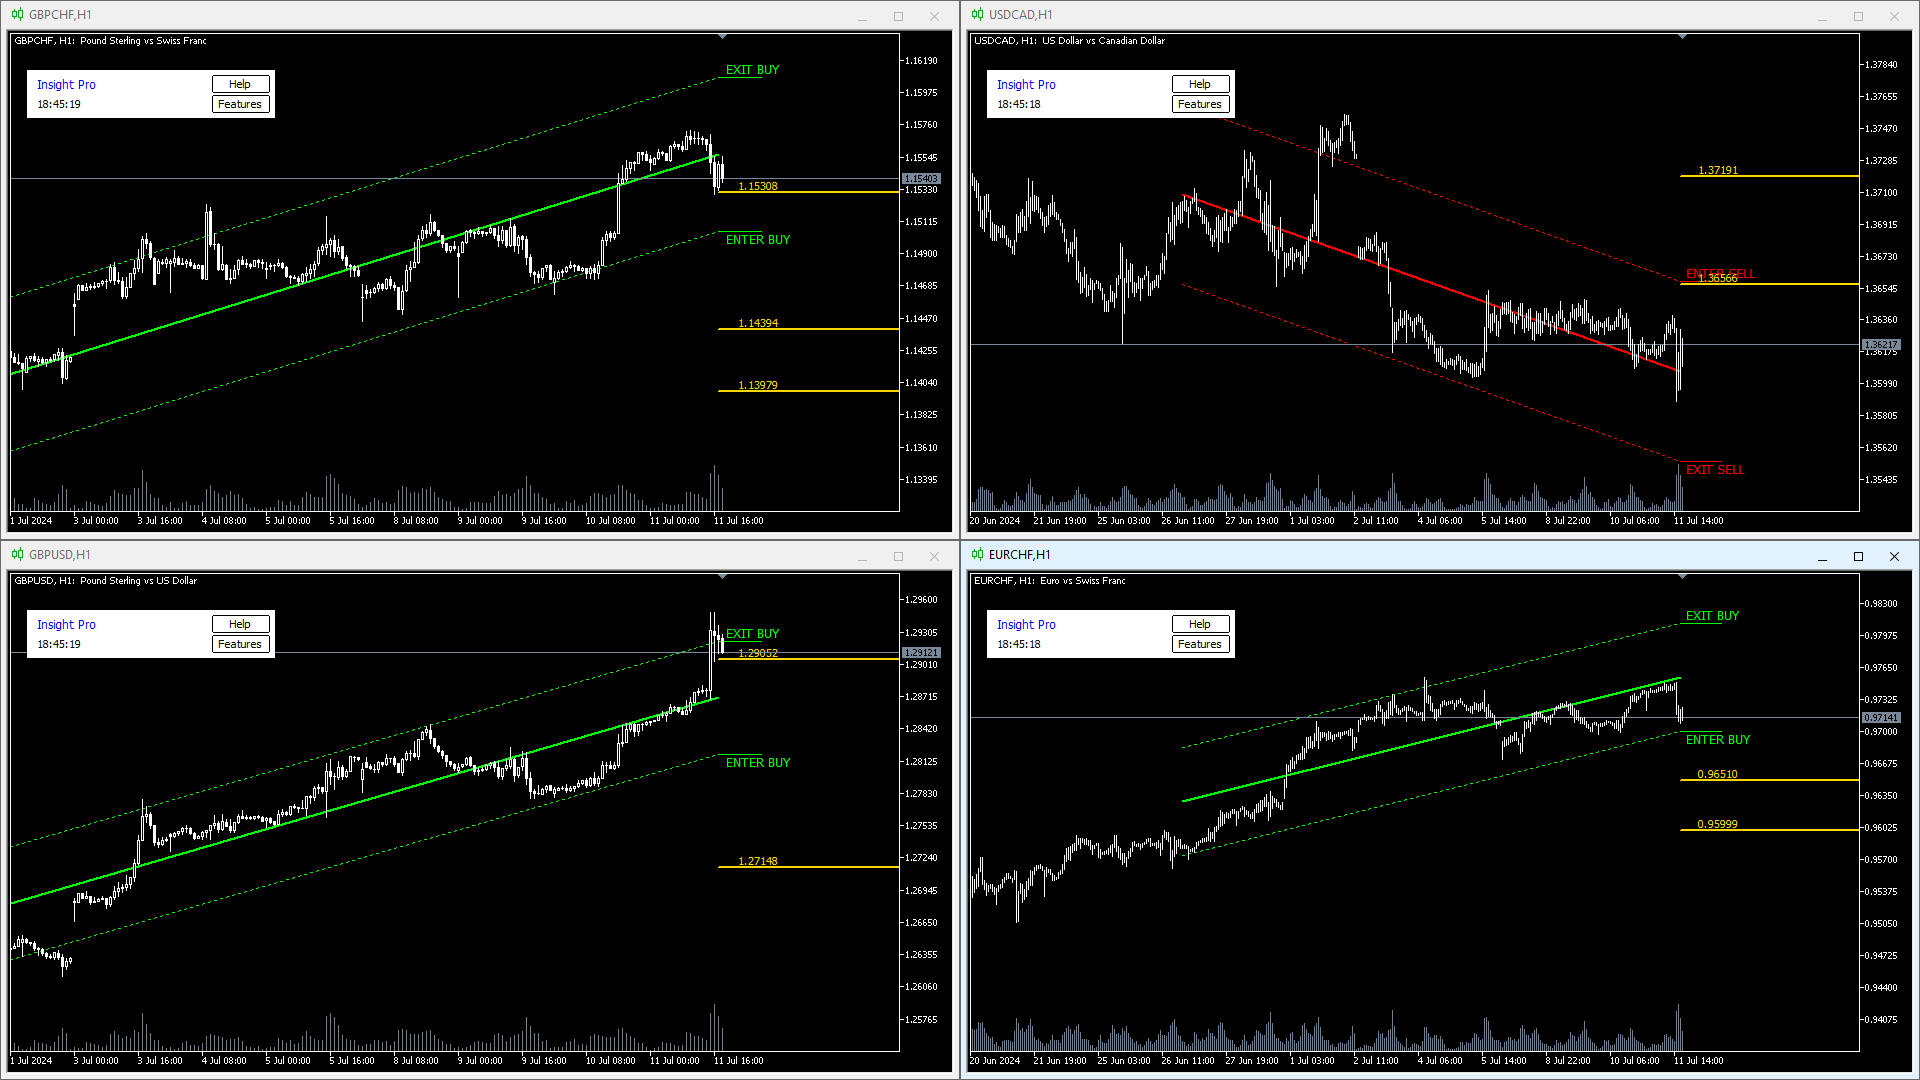
The Insight Pro is a versatile tool designed for comprehensive data analysis. It offers detailed insights into market trends with features such as distribution analysis, resistance and support levels, and trend analysis. This advanced indicator is perfect for both novice and experienced traders, providing a wide array of analysis tools in a single, user-friendly package.
Features:
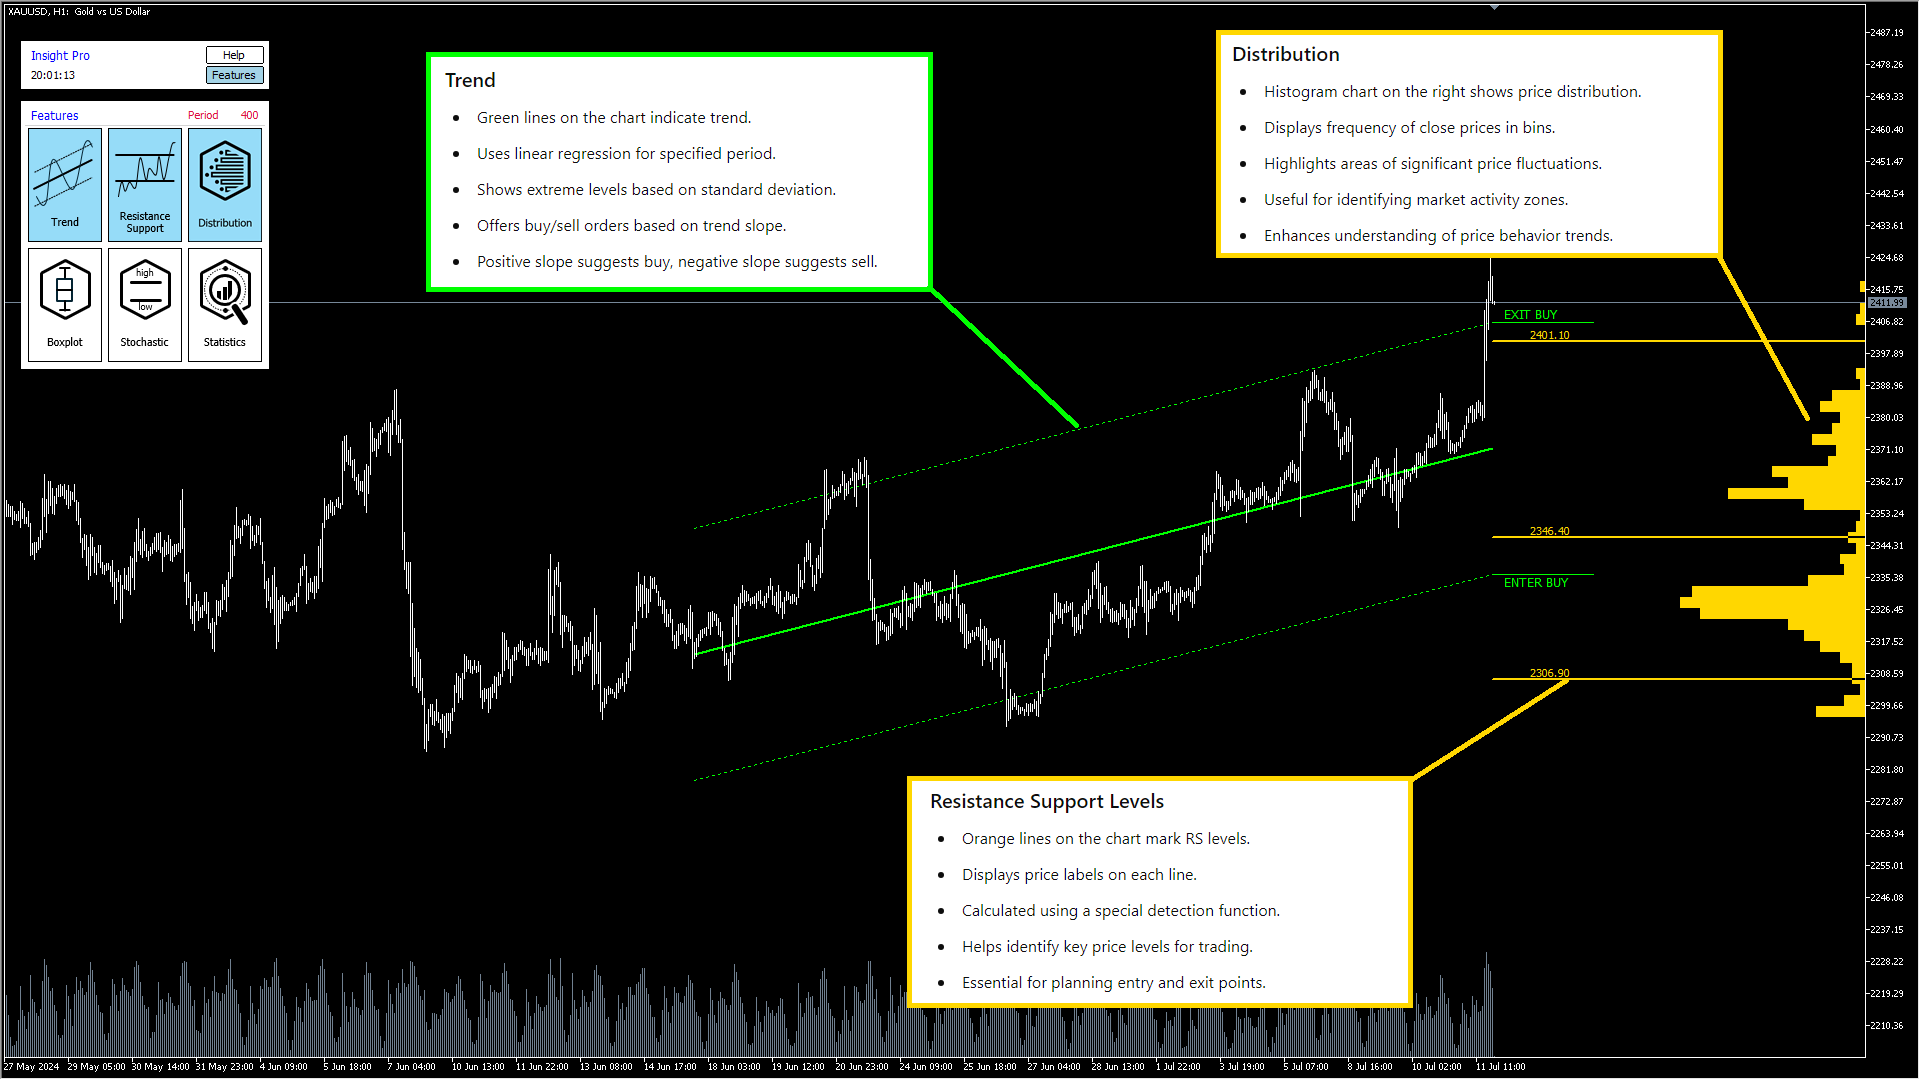
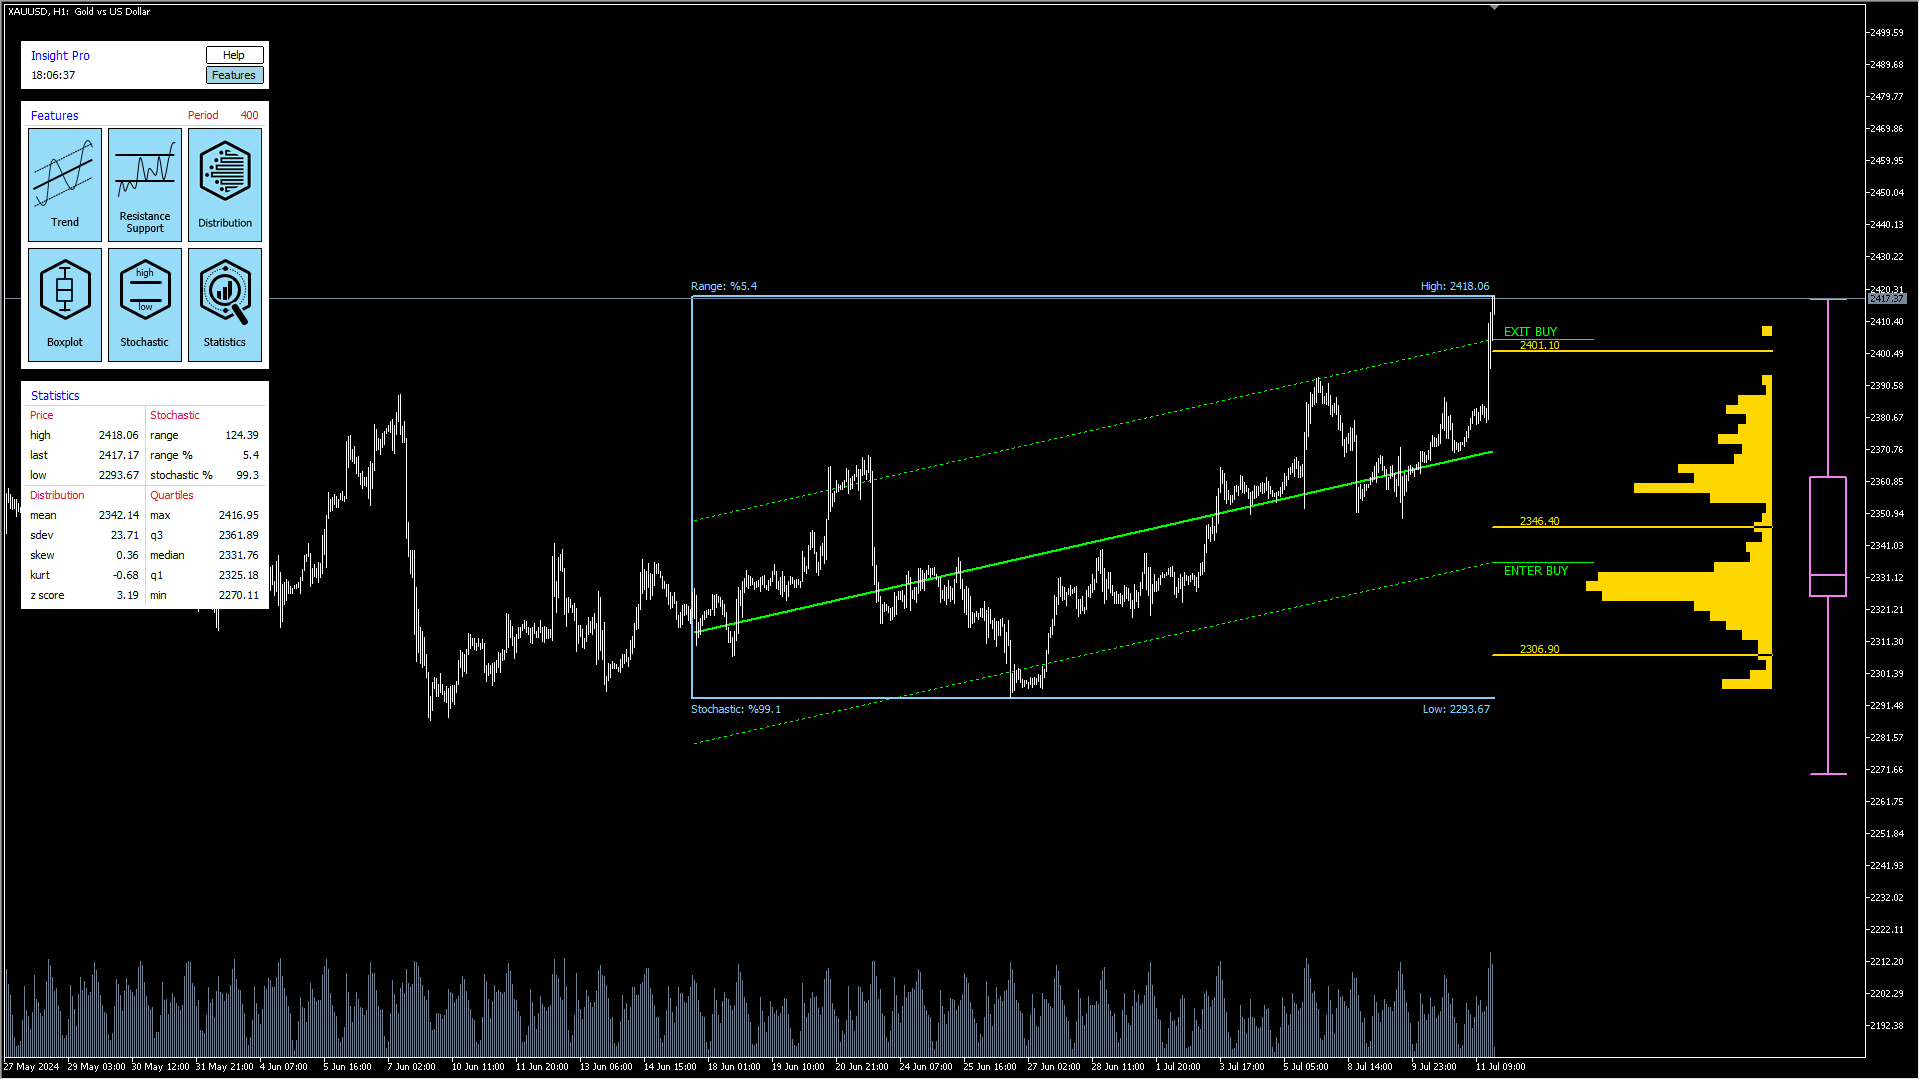
Trend Analysis:
- Detects and visualizes market trends with precision.
- Includes an order suggestion system indicating potential entry and exit points based on detected trends.
- Displays trend lines with customizable colors and widths, offering a clear market direction overview.
- Shows extreme levels based on standard deviation, aiding in precise market analysis.
- Positive slope suggests buy orders, negative slope suggests sell orders.
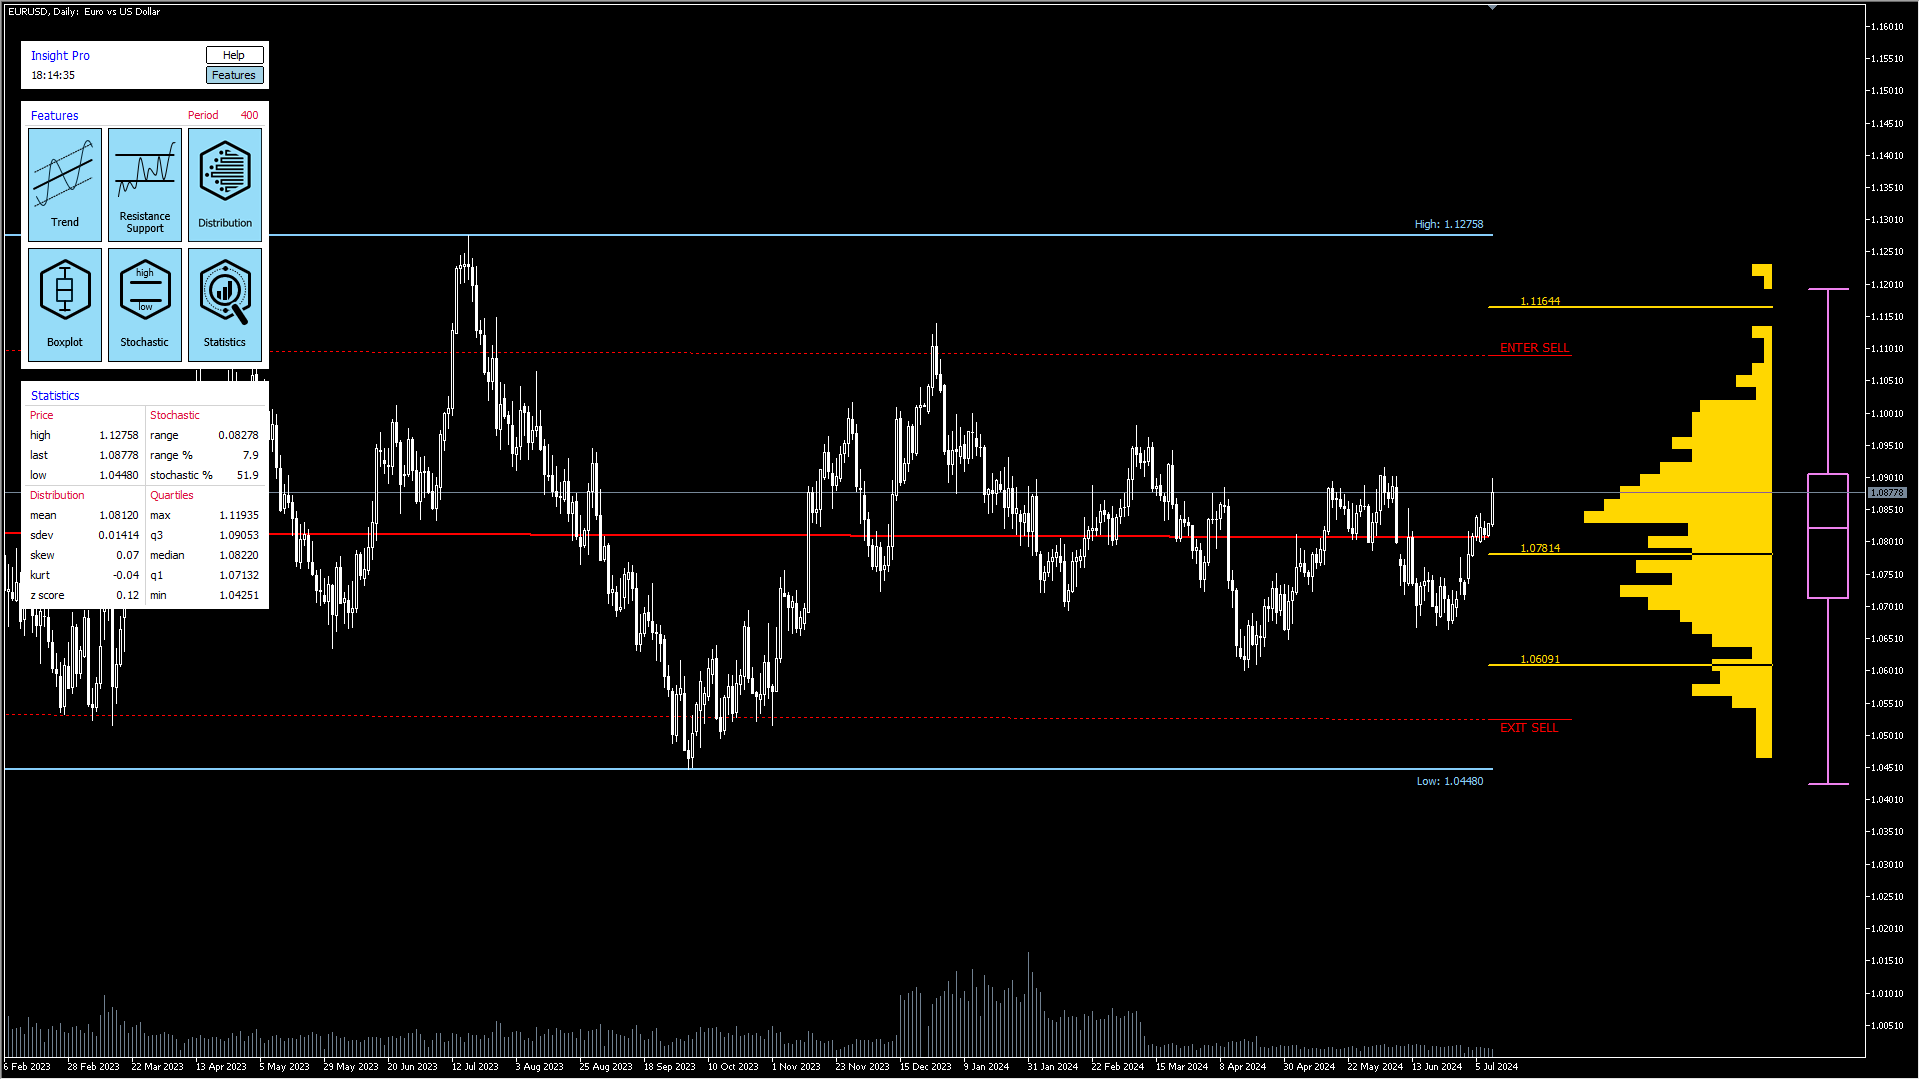
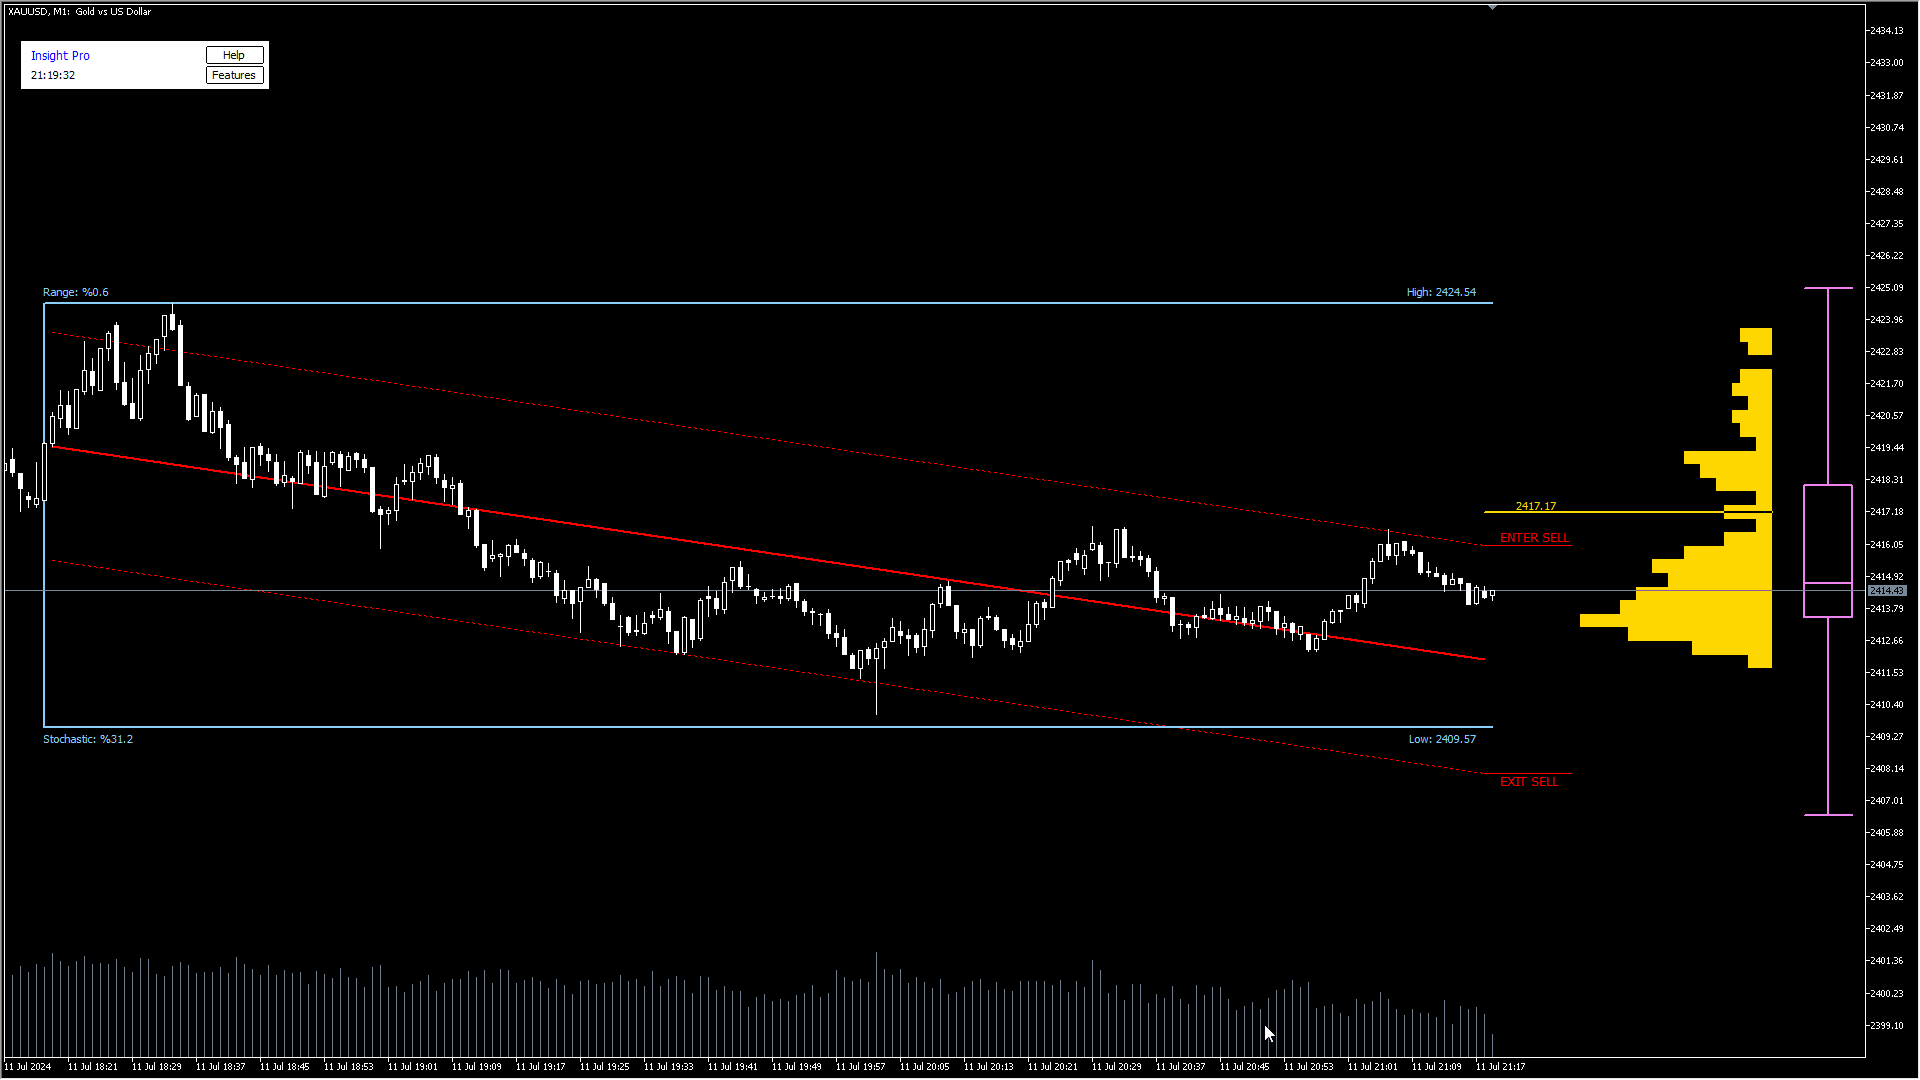
Resistance and Support Levels:
- Identifies key price levels where the market tends to reverse.
- Uses a density parameter to control the number of levels displayed.
- Displays price labels on each level for easy identification.
- Historical levels provide a comprehensive view of market behavior.
- Essential for planning strategic entry and exit points.
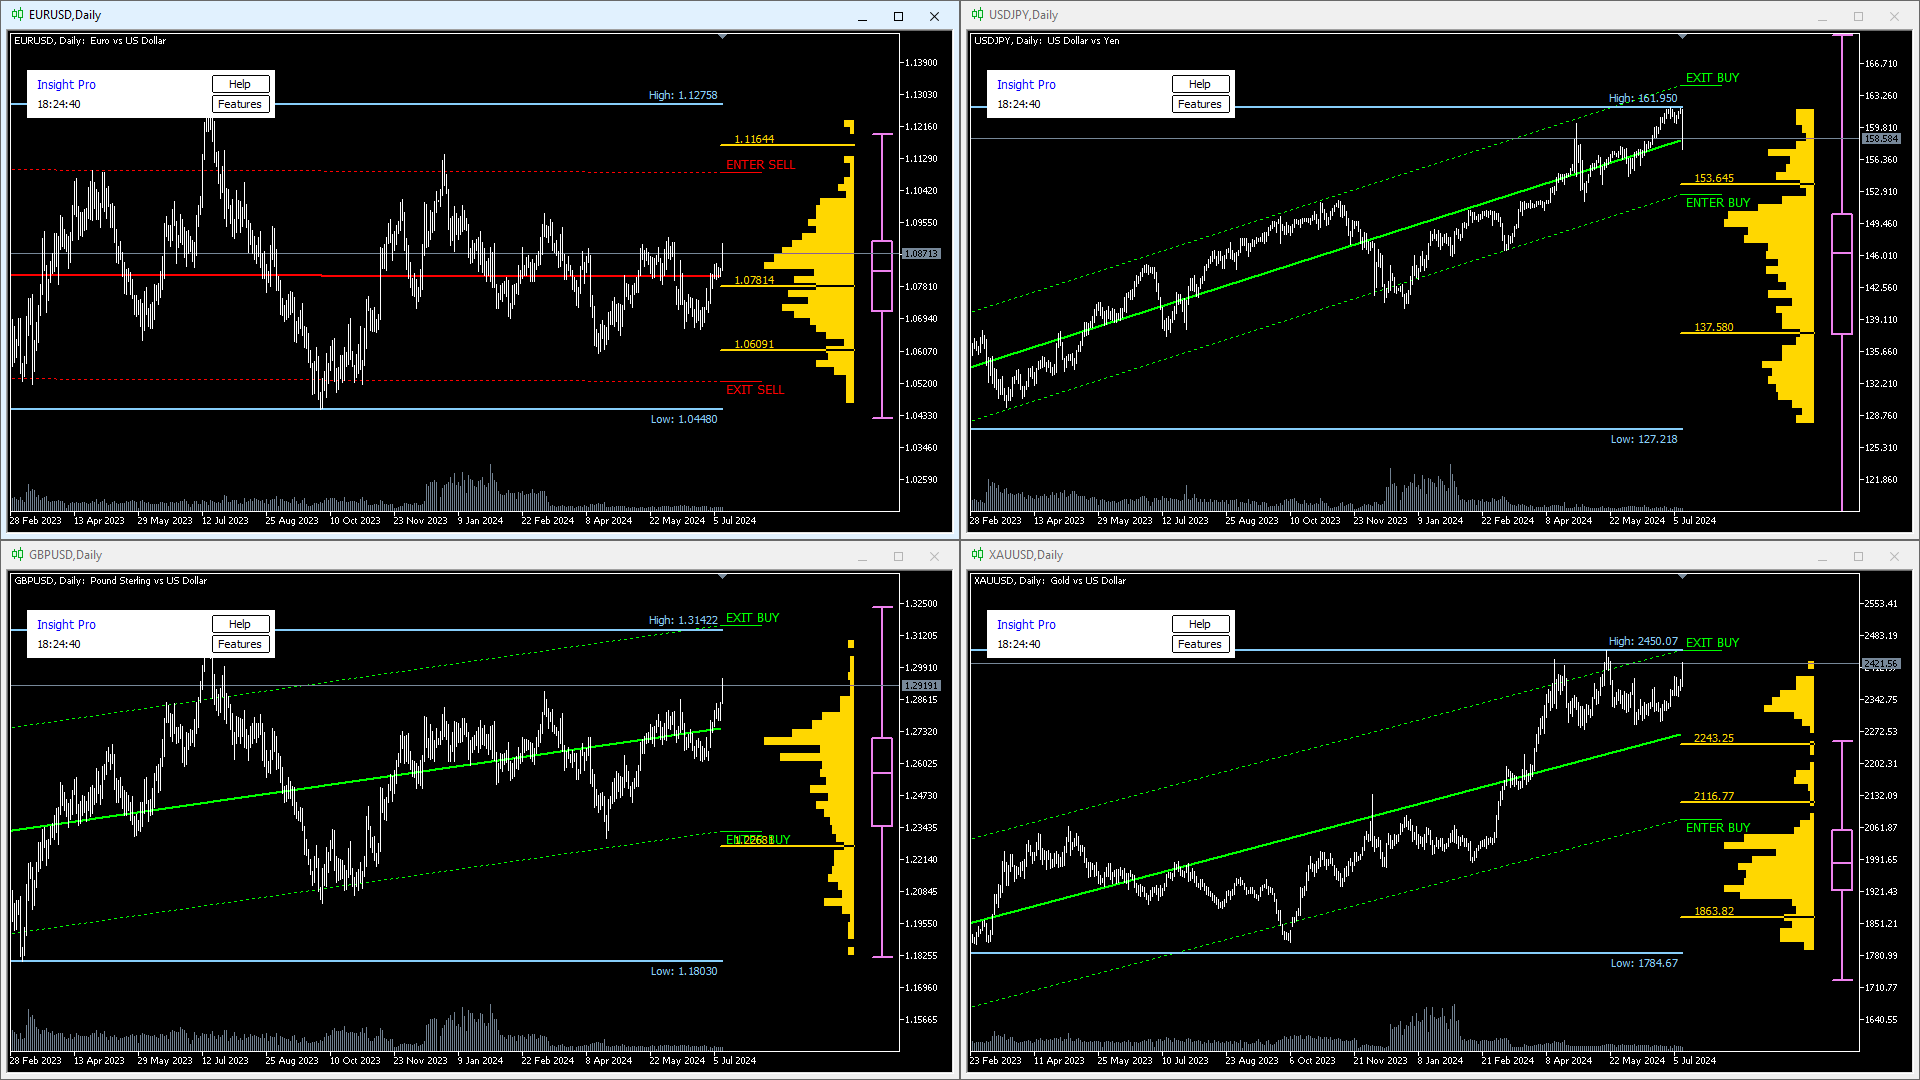
Distribution Analysis:
- Provides a detailed analysis of price distribution over a specified period.
- Creates a histogram of price movements to understand price fluctuation frequencies.
- Highlights areas of significant price consolidation and potential breakout points.
- Visualizes where prices are most likely to move.
- Enhances traders' ability to predict market movements.
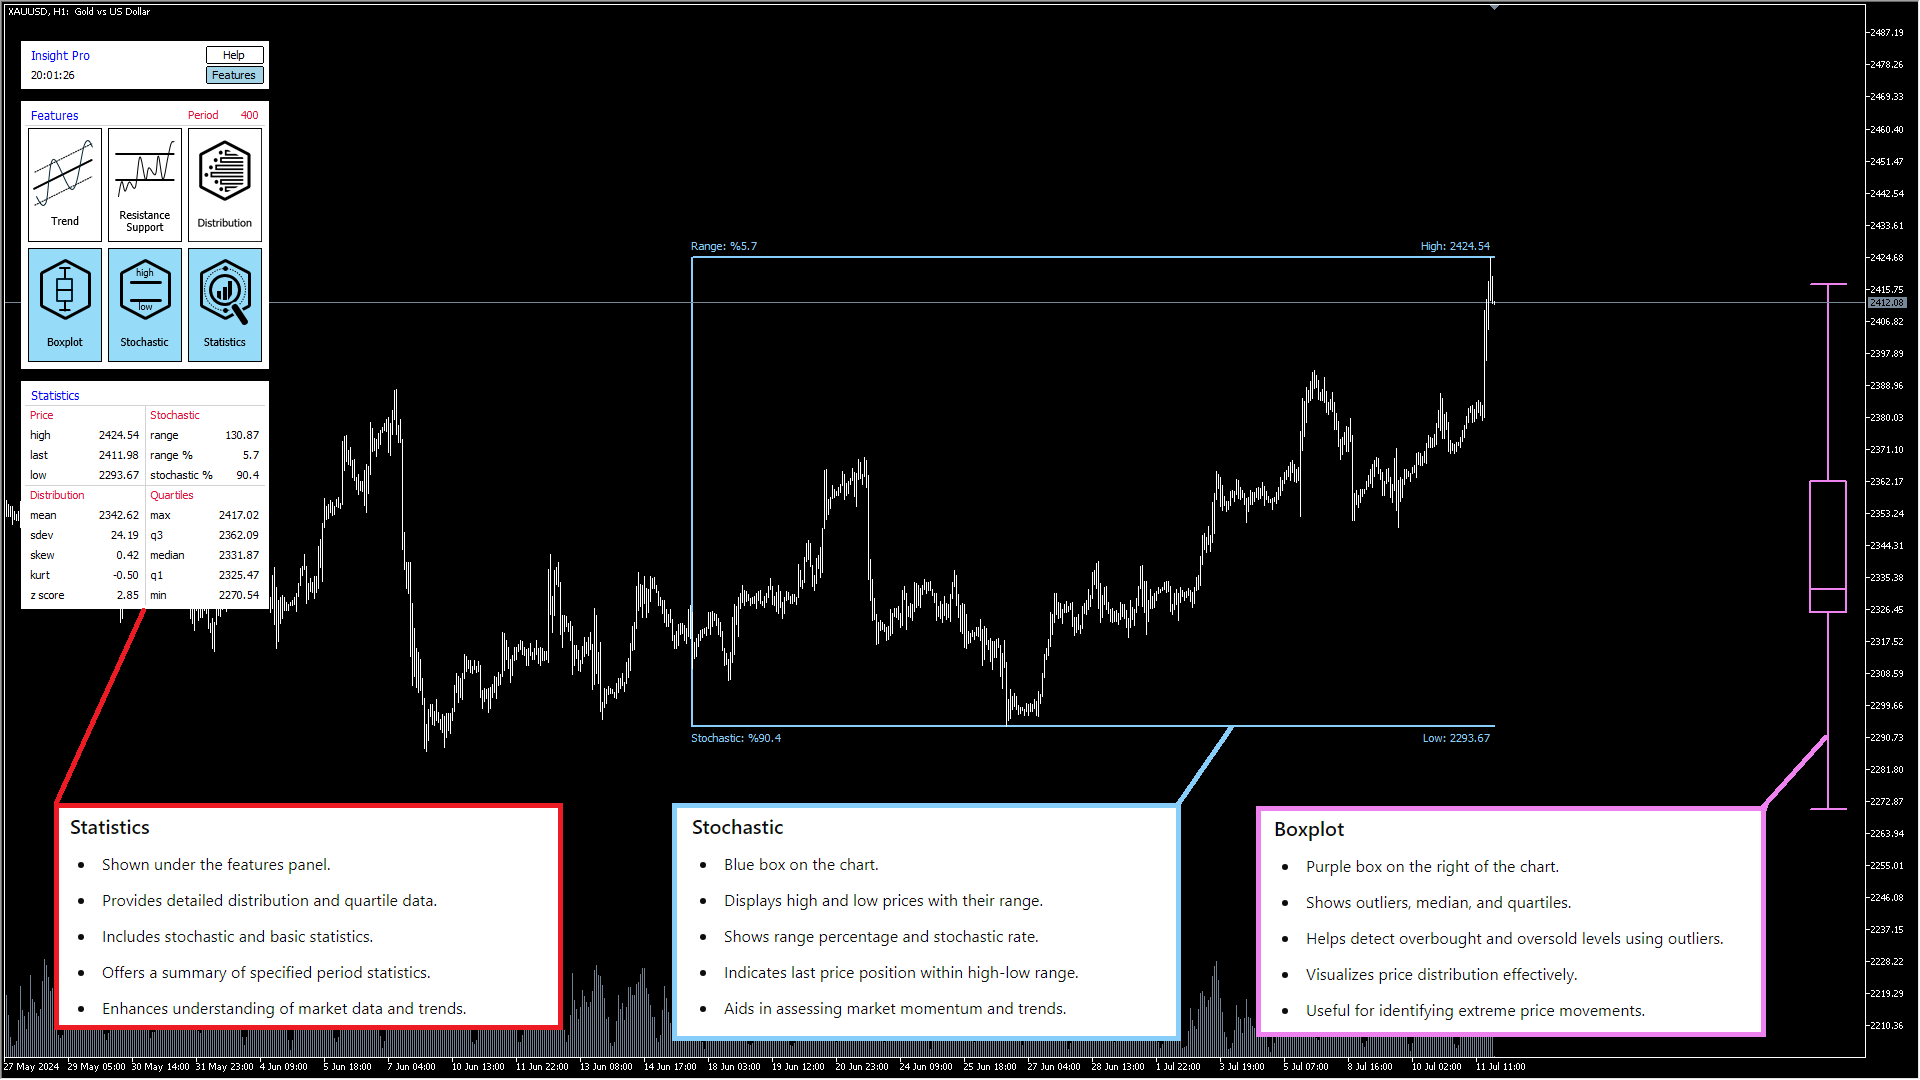
Boxplot Analysis:
- Visualizes statistical distribution of price data.
- Includes whiskers to show the range, a box for interquartile range, and a line for the median.
- Helps detect outliers and overbought/oversold levels using outliers.
- Quickly identifies extreme price movements.
- Offers a clear understanding of overall price distribution.
Stochastic Analysis:
- Provides detailed information about high and low levels over a specified period.
- Displays range percentage and stochastic rate.
- Indicates last price position within the high-low range.
- Helps assess market momentum and potential reversal points.
- Identifies overbought and oversold conditions for informed trading decisions.
Statistical Analysis:
- Performs advanced statistical analysis on price data.
- Includes calculations for mean, standard deviation, skewness, kurtosis, and z-score.
- Offers detailed distribution and quartile data.
- Provides a summary of specified period statistics.
- Essential for deeper analysis of market behavior.
Input Parameters:
Calculation:
• Period: Specifies the number of bars used for calculation. Default is 400.
• Trend Extreme Level: Defines the threshold for detecting extreme trend levels. Default is 2.0.
• Resistance Support Density: Controls the density of resistance and support levels displayed. Options include Less/Normal/More.
Features:
• Trend: Enable or disable the trend analysis feature. Options are On/Off.
• Resistance Support: Enable or disable the resistance and support levels feature. Options are On/Off.
• Distribution: Enable or disable the distribution analysis feature. Options are On/Off.
• Boxplot: Enable or disable the boxplot analysis feature. Options are On/Off.
• Stochastic: Enable or disable the stochastic analysis feature. Options are On/Off.
• Statistics: Enable or disable the statistical analysis feature. Options are On/Off.
Properties:
• Show Trend Order Suggestion: Display trend order suggestions on the chart. Options are On/Off.
• Show Trend Forecast: Display forecasted trend lines extending to the right. Options are On/Off.
• Show Resistance Level on History: If On, resistance and support levels will be displayed across the entire chart from left to right. If Off, they will be shown as short lines to the right of the current price. Options are On/Off.
Colors:
• Theme: Select the color theme for the indicator. Options include Dark/Light.
• Up Trend Color: Color for the uptrend lines.
• Down Trend Color: Color for the downtrend lines.
• Resistance Support Color: Color for resistance and support lines.
• Distribution Color (inpClrDistribution): Color for distribution analysis visualization.
• Boxplot Color (inpClrBoxplot): Color for boxplot visualization.
• Stochastic Color (inpClrStochastic): Color for stochastic analysis visualization.
• Width of Lines (inpLineWidth): Specifies the width of the lines drawn by the indicator. Options include 1 to 5. Default is 2.
Recommendations:
• Timeframes: The Insight Pro works well on all timeframes. For trend analysis, longer timeframes (H1 and above) are recommended.
• Markets: This indicator is versatile and can be used on various markets, including forex, commodities, indices, and cryptocurrencies.
• Accounts: It is suitable for all account types.
• Colors and Themes: Customize the colors and themes according to your preference for better visibility and clarity.
• Combining Features: Use the combination of trend, resistance and support, and distribution analysis to get a comprehensive view of the market.
The Insight Pro is your ultimate companion for market analysis, combining advanced features with a user-friendly interface to help you make informed trading decisions. Unlock the full potential of your trading strategy with Insight Pro.