Support and Resistance Malaysian
- インディケータ
- Pierre Paul Amoussou
- バージョン: 1.0
- アクティベーション: 5
Support and Resistance Malaysianは、サポートとレジスタンスの水準をチャート上に表示するカスタムインジケーターです。これらの水準は、マレーシアのSNR理論に基づいています。この理論では、水準は特定の価格水準を指し、エリアではありません。これらの価格水準は、ラインチャートのピークと谷に基づいています。
特徴:
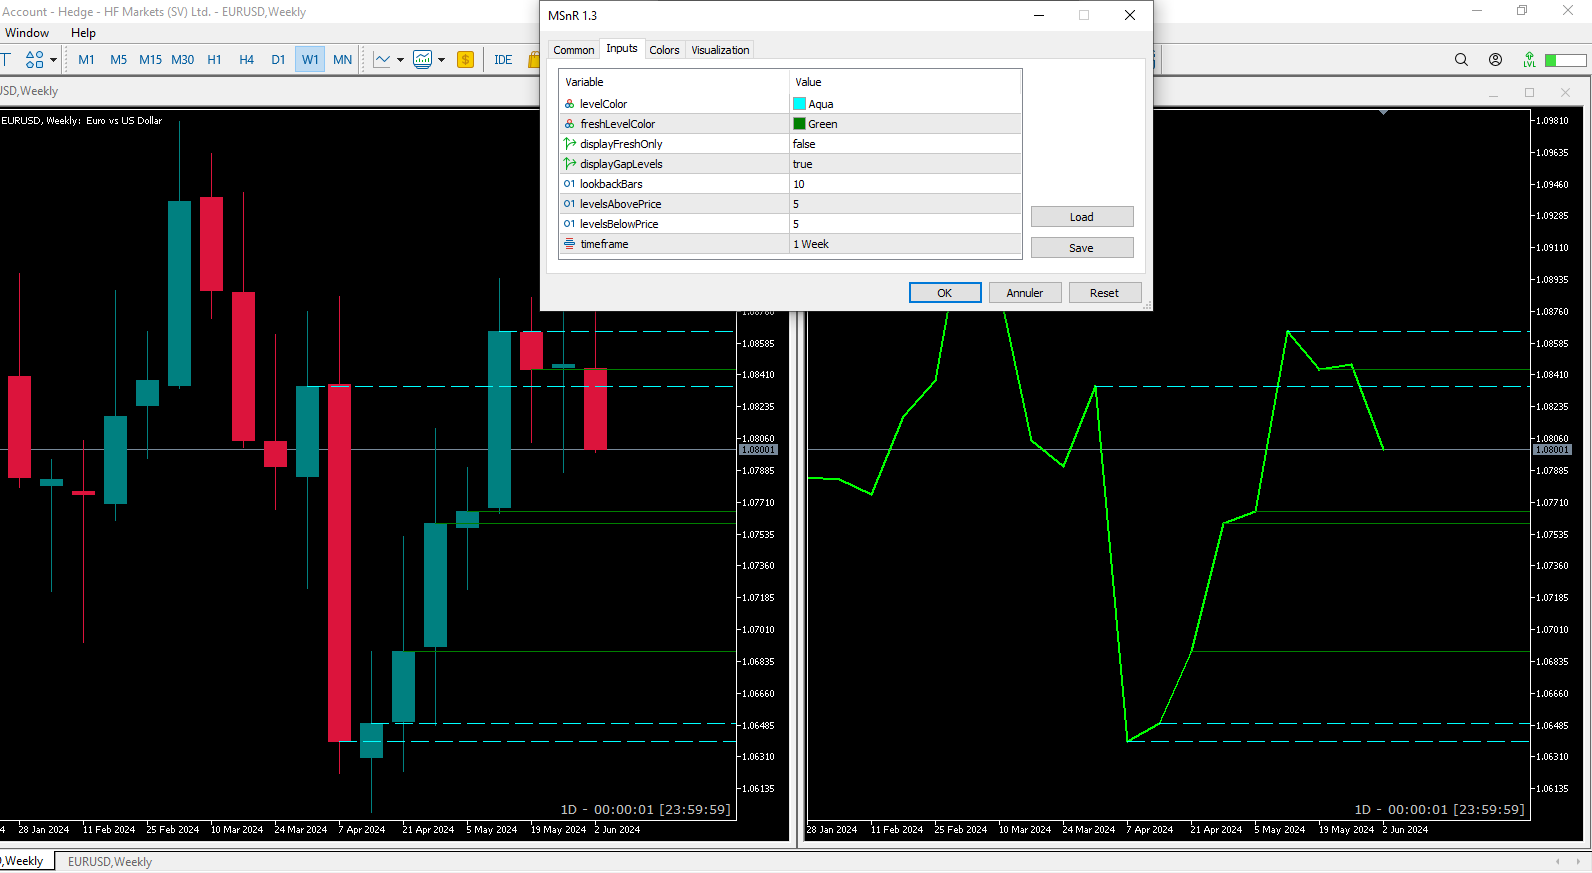
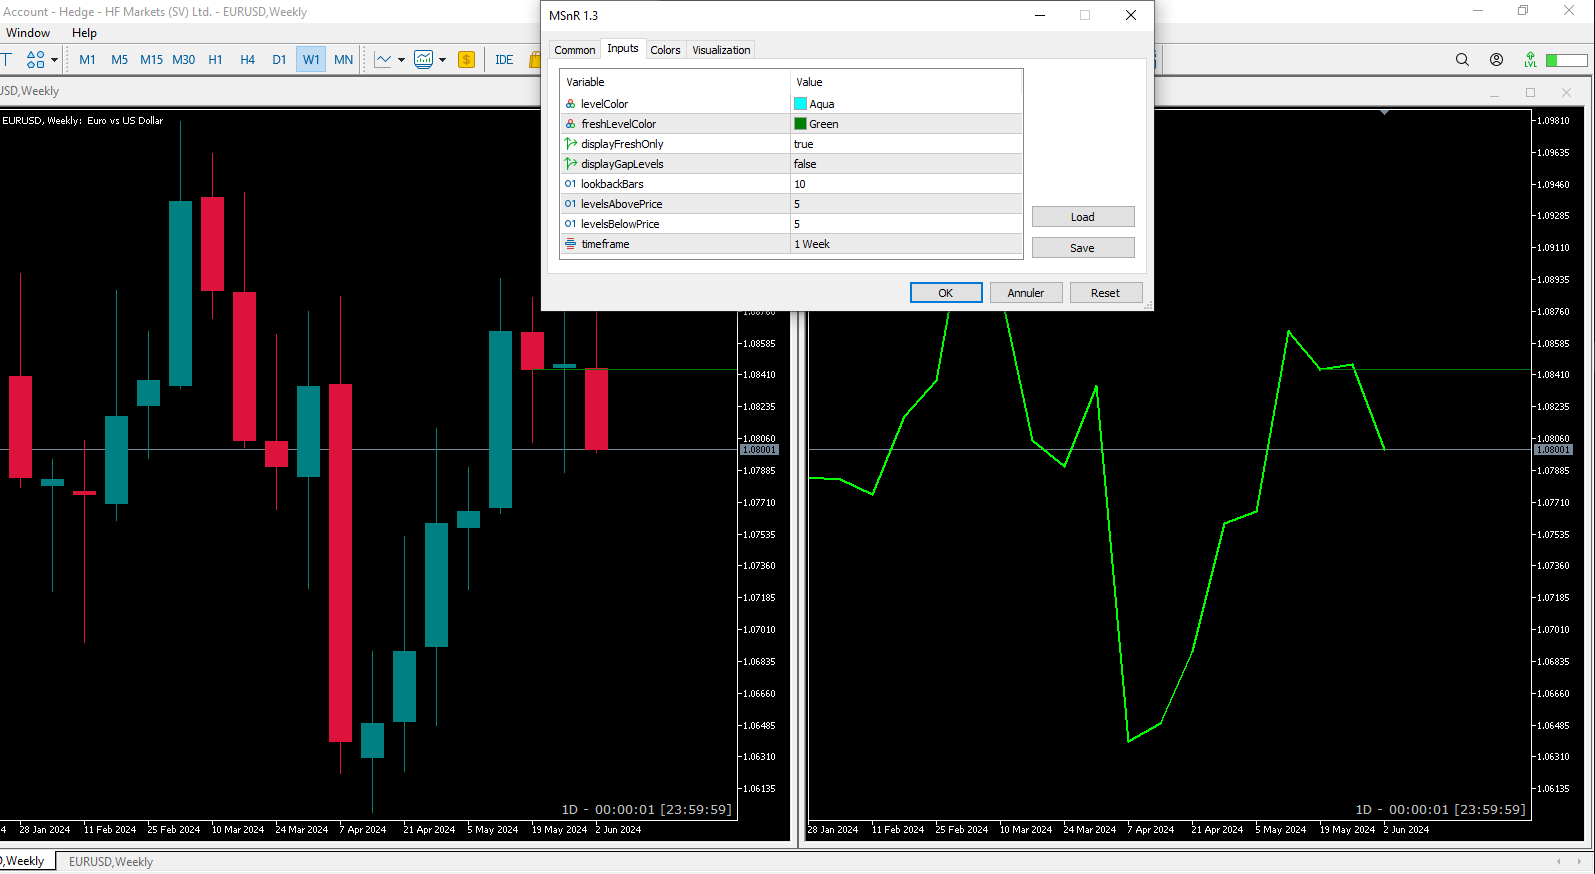
- A-Level、V-Level、ギャップレベルの3つの種類の水準。
- 水準の新鮮さインジケータ:新鮮な水準は、未テストの水準や取引された水準よりも重要です。
- 新鮮な水準と新鮮でない水準の色とスタイルをカスタマイズ可能。
- 新鮮な水準のみを表示するか、すべての水準を表示するかを選択できます。
- バックテスト期間と現在の価格上下の水準の数を調整可能。
- 複数のタイムフレームをサポート。
用途:
トレーダーは、MSnR Linesを使用して潜在的なサポートとレジスタンスの水準を識別し、取引の意思決定を行うことができます。新鮮な水準はより重要であり、より良い取引機会を提供する可能性があります。また、異なるタイムフレームの水準を使用してマルチタイムフレーム分析を行い、取引の精度と信頼性を向上させることができます。