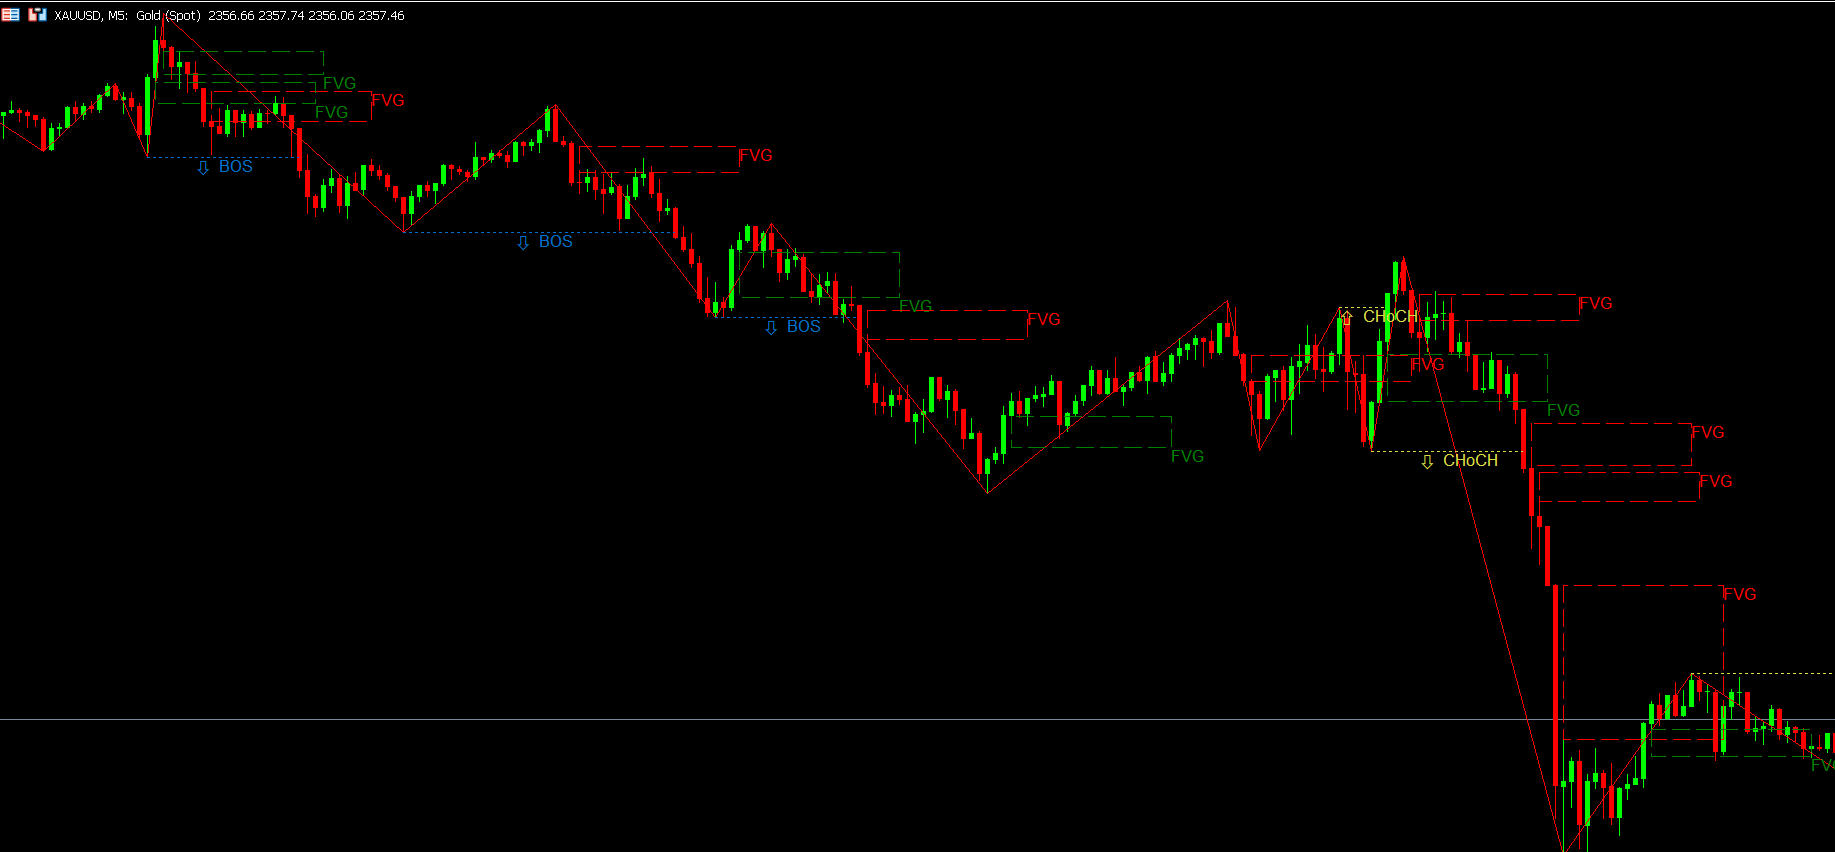
BOS CHoCH and FVG
- インディケータ
- Saksham Solanki
- バージョン: 1.2
- アップデート済み: 17 7月 2024
- アクティベーション: 5
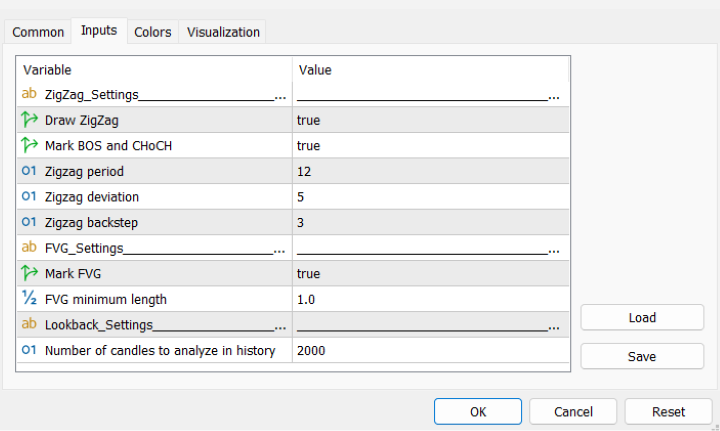
Key Features:
- Pattern Recognition:
- Identifies Fair Value Gaps (FVGs)
- Spots Break of Structure (BOS) points
- Detects Change of Character (CHoCH) patterns
- Versatile Application:
- Optimized for candlestick charts
- Compatible with any chart type and financial instrument
- Real-Time and Historical Analysis:
- Works seamlessly with both real-time and historical data
- Allows for backtesting strategies and live market analysis
- Visual Representation:
- Draws rectangles to highlight significant areas on the chart
- Labels BOS and CHoCH patterns with clear lines for easy identification
- Standalone Functionality:
- Operates as an independent tool, easily integrated into your existing trading setup
- User-Friendly Interface:
- Intuitive design for traders of all experience levels
- Clear visual cues to quickly interpret market structures
This indicator serves as your advanced assistant in technical analysis, helping you identify potential trading opportunities across various timeframes and market conditions. By clearly marking FVGs, BOS points, and CHoCH patterns, it provides valuable insights into market structure and potential trend changes, empowering you to make more strategic trading decisions.