• 概要
  • レビュー
  • コメント

GO Trend MultiTimeFrame

GoTrend Multi-Timeframe インディケーター

"GoTrend Multi-Timeframe" インディケーターは、異なる時間枠で通貨ペアの全体的および特定のトレンドを迅速かつ効率的に評価するためのトレーダーにとって必須のツールです。

このインディケーターは、トレーダーが市場の方向性を一目で明確かつ包括的に把握し、意思決定を最適化し、取引戦略の効果を高めることを可能にします。

主な特徴:

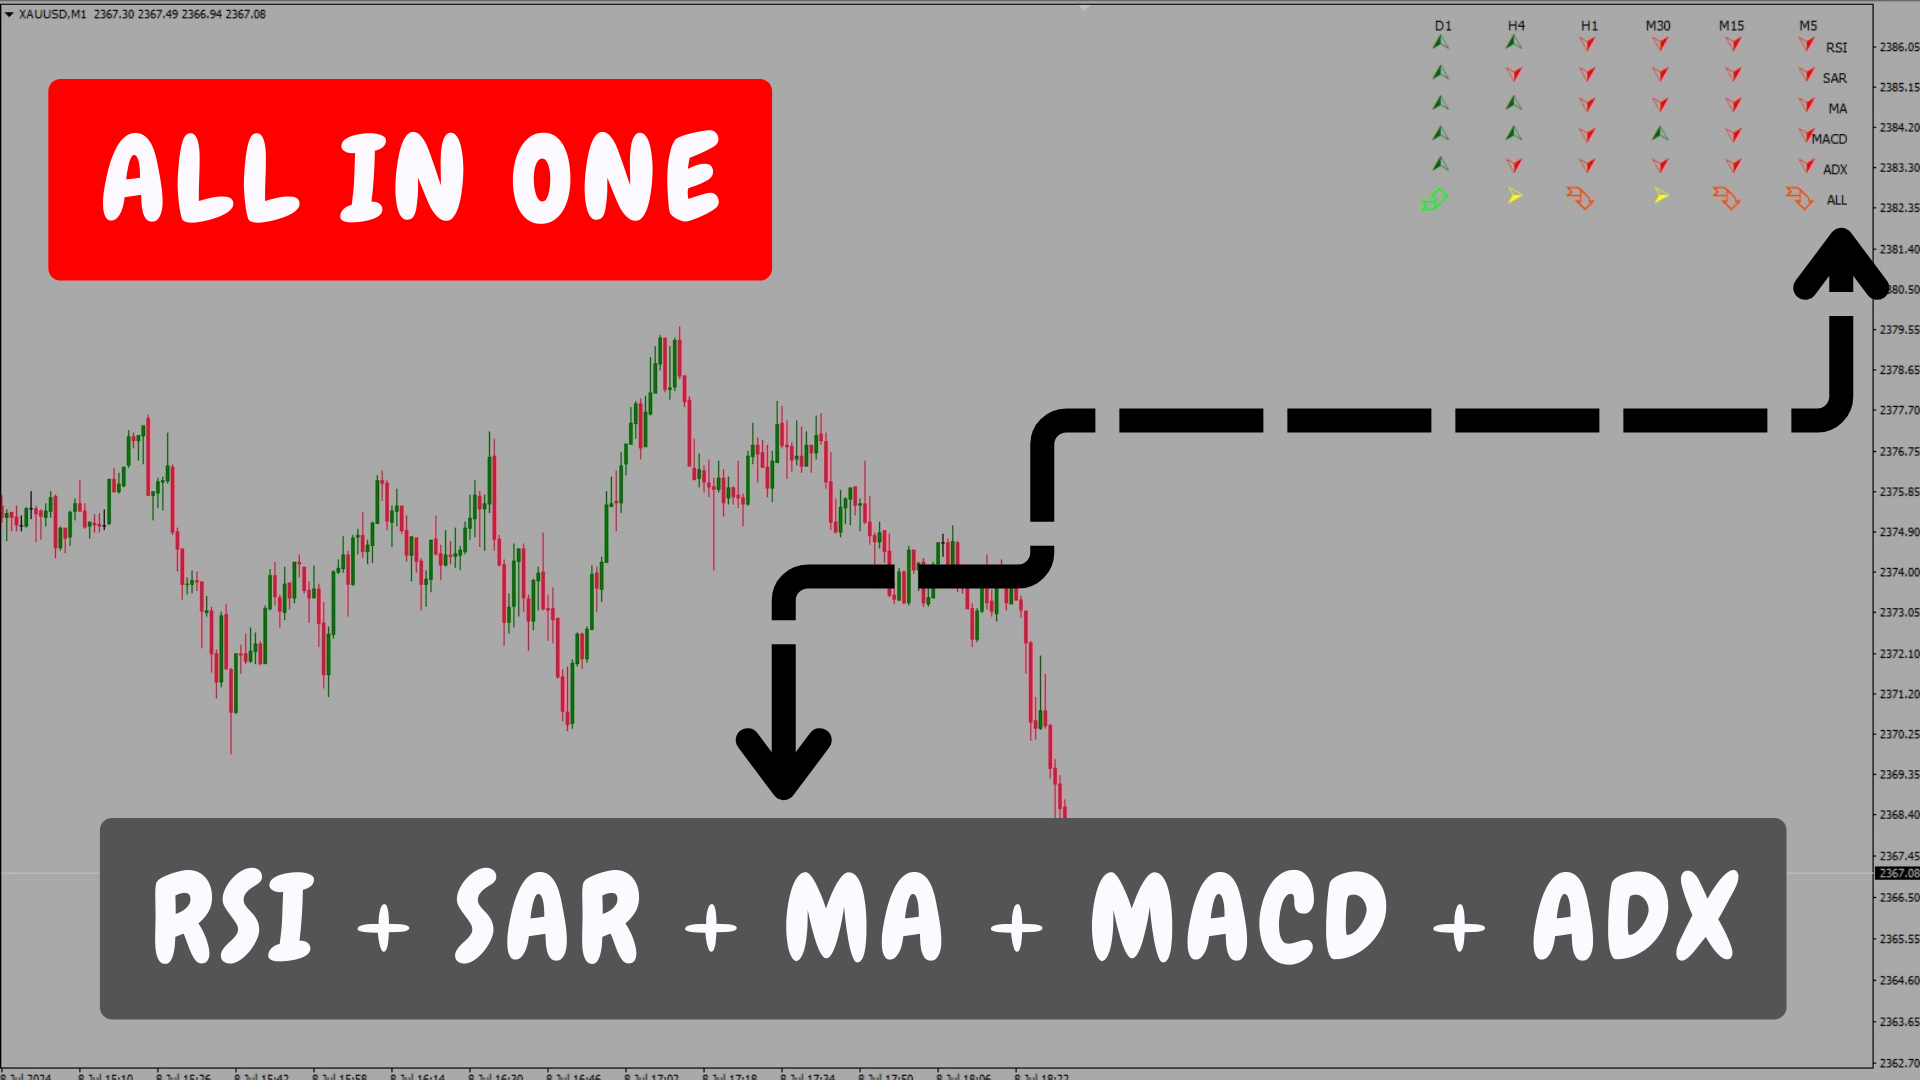
  • マルチタイムフレーム分析: このインディケーターは、M5、M15、M30、H1、H4、D1の6つの異なる時間枠の詳細な分析を提供し、トレーダーが各期間のトレンドを理解できるようにします。
  • 統合されたテクニカル指標: インディケーターは、RSI、SAR、MA、MACD、およびADXの5つの強力なテクニカル指標を使用して、各時間枠でのトレンド方向を決定します。
  • 明確で直感的な視覚化: 信号は、直感的なシンボルと色でメインチャートの選択したコーナーに表示されます。これにより、トレーダーは一目で市場の状況を評価できます。
  • 組み合わせ信号: 各指標の個別の信号に加えて、"GoTrend Multi-Timeframe" はそのペアの全体的な市場トレンドを要約する組み合わせ信号を提供します。

取引の利点:

  • 迅速かつ明確なトレンドの概観: このインディケーターを使用すると、トレーダーは複数の時間枠でトレンドの方向性を迅速かつ明確に把握でき、情報に基づいたタイムリーな決定を行うことが重要です。
  • エントリーポイントとエグジットポイントの最適化: 異なる時間枠での買いおよび売り信号は、トレーダーがエントリーおよびエグジットポイントを最適化し、取引の成功の可能性を高めるのに役立ちます。
  • 市場ノイズの減少: 複数の時間枠からのトレンド信号に焦点を当てることで、トレーダーは市場のノイズをフィルタリングし、誤ったエントリーを避けることができ、リスク管理を改善します。
  • 使いやすさ: インディケーターの設定は簡単で、結果は明確に表示されるため、初心者のトレーダーでも簡単に使用できます。

インディケーターの使用:

  • トレンドの評価: 取引決定を行う前に、トレーダーは6つの異なる時間枠でトレンドを確認できます。大多数の時間枠が買いまたは売り信号を示している場合、これは市場の方向性の堅実な確認を提供します。
  • エントリーおよびエグジット戦略: 最適なエントリーおよびエグジットポイントを特定するために個別の信号を使用します。たとえば、複数の時間枠での買い信号は、ロングポジションに入るのに良い時期を示しているかもしれません。
  • 取引管理: "ALL" の組み合わせ信号は、そのペアのトレンドの全体的なビューを提供し、トレーダーがトレンドの正しい方向でポジションを維持するか、全体的なトレンドと同じ方向で新しい取引を開くのに役立ちます。

インディケーターの設定:

  • チャートの位置: インディケーターは、カスタマイズ可能な間隔とシンボルのサイズ設定でメインチャートのコーナーに表示されます。
  • カスタマイズ可能な色: "買い," "売り" および "無信号" 信号の色は、トレーダーの視覚的な好みに合わせてカスタマイズできます。

アラームの制限:

このインディケーターにはアラームがなく、設計の柔軟性により、すべての種類の取引に適応します。これには、単一の時間枠、クロスタイムフレーム、または上位の時間枠を使用してトレンドを決定し、下位の時間枠でエントリーを探す取引が含まれます。固定アラームは、"GoTrend Multi-Timeframe" の多用途で適応的な性質には適していません。

"GoTrend Multi-Timeframe" は、意思決定を簡素化し、取引を最適化したいトレーダーにとって完璧なパートナーです。複数の時間枠での明確な視覚化と深いトレンド分析により、このインディケーターは、通貨ペアの状況を迅速に理解し、より正確な取引決定を行うために必要な情報を提供します。

入力パラメータの説明:

  • scaleX (値: 60): チャート上に表示される信号間の水平距離を定義します。この値は、アイコン間のスペースを調整して、明確で整理された視覚化を提供します。
  • scaleY (値: 25): チャート上に表示される信号間の垂直距離を定義します。この値は、重なりを避けて読みやすさを確保するためにアイコン間のスペースを調整します。
  • offSetX (値: 45): チャートの左端から最初の信号アイコンまでの水平距離を設定します。チャートの希望する位置に信号を配置できます。
  • offSetY (値: 20): チャートの上端から最初の信号アイコンまでの垂直距離を設定します。チャートの希望する位置に信号を配置できます。
  • fontSize (値: 15): 信号アイコンのフォントサイズ。この値は、チャート上でアイコンが表示される大きさを決定します。
  • corner (値: 2): 信号が配置されるチャートのコーナーを定義します。値は次のようになります:
    • 0: 左上角
    • 1: 右上角
    • 2: 左下角
    • 3: 右下角
  • symbolCodeBuy (値: 217): 買い信号を表すシンボルコード。このコードは "Wingdings" フォントの特定の文字に対応します。
  • symbolCodeSell (値: 218): 売り信号を表すシンボルコード。このコードは "Wingdings" フォントの特定の文字に対応します。
  • symbolCodeNoSignal (値: 216): 信号なしを表すシンボルコード。このコードは "Wingdings" フォントの特定の文字に対応します。
  • allBuy (値: 200): 組み合わせた買い信号を表すシンボルコード。このコードは "Wingdings" フォントの特定の文字に対応します。
  • allSell (値: 202): 組み合わせた売り信号を表すシンボルコード。このコードは "Wingdings" フォントの特定の文字に対応します。

信号の色:

  • signalBuyColor (強い上昇) - (色: DarkGreen): 強い買い信号を示すシンボルの色。
  • signalSellColor (強い下降) - (色: Red): 強い売り信号を示すシンボルの色。
  • noSignalColor (信号なし) - (色: Goldenrod): 信号なしを示すシンボルの色。
  • allSellColor (色: OrangeRed): 組み合わせた売り信号を示すシンボルの色。
  • allBuyColor (色: Lime): 組み合わせた買い信号を示すシンボルの色。
  • textColor (色: Black): 時間枠 (M5, M15, M30, H1, H4, D1) と指標名 (RSI, SAR, MA, MACD, ADX, ALL) を説明するテキストの色。

これらのパラメータは、各トレーダーが使用したいチャートの色に基づいて外観をカスタマイズすることを可能にします。


おすすめのプロダクト
PDP indicator is used for: defining price probability distributions. This allows for a detailed representation of the channel and its borders and forecast the probability of a price appearing at each segment of its fluctuations; defining the channel change moment. Operation principles and features PDP analyzes a quote history on lower timeframes and calculates a price probability distribution on higher ones. Forecast algorithms allow the indicator to calculate probability distributions and m
Time Levels
Yurij Izyumov
4.27 (11)
The indicator is designed for displaying the following price levels on the chart: Previous day's high and low. Previous week's high and low. Previous month's high and low. Each of the level types is customizable. In the indicator settings, you set line style, line color, enable or disable separate levels. The version of the exact same indicator but only with sound alerts there - Time Levels with Alerts . Configurations ----Day------------------------------------------------- DayLevels - enable
FREE
SSA stands for ' Singular Spectrum Analysis '. It combines elements of classical time series decomposition, statistics, multivariate geometry, dynamical systems and signal processing. SSA decomposes time series into a sum of components (ETs), with each component representing a lower smoothing, using several SVD ( Singular Value Decompositions ). It is a powerful filtering process used in many fields of research (climatology, biomedical, aerospace, etc), where high quality forecasting and smoo
Big Figure Indicator
Vonjinirina Alfred Randrianiaina
「BIG FIGURE INDICATOR」は、価格チャート上で整数や半分の数字(たとえば、通貨取引での1.0000や1.5000など)など特定のレベルで自動的に水平線を識別して描画します。これらのレベルは心理的に重要であると考えられており、大口トレーダーや投資家が注目する可能性がある丸められた数字を表しており、潜在的なサポートまたはレジスタンスレベルにつながります。ビッグフィギュアインジケーターは、トレーダーが重要な価格レベルを特定し、これらのレベルに基づいて取引決定を行うのに役立ちます。 ラインはM1からH4のタイムフレームチャートにのみ表示されます。 ラインの色は入力パラメータタブで変更できます。 すべての通貨ペアで使用できます。 MT5バージョン: https://www.mql5.com/fr/market/product/96750 注意:当社のインジケーターを最適に機能させるには、まずデイリー(D1)タイムフレームを読み込む必要があります
FREE
The Beautiful indicator shows potential market reversal points. The intelligent algorithm of the indicator detects the trend well, filters out market noise and generates input signals and exit levels. Uses just one parameter for settings. Simple, visual and efficient trend detection. The indicator does not redraw and does not lag. You can set up message alerts as sound or email. Works on all currency pairs and on all timeframes. Ready-made trading system.
MQLTrend
Mohammad Reza Aghaei
This tool helps you to control the situation at other times and include them in your trades when analyzing the market  This tool scans the market and reports the movement of the market at different times With the help of this tool, you can prevent many wrong analyzes With the help of this tool, you can have an overview of the market in the shortest time and save your time
FREE
OVERVIEW The Vector Candle Zones Render indicator automatically renders boxes for vector candle zones that are yet to be recovered. The indicator is an implementation of an existing PVA candles indicator. Combine it with PVSRA and MarketMakerMethod strategy. FEATURES Software: MetaTrader4 - MT4 - 600+ build Timeframes: Multi-Timeframe Markets: Forex/Cryptos/Energies/Bonds/Metals/Indices/Futures/Commodities Customizable style parameters: Change Color style Chan
MT Scanner
Niravkumar Maganbhai Patel
4 (3)
This indicator helps you to Scan symbols which are in the Market Watch Window  and filter out trends with alerts. It works based on the effective indicator "SUPERTREND" which is used by many traders for trading: When box color changes to " Green " or " Red " color, it indicates you for trend change for long and short entry. And also you will get alerted on screen. When it changes to " Green ", it indicates you that trend is going upwards, and you can take the long entry. If the color changes to
FREE
The indicator ignores sharp fluctuations and market noise and tracks market trends with absolute reliability. It is suitable for trading on small timeframes and on large ones, it ignores sudden price spikes or price movement corrections due to the reduction of market noise around the average price value. For calculations, the indicator uses indicators: iLow, iHigh, iMA, iATR. Since the output signal relies on reliable indicators, it is also reliable. You can configure both a sound signal and se
This indicator has been created for finding the probable reversal points of the symbol price. A small candlestick reversal pattern is used it its operation in conjunction with a filter of extremums. The indicator is not redrawn! If the extremum filter is disabled, the indicator shows all points that have a pattern. If the extremum filter is enabled, the condition works – if the history Previous bars 1 candles back contains higher candles and they are farther than the Previous bars 2 candle, such
FREE
Unveil the Secret to Trading with Joker's TrendMaster!  Ready to outperform the markets with a proven and reliable strategy? Look no further! Introducing Joker's TrendMaster, the revolutionary indicator crafted by Yuri Congia! With Joker's TrendMaster, you'll gain access to a powerful combination of advanced technical analysis and unique strategic insights. Limited-time Special Opportunity: Seize the moment! Be among the first 10 (Purchasing 1/10) to seize this unique opportunity, and not
FREE
Lisek Stochastic
Darius Hans Lischka
3 (7)
Lisek Stochastic   oscillator indicator with Alarm, Push Notifications and e-mail  Notifications. The Stochastic indicator is a momentum indicator that shows you how strong or weak the current trend is. It helps you identify overbought and oversold market conditions within a trend. The Stochastic indicator is lagging indicator, which means it don't predict where price is going, it is only providing data on where price has been !!! How to trade with Stochastic indicator: Trend following: As lon
FREE
The key difference between the Real Channel indicator and other channel indicators (for example, from the same Bollinger) is that the Real Channel takes into account not simple moving averages, but twice smoothed ones, which, on the one hand, makes it possible to more clearly determine the market movement, and on the other hand makes the indicator less sensitive. Real Channel is a non-redrawing channel indicator based on moving averages.
Super trend is one of the best trend indicators in metatrader 4 (MT4). Triple SuperTrend indicator is an indicator that consist of three super trend indicator that can be aranged. This indicator is built by mql4 language and doesn't provided by MT4 platform. Highly recommended using EMA SuperTrend Strategy Indicator if you want to get better result in here: https://www.mql5.com/en/market/product/91664 This indicator is easy to use, power full and has many benefits, there are: Using three ind
FREE
TrendPlus
Sivakumar Subbaiya
4.21 (14)
Trend Plus   Trendplus  Indicator   Time Frame: Suitable for any time frame.  Purpose: Trend Prediction. Blue and red candle indicate the buy and sell call respectively. Buy: When the blue candle is formed buy call is initiated. close the buy trades when the next red candle will formed.   Sell: When the Red candle is formed Sell call is initiated. close the Sell trades when the next blue candle will formed.   Happy trade!!
FREE
Ska ZigZag BuySell
NKATEKO VUKOSI LEROY MASANGO
Ska ZigZag BuySell indicator determines the overbought and oversold regions within a trend. The indicator determines the overbought region by the candlestick high and the oversold region by the candlestick low. This indicator only gives signals with arrow and audible alerts each and every time when a new candlestick appear. To utilize the full strategy i recommend using "Ska ZigZag BuySell" together with "Ska ZigZag Line". The Ska ZigZag Line indicator is available for free. NOTE: Indicator is h
The Elephant Candle is an indicator for MT4. It draws arrows when strong bullish or bearish candles appear. Strong candles frequently initiate a new trend. The arrows can be used in expert advisors. This indicator can improve already existing trading strategies. The indicator is very fast and doesn't repaint. Inputs Period Candle Multiplier Candle Niceness [%] Arrow Size Enable Alert Enable Push Notification Enable Email
The Doonchian channel consists of two channel displays. Channel lines are determined by a simple and reliable algorithm. The channel is preferably used for trading inside the channel. The indicator does not redraw and does not lag; simple algorithms are the basis of the work. It works on all currency pairs and on all timeframes. As always a warning, we must not forget that the approach must be comprehensive, the indicator signals require additional information to enter the market.
The indicator trades during horizontal channel breakthroughs. It searches for prices exceeding extreme points or bouncing back, monitors night flat and defines targets using customizable Fibo levels with a sound alert, which can be disabled if necessary. The indicator allows you to create a horizontal channel between the necessary extreme points in visual mode quickly and easily. It automatically applies your selected Fibo levels to these extreme points (if the appropriate option is enabled in t
The Sentiment Ratio indicator gauges current Market Sentiment between -100% and 100%, where lower than -40% is considered Bearish and higher than 40% is Bullish. The channel between the two is considered Neutral. The indicator has been a very useful filter tool for signals within a trading system. Example call function:  int SentimentIndicator(double triggerLevel)//Return sentiment if trigger level is activated {   double sentimentRatio=iCustom(NULL,0,"Sentiment Ratio",0,0,0);   if(sentimentRa
FREE
Smart Channel is a non-redrawing channel indicator based on moving averages. The indicator is used to identify trends in financial markets and indicates the direction of price movement. Smart Channel, in fact, is a miniature trading strategy, since, regardless of the construction methods, it uses the tactics of rebounding from the boundaries of the built channel, and the boundaries themselves are used as guidelines for the correct placement of stop loss and take profit orders. The key diffe
Drawing Pack
John Louis Fernando Diamante
4 (1)
This indicator provides several drawing tools to assist in various methods of chart analysis. The drawings will keep their proportions (according to their handle trendline) across different chart scales, update in real time, and multiple drawings are supported. # Drawing Option Description  1 Grid box draggable boxed grid, user defines rows x colums, diagonal ray option  2 Grid partial or fullscreen grid, sized by handle line  3 Grid flex a diagonal grid, sized and sloped by handle line
This indicator will provide you with everything you need in order to overcome losses due to human emotions. The indicator determines the moments of a trend reversal and the direction of its movements. This development is equipped with the most modern, adaptable trading algorithms. The main secret of short-term trading is to have information on when to enter a deal. The indicator works great on all timeframes and informs the trader about the most successful moments of buying or selling a currency
Free automatic Fibonacci is an indicator that automatically plots a Fibonacci retracement based on the number of bars you select on the BarsToScan setting in the indicator. The Fibonacci is automatically updated in real time as new highest and lowest values appears amongst the selected bars. You can select which level values to be displayed in the indicator settings. You can also select the color of the levels thus enabling the trader to be able to attach the indicator several times with differe
FREE
The indicator is a set of parameters for setting three moving averages (fast, medium and slow), which can be used to analyze the market. This indicator provides the ability to analyze market trends and make trading decisions based on the intersections of various moving averages. It also supports audio alerts for timely notification of trading signals. LengthFaster: Sets the number of candles used to calculate the faster moving average. A value of 5 means using price data from the last 5 can
Supporting file (2 of 2) for T3 Cloud MA Trend indicator derived from T3 moving averages. The cloud is bounded by a fast T3 and slow T3 lines. Buying/Selling opportunities above/below cloud. The fast and slow T3 MA lines can also be used as dynamic support/resistance for more aggressive entries. Use default values for best settings. The number of look back bars is user defined. This indicator can be used in combination with other strategies such as price action. Suitable for all time frames. P
FREE
Supporting file (1 of 2) for T3 Cloud MA Trend indicator derived from T3 moving averages. The cloud is bounded by a fast T3 and slow T3 lines. Buying/Selling opportunities above/below cloud. The fast and slow T3 MA lines can also be used as dynamic support/resistance for more aggressive entries. Use default values for best settings. The number of look back bars is user defined. This indicator can be used in combination with other strategies such as price action. Suitable for all time frames. P
FREE
This indicator continuously changes the color of candlestick borders and bodies, as well as the color of volumes in real time. The indicator is easy to use. The palette of colors is diverse. This product is a graphical solution, so it is difficult to describe what it does by text, it is easier to see by downloading it, besides the product is free. The indicator is suitable for bloggers who want to create a beautiful picture of a chart for video editing or traders who want to make their chart al
FREE
SSA stands for 'Singular Spectrum Analysis'. It combines elements of classical time series decomposition, statistics, multivariate geometry, dynamical systems and signal processing. SSA decomposes time series into a sum of components (ETs), with each component representing a lower smoothing, using several SVD (Singular Value Decompositions). It is a powerful filtering process used in many fields of research (climatology, biomedical, aerospace, etc), where high quality forecasting and smoothin
The Icarus Reversals(TM) FREE Indicator is a powerful tool to identify high-probability reversal points, across all instruments.  The Reversals Indicator provides traders and investors with a simple-to-use and highly dynamic insight into points of likely price-action reversals.  Generated by a unique proprietary code-set, the Reversals Indicator (FREE version) generates long and short trade signals, which can be customised for key inputs and colourisation. Settings of the Icarus Reversals FREE h
FREE
このプロダクトを購入した人は以下も購入しています
まず第一に、この取引インジケーターは再描画されず、再描画されず、遅延しないことを強調する価値があります。これにより、手動取引とロボット取引の両方に理想的なものになります。 ユーザーマニュアル:設定、入力、戦略。 アトミックアナリストは、価格の強さとモメンタムを利用して市場でより良いエッジを見つけるためのPA価格アクションインジケーターです。ノイズや誤ったシグナルを除去し、取引ポテンシャルを高めるための高度なフィルターを備えています。複雑なインジケーターの複数のレイヤーを使用して、アトミックアナリストはチャートをスキャンし、複雑な数学的計算をシンプルなシグナルと色に変換します。これにより、どのような初心者トレーダーでも理解して使用し、一貫した取引の決定を行うことができます。 「アトミックアナリスト」は、新規および経験豊富なトレーダー向けにカスタマイズされた包括的な取引ソリューションです。プレミアムインジケーターとトップノッチの機能を1つの取引戦略に組み合わせ、すべてのタイプのトレーダーにとって汎用性のある選択肢にします。 デイリートレーディングとスキャルピング戦略:高
An exclusive indicator that utilizes an innovative algorithm to swiftly and accurately determine the market trend. The indicator automatically calculates opening, closing, and profit levels, providing detailed trading statistics. With these features, you can choose the most appropriate trading instrument for the current market conditions. Additionally, you can easily integrate your own arrow indicators into Scalper Inside Pro to quickly evaluate their statistics and profitability. Scalper Inside
Reversal First Impulse levels (RFI)    INSTRUCTIONS        RUS       -       ENG              R ecommended to use with an indicator   -   TPSpro  TREND PRO -  Version MT5 A key element in trading is zones or levels from which decisions to buy or sell a trading instrument are made. Despite attempts by major players to conceal their presence in the market, they inevitably leave traces. Our task was to learn how to identify these traces and interpret them correctly. Main functions: Displaying activ
ご紹介     Quantum Breakout PRO は 、ブレイクアウト ゾーンの取引方法を変革する画期的な MQL5 インジケーターです。 13年以上の取引経験を持つ経験豊富なトレーダーのチームによって開発された Quantum Breakout PROは 、革新的でダイナミックなブレイクアウトゾーン戦略により、あなたの取引の旅を新たな高みに押し上げるように設計されています。 クォンタム ブレイクアウト インジケーターは、5 つの利益ターゲット ゾーンを備えたブレイクアウト ゾーン上のシグナル矢印と、ブレイクアウト ボックスに基づいたストップロスの提案を提供します。 初心者トレーダーにもプロのトレーダーにも適しています。 量子EAチャネル:       ここをクリック MT5バージョン:   ここをクリック 重要!購入後、インストールマニュアルを受け取るためにプライベートメッセージを送ってください。 推奨事項: 時間枠: M15 通貨ペア: GBPJPY、EURJPY、USDJPY、NZDUSD、XAUUSD アカウントの種類: ECN、Raw、また
このインディケータは、当社の2つの製品 Advanced Currency IMPULSE with ALERT  +   Currency Strength Exotics . のスーパーコンビネーションです。 このインジケーターは全ての時間枠で作動し、8つの主要通貨と1つのシンボルの強弱のインパルスをグラフで表示します。 このインジケータは、金、エキゾチックペア、商品、インデックス、先物など、あらゆるシンボルの通貨強度の加速度を表示することに特化されています。金、銀、原油、DAX、US30、MXN、TRY、CNHなどの通貨強度の加速度(インパルスまたは速度)を表示するために、任意のシンボルを9行目に追加できる、この種の最初のものです。 新しいアルゴリズムに基づいて構築され、潜在的な取引の特定と確認がさらに容易になりました。これは、通貨の強さや弱さが加速しているかどうかをグラフィカルに表示し、その加速の速度を測定するためです。加速すると物事は明らかに速く進みますが、これはFX市場でも同じです。つまり、反対方向に加速している通貨をペアリングすれば、潜在的に利益を生む取
FX Volume
Daniel Stein
4.61 (36)
mql5と Telegramの モーニング・ブリーフィングで、詳細とスクリーンショットを含む毎日のマーケット・アップデートをご覧 ください! FX Volumeは、ブローカーの視点から市場のセンチメントをリアルに洞察する、最初で唯一の出来高インジケーターです。 ブローカーのような機関投資家が外国為替市場でどのようなポジションをとっているか、COTレポートよりもはるかに速く、素晴らしい洞察を提供します。 この情報をチャート上で直接見ることは、あなたの取引にとって真のゲームチェンジャーであり、画期的なソリューションです。 以下のようなユニークなマーケットデータ洞察から利益を得てください。 比率は 、通貨のロングポジションとショートポジションの比率をパーセントで表示します。 比率の変化は 、選択した期間内のロング比率とその変化率を表示します。 Volumes Totalは 、通貨の取引量(ロングとショート)の合計をロット単位で表示します。 Volumes Long :全通貨のロングポジションの取引量を表示します。 Volumes(ショート )は、全通貨のショートポジションの取引量を表示
Cycle Sniper
Elmira Memish
4.41 (37)
NEW YEAR SALE PRICE FOR LIMITED TIME!!! Please contact us after your purchase and we will send you the complimentary indicators to complete the system Cycle Sniper is not a holy grail but when you use it in a system which is explained in the videos, you will feel the difference. If you are not willing to focus on the charts designed with Cycle Sniper and other free tools we provide, we recommend not buying this indicator. We recommend watching the videos about the indiactor and system before pu
現在20%OFF! 初心者やエキスパートトレーダーのためのベストソリューション! このダッシュボードソフトウェアは、28の通貨ペアで動作しています。それは私達の主要な指標(高度な通貨の強さ28と高度な通貨インパルス)の2に基づいています。それは全体の外国為替市場の大きい概観を与えます。それは、すべての(9)時間枠で28の外国為替ペアのための高度な通貨の強さの値、通貨の動きの速度と信号を示しています。チャート上で1つのインディケータを使用して市場全体を観察し、トレンドやスキャルピングの機会をピンポイントで見つけることができたら、あなたのトレードがどのように改善されるか想像してみてください。 このインディケータには、強い通貨と弱い通貨の識別、潜在的な取引の識別と確認がより簡単になるような機能が搭載されています。このインディケータは、通貨の強さや弱さが増加しているか減少しているか、また、すべての時間枠でどのように機能しているかをグラフィカルに表示します。 新機能として、現在の市場環境の変化に適応するダイナミックなマーケットフィボナッチレベルが追加され、すでに当社のAdvan
TPSpro TRENDPRO  - is a trend indicator that automatically analyzes the market and provides information about the trend and each of its changes, as well as giving signals for entering trades without redrawing! The indicator uses each candle, analyzing them separately. referring to different impulses - up or down impulse. Exact entry points into transactions for currencies, crypto, metals, stocks, indices!  -  Version MT5               DETAILED DESCRIPTION                R ecommended to use with
今、147ドル(いくつかの更新後に499ドルに増加します) - 無制限のアカウント(PCSまたはMac) RelicusRoad ユーザー マニュアル + トレーニング ビデオ + プライベート Discord グループへのアクセス + VIP ステータス 市場の新しい見方 RelicusRoad は、外国為替、先物、暗号通貨、株式、および指数の世界で最も強力な取引インジケーターであり、トレーダーに収益を維持するために必要なすべての情報とツールを提供します。初心者から上級者まで、すべてのトレーダーが成功するためのテクニカル分析と取引計画を提供します。これは、将来の市場を予測するのに十分な情報を提供する重要な取引指標です。意味をなさないチャート上のいくつかの異なる指標ではなく、完全な解決策を信じています.これは、信号、矢印 + 価格アクション情報を表示するオールインワンのインジケーターで、他に類を見ない非常に正確です。 強力な AI に基づいて、RelicusRoad は不足している情報とツールを提供して、あなたを教育し、トレーディングのプロ、成功したトレーダーにします。
JULY OFFER 80% OFF next price for unlimited version will be 17000$. This is the only time you can get this institutional and professional indicator at this price for unlimited version. Don't dare to miss this. The tool I am about to introduce to you you can't compare it with other tools due to its strategy and accuracy level in predicting the next price directional movement . This tool is designed for serious traders who have decided to make a difference through trading. Be the next person to wi
NAM Order Blocks
NAM TECH GROUP, CORP.
5 (1)
MT4マルチタイムフレームオーダーブロック検出インジケーター。 特徴 -チャートコントロールパネルで完全にカスタマイズ可能で、完全な相互作用を提供します。 -必要な場所でコントロールパネルを表示および非表示にします。 -複数の時間枠でOBを検出します。 -表示するOBの数量を選択します。 -さまざまなOBユーザーインターフェイス。 -OBのさまざまなフィルター。 -OB近接アラート。 -ADRの高線と低線。 -通知サービス(画面アラート|プッシュ通知)。 概要 注文ブロックは、金融機関や銀行からの注文収集を示す市場行動です。著名な金融機関と中央銀行が外国為替市場を牽引しています。したがって、トレーダーは市場で何をしているのかを知る必要があります。市場が注文ブロックを構築するとき、それは投資決定のほとんどが行われる範囲のように動きます。 注文の構築が完了すると、市場は上向きと下向きの両方に向かって急激に動きます。注文ブロック取引戦略の重要な用語は、機関投資家が行っていることを含むことです。それらは主要な価格ドライバーであるため、機関投
これはMT4のインジケーターで、再描画なしで取引に参入するための正確なシグナルを提供します。 外国為替、暗号通貨、金属、株式、インデックスなど、あらゆる金融資産に適用できます。かなり正確な見積もりを提供し、取引を開始して終了するのに最適な時期を教えてくれます。1つのシグナルを処理しただけでインジケーターの元が取れた例の 動画 (6:22)をご覧ください。Entry PointsPro インジケーターの助けを借りたほとんどのトレーダーの最初の1週間の結果が改善しています。 Telegramグループ に登録してください。Entry Points Proインジケーターのメリットは次の通りです。 再描画のないエントリーシグナル 再描画されるインジケーターでは一度表示されたシグナルが削除されて大きな金銭的損失につながることがありますが、これと異なり、表示されて確認されたシグナルは消えることがありません。 エラーなしの取引開始 インジケーターアルゴリズムによって取引を開始する(資産を売買する)理想的な瞬間を見つけることができます。それを使用するすべてのトレーダーの成功率が向上します。
現在20%OFF! 初心者やエキスパートトレーダーに最適なソリューションです。 このインディケータは、エキゾチックペア・コモディティ・インデックス・先物など、あらゆるシンボルの通貨の強さを表示することに特化したインディケータです。金、銀、原油、DAX、US30、MXN、TRY、CNHなどの通貨の強さを表示するために、9行目にどのシンボルでも追加することができます。独自の機能を多数搭載し、新しい計算式を採用したため、ユニークで高品質、かつ手頃な価格のトレーディングツールとなっています。新しいトレンドやスキャルピングチャンスのトリガーポイントを正確に把握することができるため、あなたのトレードがどのように改善されるか想像してみてください。 ユーザーマニュアル:ここをクリック   https://www.mql5.com/en/blogs/post/708876 すべての時間枠に対応します。あなたはすぐにトレンドを見ることができるようになります! 新しいアルゴリズムに基づいて設計されているため、潜在的な取引の特定と確認がより簡単になります。これは、8つの主要通貨と1つのシンボ
The AT Forex Indicator MT4 is a sophisticated trading tool designed to provide traders with a comprehensive analysis of multiple currency pairs. This   powerful indicator   simplifies the complex nature of the forex market, making it accessible for both novice and experienced traders. AT Forex Indicator uses   advanced algorithms   to detect trends, patterns and is an essential tool for traders aiming to enhance their forex trading performance. With its robust features, ease of use, and reliabl
MTF Supply Demand Zones
Georgios Kalomoiropoulos
4.83 (23)
次世代の自動化された需要と供給のゾーン。どのチャートでも機能する新しい革新的なアルゴリズム。すべてのゾーンは、市場の価格行動に従って動的に作成されています。 2種類のアラート --> 1) 価格がゾーンに達したとき 2) 新しいゾーンが形成されたとき もう 1 つの役に立たない指標はありません。実績のある完全な取引戦略を手に入れることができます。     新機能:     価格が需給ゾーンに達したときにアラートを出す     新しい需給ゾーンが作成されたときにアラートを発します     プッシュ通知アラート     ピップ単位のゾーン幅ラベル     MTF のもう 1 つのタイムフレーム。したがって、現在より 2 時間足高いのではなく、現在より 3 時間足し上に見えるようになります。     アラート/ゾーン/MTF 機能を有効/無効にするボタン あなたが得る利点:     取引から感情を取り除きます。     取引エントリをオブジェクト化します。     確率の高いセットアップで利益
Indicator : RealValueIndicator Description : RealValueIndicator is a powerful tool designed specifically for trading on the EURUSD pair. This indicator analyzes all EUR and USD pairs, calculates their real currency strength values, and displays them as a single realistic value to give you a head start on price. This indicator will tell you moves before they happen if you use it right. RealValueIndicator allows you to get a quick and accurate overview of the EURUSD currency pair tops and bottoms,
ZeusArrow Smart Liquidity Finder  Smart Liquidity Finder is Ai controlled indicator based on the Idea of Your SL is My Entry. It scan and draws the major Liquidity areas on chart partitioning them with Premium and Discount Zone and allows you find the best possible trading setups and help you decide the perfect entry price to avoid getting your Stop Loss hunted . Now no more confusion about when to enter and where to enter. Benefit from this one of it's kind trading tool powered by Ai an trade
TrendMaestro
Stefano Frisetti
5 (3)
note: this indicator is for METATRADER4, if you want the version for METATRADER5 this is the link:  https://www.mql5.com/it/market/product/108106 TRENDMAESTRO ver 2.4 TRENDMAESTRO recognizes a new TREND in the bud, he never makes mistakes. The certainty of identifying a new TREND is priceless. DESCRIPTION TRENDMAESTRO identifies a new TREND in the bud, this indicator examines the volatility, volumes and momentum to identify the moment in which there is an explosion of one or more of these data a
現在26%OFF! このインディケータは、当社のメインインディケータ( Advanced Currency Strength 28   &  Advanced Currency IMPULSE with ALERT )の両方のスーパーコンビネーションです。28の外国為替ペアのTICK-UNITSとアラートシグナルの通貨強度の値を示しています。11種類のTick-Unitが使用可能です。1、2、3、4、5、6、10、12、15、20、30秒の11種類です。サブウィンドウのTick-Unitバーは、秒単位のタイマーに1ティック以上含まれる場合に表示され、左側にシフトされます。 たった1枚のチャートで、28のFXペアをスキャルピングできます。スキャルピングのチャンスとなるトリガーポイントを正確に把握することで、スキャルピングが上達することを想像してみてください。 1分足よりも短い期間で動作する市場初の通貨強度インジケーターです! このインジケータは、素早いインとアウトを行い、小さなピップを切り取ることを望む高速スキャルパーのためのものです。 ユーザーマニュアル: ここをクリ
ご紹介   クォンタム トレンド スナイパー インジケーターは 、トレンド反転を特定して取引する方法を変革する画期的な MQL5 インジケーターです。 13年以上の取引経験を持つ経験豊富なトレーダーのチームによって開発されました。     クォンタムトレンドスナイパーインジケーター   は、非常に高い精度でトレンドの反転を識別する革新的な方法で、あなたのトレーディングの旅を新たな高みに押し上げるように設計されています。 ***Quantum Trend Sniper Indicatorを購入すると、Quantum Breakout Indicatorを無料で入手できます!*** クォンタム ブレイクアウト インジケーターは、トレンドの反転を特定するとアラートを発し、矢印を示し、3 つのテイクプロフィットレベルを提案します。 初心者トレーダーにもプロのトレーダーにも適しています。 量子EAチャネル:       ここをクリック MT5のバージョン:       ここをクリック 推奨事項: 期間: すべての時間枠。最良の結果を得るには、
This indicator uses support and resistance, volume and some special formula to calculate the volume to filter the candles. If the volume reaches a specific value, And at the same time, Candle breaks the support/resistance line, There would be a signal and we can enter the market. Signals appear when the current candle closes. then you can enter the trade when a new candle appears. Please don't forget to follow your money management plan. MT5 Version Support/Resistance Breakout MT5 :   https:
The Volumebyprice.com Indicator for MetaTrader 4 features Volume Profile and Market Profile TPO (Time Price Opportunity). Volume and TPO histogram bar and line charts. Volume Footprint charts. TPO letter and block marker collapsed and split structure charts. Static, dynamic and flexible range segmentation and compositing methods with relative and absolute visualizations. Session hours filtering and segment concatenation with Market Watch and custom user specifications. Graphical layering, posit
EZTトレンドインジケーターは、トレンド、プルバック、エントリーの機会を示します。 オプションのフィルタリングとあらゆるタイプのアラートが利用可能です。 電子メールおよびプッシュ通知アラートが追加されます。 また、このインジケーターに基づいた EA も開発中であり、間もなく利用可能になる予定です。 2色のヒストグラムとラインで構成される多機能インジケーターです。 これはトレンドの方向と強さを視覚的に表現したもので、ラインまたはヒストグラム上で発散が何度も見つかります。 このインジケーターは自動パラメーター設定とうまく連携します。 これらは特定の時間枠に対して事前に決定されており、その設定でインジケーターを使用することをお勧めします。 手動モードでは、独自のパラメータを設定できます。 これはマルチタイムフレーム(MTF)インジケーターです。 このインジケーターは、MTF rsi、MTF cci、MACD pro などの他のインジケーターの組み合わせとうまく機能します。 取引される商品の変動が大きいほど、最適なエントリーを見つけるために使用する必要がある時間枠は短くなりま
30% DISCOUNT ! DISCOUNT ! DISCOUNT ONLY FOR 5 USERS at125$ valid for 1 day only.Grab it The PERFECT TREND HIT creates   BUY and SELL  perfect trend   arrow signals based on ADX EMA AND RSI And all filters inbuilt with accurate trend entries. Furthermore, the indicator and template display the trend direction, strength, and trade recommendation for independent price charts. ROCK WITH THE TREND Moreover, it shows the final trade recommendation to BUY or SELL with all filters and displays that info
A. A2SR とは何ですか ?   * 先行テクニカル指標です (塗り直しなし、ラグなし)。 -- ガイダンス : -- https://www.mql5.com/en/blogs/post/734748/page4#comment_16532516 -- そして https://www.mql5.com/en/users/yohana/blog A2SR には、サポート (需要) とレジスタンス (供給) のレベルを決定する特別な手法があります。 ネットで見かける通常の方法とは異なり、A2SR は実際の SR レベルを決定する独自のコンセプトを持っています。 元の手法はインターネットから取得されたものではなく、インターネット上で公開されたこともありません。 A2SR は、取引スタイルに応じて SR レベルを自動選択します。 時間枠を変更しても、SR レベルはその位置にとどまります。 実際のSRは、使用する時間枠から取得されるわけではないため. A2SR には、取引のための完全な手段があります 。 実際のサポート (需要) とレジスタンス (供給) の真のコンセプト。
Gold Channel is a volatility-based indicator, developed with a specific timing algorithm for the XAUUSD pair, which consists of finding possible corrections in the market. This indicator shows two outer lines, an inner line (retracement line) and an arrow sign, where the theory of the channel is to help identify overbought and oversold conditions in the market. The market price will generally fall between the boundaries of the channel. If prices touch or move outside the channel it is a tra
Enigmera
Ivan Stefanov
5 (4)
エニグメラ:市場の中核 https://www.enigmera.com はじめに このインディケータと取引システムは、金融市場に対する驚くべきアプローチです。ENIGMERAは、フラクタルサイクルを使用して、サポートとレジスタンスレベルを正確に計算します。本格的な蓄積局面を示し、方向性と目標を示します。 トレンド中でも調整中でも機能するシステムです。 どのように作動するのか? ENIGMERAは、支持線・抵抗線、目標線、乖離線の3つのラインで構成されています。このシステムは、過去のデータを現在と未来に外挿する典型的な市場指標とは異なり、現在の完全な画像を提供します。支持線上にある場合、それは本当の支持を意味し、抵抗線上にある場合、それは本当の抵抗を意味する。ある水準が破られた場合、それはトレンドの変化を意味する。再描画はしない。 市場は常に進化しているため、ENIGMERAはその評価ツールを適応させ、定期的に戦略を修正しています。  これにより、すべてのシナリオが徹底的に評価されることが保証されます。この市場指標の独自性は、その能力を見れば明らかです。  ENIGM
The All-in-One Trade Indicator (AOTI) determines daily targets for EURUSD, EURJPY, GBPUSD, USDCHF, EURGBP, EURCAD, EURAUD, AUDJPY, GBPAUD, GBPCAD, GBPCHF, GBPJPY, AUDUSD, and USDJPY. All other modules work with any trading instruments. The indicator includes various features, such as Double Channel trend direction, Price channel, MA Bands, Fibo levels, Climax Bar detection, and others. The AOTI indicator is based on several trading strategies, and created to simplify market analysis. All-in-One
Please send me Direct message on MQL5 CHAT after purchasing the Indicator for Training and Installation Support There are some additional files that is important to use with the Indicator . So be sure to contact me after purchasing the Indicator So that I can add you for training and support . If you find any difficulty with installation then send me Direct message here So that I can connect with you via Anydesk or Teamview for the product installation. " Smart Order Block Indicator " to find
作者のその他のプロダクト
BullseyeSignal – NoRepaint は、名前が示すように、いかなる状況でも再描画されないシグナルです。シグナルは画像に表示された同じローソク足に表示されます。外為、暗号通貨、株式、指数、先物などの高ボラティリティ市場に最適です。 購入には緑の矢印、販売には赤の矢印のみが表示されますが、その背後にはより簡潔な取引体験を提供するために多くの指標が協力しています。 これは正確なエントリーを提供するために特別に設計されています。 多くのエントリーではなく、指標がトレンドの変化を示し、前のトレンドの反対方向に0レベルを超えたときに特定のエントリーを提供します。より正確な取引を実現するために、指標はトレンドの変化を確認するために最初のプルバックを待ち、偽の逆転を回避します。したがって、前のトレンドのブレイクとプルバックの確認後にシグナルが発行されます。 これは非常に慎重な取引アプローチです。 したがって、これらのヒントに従うことが重要です(初心者および上級トレーダーの両方がこの戦略を使用できます): ニューヨーク、ロンドン、または両市場の重複を使用することをお勧めします。
Aurum Apex Mt4 EA
Martin Alejandro Bamonte
Aurum Apex EAの説明 Aurum Apex EAは、MT4プラットフォーム向けに設計された強力な100%自動化された取引ツールです。リアルタイムで市場を分析し、さまざまな取引の機会を検出します。 すべてのレベルのトレーダーに適したAurum Apex EAは、リスクパラメータを介して調整可能な3つのリスクモードを提供します: リスク = 0.1(低リスク): 金の動きに慣れていない新規トレーダーに最適です。この設定では、驚きを最小限に抑えながら信頼を築きます。 リスク = 0.2(中リスク): 金取引に精通した経験豊富なトレーダーにお勧めです。利益の可能性とドローダウンの間で最適なバランスを実現します。 リスク = 0.3(高リスク): 1日数時間しかロボットを操作しない上級トレーダー向けです。この設定は、EAを3〜4時間後に無効にする人に適しています。USDやBTCの重要なニュースイベント中は注意が必要です。 ECNまたはゼロスプレッド口座で最低$1000から始めることをお勧めし、M1のタイムフレームでXAUUSDペアのみを取引します。ただし、Aurum Apexは利用
NextCandlePredictor インジケーター NextCandlePredictorは、再描画しない、色が変わらない、動かない、消えない、遅延がないアラート付きのシグナルインジケーターです。あらゆるタイムフレームで次のキャンドルまたはその次のキャンドルの方向を識別するのに役立ちます。ニューヨーク、ロンドン、またはその両方の重なり合う高ボラティリティ市場に特にお勧めです。 主な特徴: タイムフレームの汎用性: M1からH1以上のあらゆるタイムフレームで迅速かつ正確なシグナルを提供します。 明確な買い/売りシグナル: ADXのDI+とDI-ラインを使用して明確な買いと売りのシグナルを生成し、最良のトレード判断を下せるようにします。 直感的な視覚化: シグナルはチャート上に緑色(買い)と赤色(売り)の矢印で直接表示され、迅速かつ簡単に読み取れます。 カスタマイズ可能な設定: 分析するバーの数とアラートオプションを好みとトレード戦略に応じて調整できます。使用するTFに応じた提案表を以下で確認してください。 即時およびオプションのキャンドル終了時アラート: デフォルトでは、ADX条件が
MTFMA(マルチタイムフレーム移動平均)インジケーターは、異なる時間枠で複数の移動平均(MA)を使用して、メインチャートとは別のウィンドウで買いと売りのシグナル(リペイントしない)を提供します。これは、短時間枠でのスキャルピングや長時間枠での長期取引の両方に適しており、多用途で解釈が簡単です。 なぜマルチフレームなのか? マルチフレームという用語は、インジケーターが複数の時間枠のデータを使用および組み合わせる能力を指します。MTFMAは、4つのカスタマイズ可能な移動平均(MA)に基づいてシグナルを計算して表示します。各MAは、異なる期間、計算方法、および価格タイプに調整できるため、トレーダーは1つのチャートで短期および長期のトレンドの組み合わせを見ることができます。 重要なポイント: 多用途性:分から月まで、あらゆる時間枠で使用可能。スキャルピングから長期取引まで適しています。 リペイントしない:シグナル(上矢印または下矢印)が生成されると、その色は変わらず、トレーダーが生成されたシグナルに基づいて取引判断を行うことができます。 簡単な解釈:買いと売りのシグナルは、下部インジケーター
「Scalping Signal No Repaint No Lag」は、どのチャートにドラッグしても、テンプレートや他のインジケーターをロードする必要なく、必要なすべてのインジケーターを自動的にロードする市場で唯一のインジケーターです。提供された画像とまったく同じようにチャートを自動的に設定します。このインジケーターはリペイントや遅延のないシグナルを保証し、すべての通貨ペアおよび時間枠(TF)でのスキャルピング戦略に最適です。 機能 インジケーターの自動ロード :インジケーターを任意のチャートにドラッグすると、追加の必要なインジケーターがすべて自動的にロードされ、設定された好みに応じてチャートが設定されます。ただし、設定からパラメータを変更することもできます。 チャートの可視化 :日本のローソク足や特定の色を使用して、視覚化を改善するためにチャートのプロパティを調整します。背景やローソク足の色は必要に応じて変更できます。 シグナル生成 :2つの移動平均線の差およびRSIとそのEMAのクロスオーバーを使用して、買いと売りのシグナルを生成し、チャートに矢印で表示します。 トレンドの可視化
Clear Breakout
Martin Alejandro Bamonte
「Breakout Buy-Sell」インジケーターは、異なる市場セッション(東京、ロンドン、ニューヨーク)での価格ブレイクアウトに基づいて、潜在的な売買機会を識別し、強調するために設計されています。このインジケーターは、トレーダーが買いゾーンと売りゾーン、および利益確定(TP)とストップロス(SL)レベルを明確に視覚化するのに役立ちます。 使用戦略 インジケーターは以下のように使用できます: 初期設定 :市場セッションを選択し、GMTオフセットを調整します。 市場の視覚化 :各セッションの開始時に描かれるブレイクアウトボックスを観察します。これらのボックスは期間の高値と安値を示します。 売買シグナル :ボックスの高値を超えた場合は買いシグナルと見なされます。安値を下回った場合は売りシグナルと見なされます。 リスク管理 :TP1、TP2、TP3、およびSLレベルを使用してポジションを管理します。TPレベルは異なる利益目標のために設計されており、SLは不利な動きに対する保護を保証します。 応用戦略 このインジケーターを最大限に活用するために、以下の戦略が推奨されます: ロンドンセッション
主な特徴: M15タイムフレームでGBPUSDに最適化: GBPUSDペア専用に設計およびテストされています。 推奨最低口座残高: 低いドローダウンを確保するために、最低$1000の口座残高が必要です。 スプレッドの互換性: 利益を最大化するために、低スプレッドまたはECN口座での使用が最適です。 リスク管理: エクスポネンシャルロット機能を1.0に設定することで無効にするオプションを含み、取引ニーズに応じて調整可能です。 カスタマイズ可能なパラメータ: 調整可能なパラメータの範囲を提供し、ユーザーがEAを自分の取引スタイルとリスク許容度に合わせて調整できるようにします。 GBPUSD Pip Hunter EAのパラメータ説明 MM(マネーマネジメントの切り替え) 説明: マネーマネジメント機能を有効または無効にするための切り替え。 オプション: いいえ: マネーマネジメントを無効にします。 はい: マネーマネジメントを有効にします。 MMType 説明: 使用するマネーマネジメントの種類を指定します。 オプション: いいえ: マネーマネジメントを無効にします。 はい: マネーマネジ
「MultiSymbol & TF Chart Integrated」インジケーターは、迅速に包括的な市場ビューを提供するために設計されており、好みの時間枠で最大60の通貨ペアを単一のチャートで監視すること(複数モード)や、すべての時間枠で取引しているペアを表示すること(シンプルモード)を可能にします。 主な利点: 完全監視: 単一のチャートで希望するすべてのペアを一目でリアルタイムで監視できます。 時間節約: チャート間の切り替えを避け、各ペアの動きをリアルタイムで確認できます。 トレンド分析: トレンドフォローのトレーダーに最適で、意思決定前にトレンドを確認するために上位の時間枠を見ることができます。 極端なカスタマイズ: インジケーターのすべての側面を特定のニーズに合わせて調整します。 極端なカスタマイズ: 高度に設定可能なインジケーターパラメーター: シンボルと時間枠: 最大60の異なるシンボルを設定できます。 各シンボルには独自の時間枠を持つことができます(例:M1、M5、M15、M30、H1、H4、D1、W1、MN1)。 表示モード: シンプルモード: 特定の時間
異なる通貨ペアやタイムフレームを監視するために複数のチャートを切り替えるのに疲れましたか? Pairs and TF Changer インディケーターがあなたのトレード体験を革新します! すべての戦略インディケーターを読み込んだら、 Pairs and TF Changer をチャートに追加します。必要に応じて、その位置、色、または表示する列数を調整できます! 主な特徴: シームレスな統合: このインディケーターを簡単にトレーディング戦略に統合できます。 ワンクリックで、すべての通貨ペアとタイムフレームを単一のチャートで取引できます。 追加のチャートを切り替えたり開いたりする必要がなくなります。 高度にカスタマイズ可能: チャート上の任意の位置にその位置を調整します(上、下、左、右)。 ボタンの1行または10行を表示するように設定できます。 トレーディングテーマに合わせて色をカスタマイズできます。 チャートを清潔で整然と保つためにボタンを透明にします。 ユニバーサルな互換性: すべての種類のインディケーターと戦略に対応しています。 外為、金属、米国株、指数、石油、先物、暗号通貨など、す
フィルタ:
レビューなし
レビューに返信