V Patterns Scanner MT5
Introduction
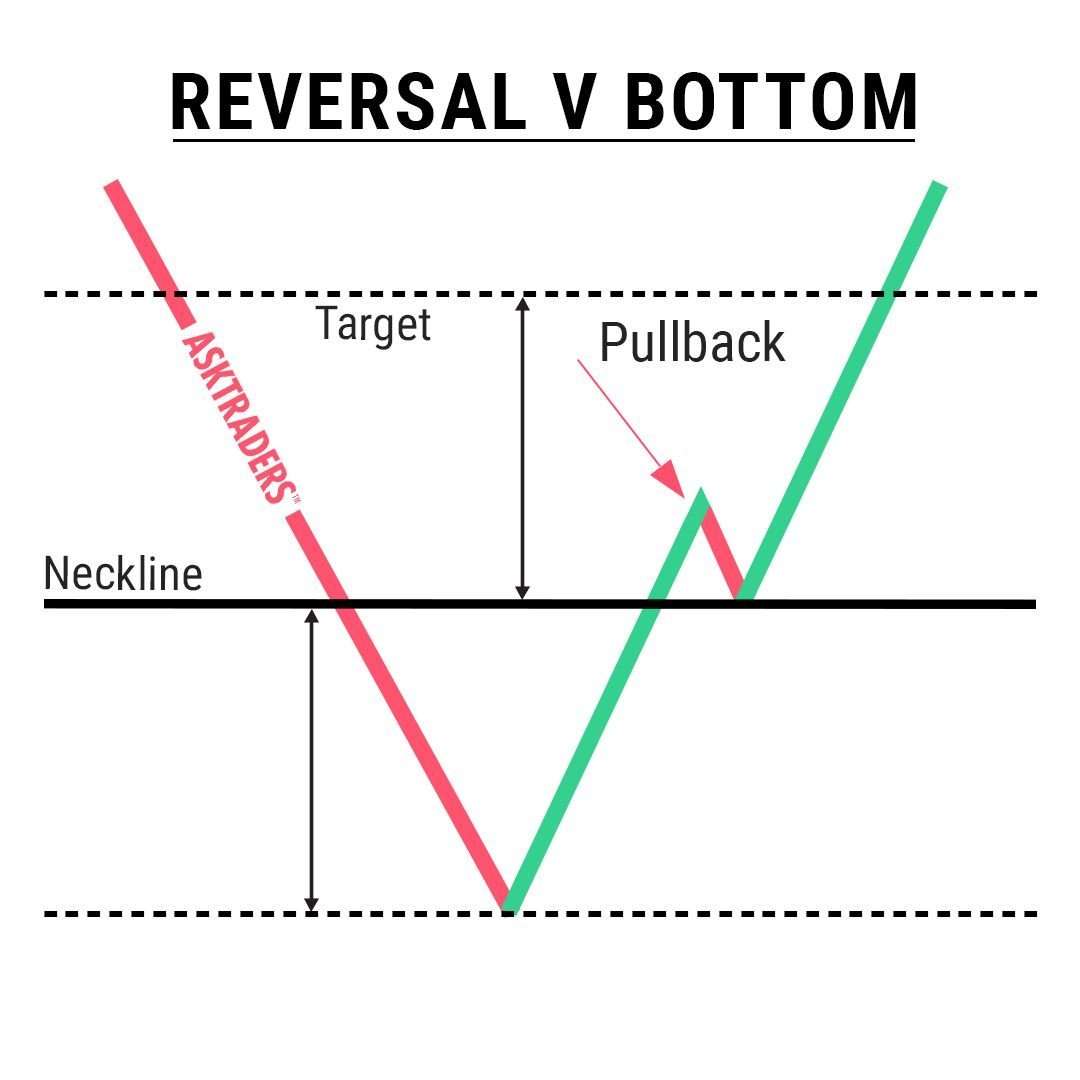
V Bottoms and Tops are popular chart patterns among traders due to their potential for identifying trend reversals. These patterns are characterized by sharp and sudden price movements, creating a V-shaped or inverted V-shaped formation on the chart. By recognizing these patterns, traders can anticipate potential shifts in market direction and position themselves accordingly. V pattern is a powerful bullish/bearish reversal pattern and appears in all markets and time-frames.
V Pattern Scanner
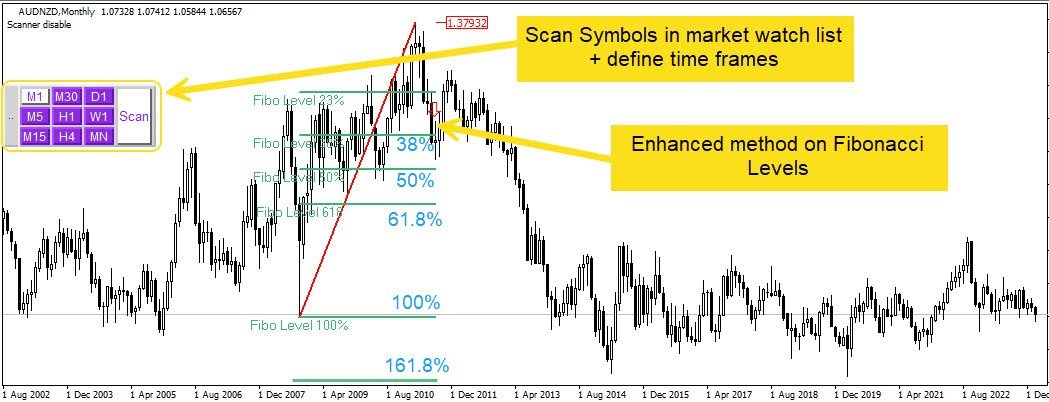
V-shaped bottoms and tops can be challenging to trade because of their sharp and sudden movement. It is easy for a trader to recognize patterns on scanner chart by scanning many charts and time frames in same time without trader's mistake in calculations. This indicator can automatically scan all symbols and time frames to find possible patterns in one chart.
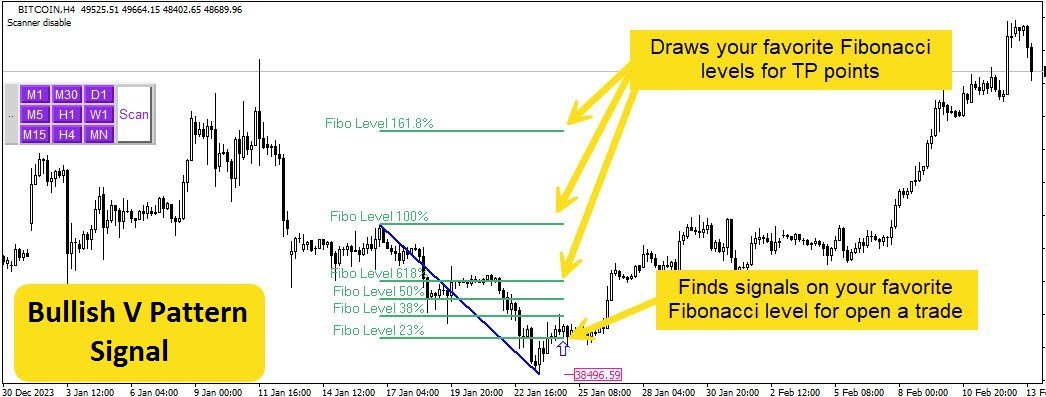
Scan, Fibonacci calculations and pattern recognition are completely done by V Pattern Scanner indicator; All you do is "press the scan button". It sends alert and push notification on your mobile.
How To Work
Default setting is best practice and you can just add it on chart and use V Pattern Scanner indicator, then you have signals with entry point, stop-loss, and take-profit by clear signal to decide a strong trade.