HiperCube DonChain
- インディケータ
- Adrian Lara Carrasco
- バージョン: 1.0
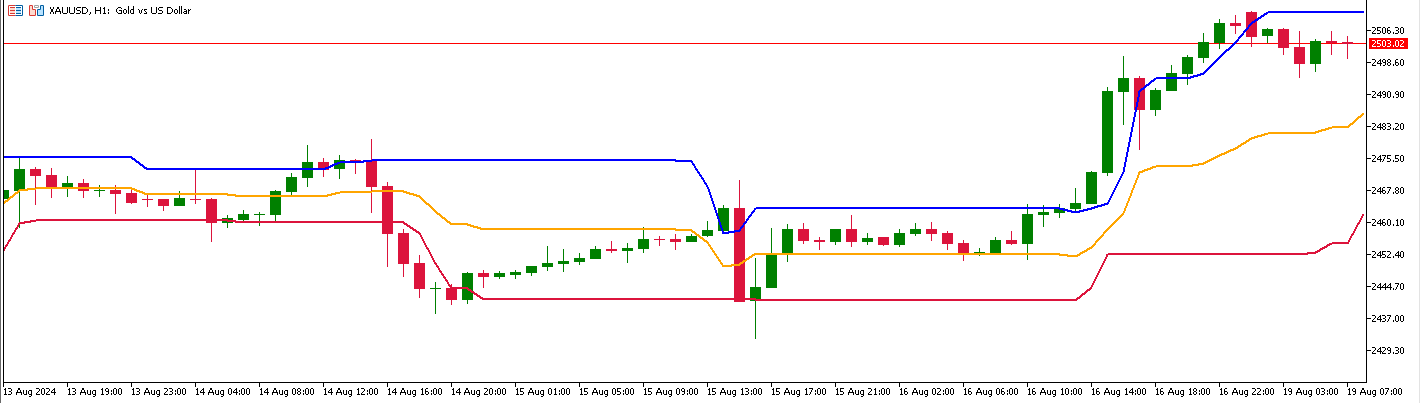
HiperCube DonChain is here!
This indicators helps you to know when one active will be a oppossite moviment.
FEATURES:
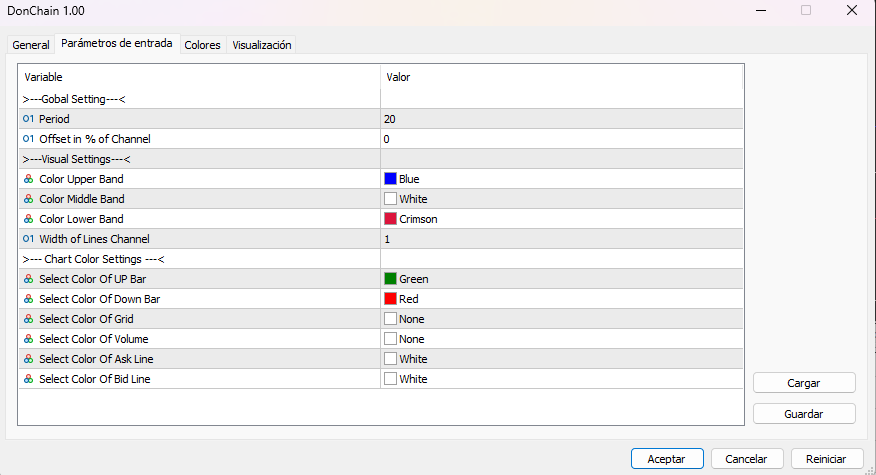
- Custom Period
- Custom Color to Bands
- Price Off Set
- Custom Your Chart !
For Developers:
If you are developer and want use this is your code here you have a guide to integrate HiperCube DonChain to your code
Read Guide
Feel free to ask me any question after purchase