Volume Break Oscillator
- インディケータ
- Roberto Bonati
- バージョン: 1.1
- アップデート済み: 19 7月 2024
- アクティベーション: 10
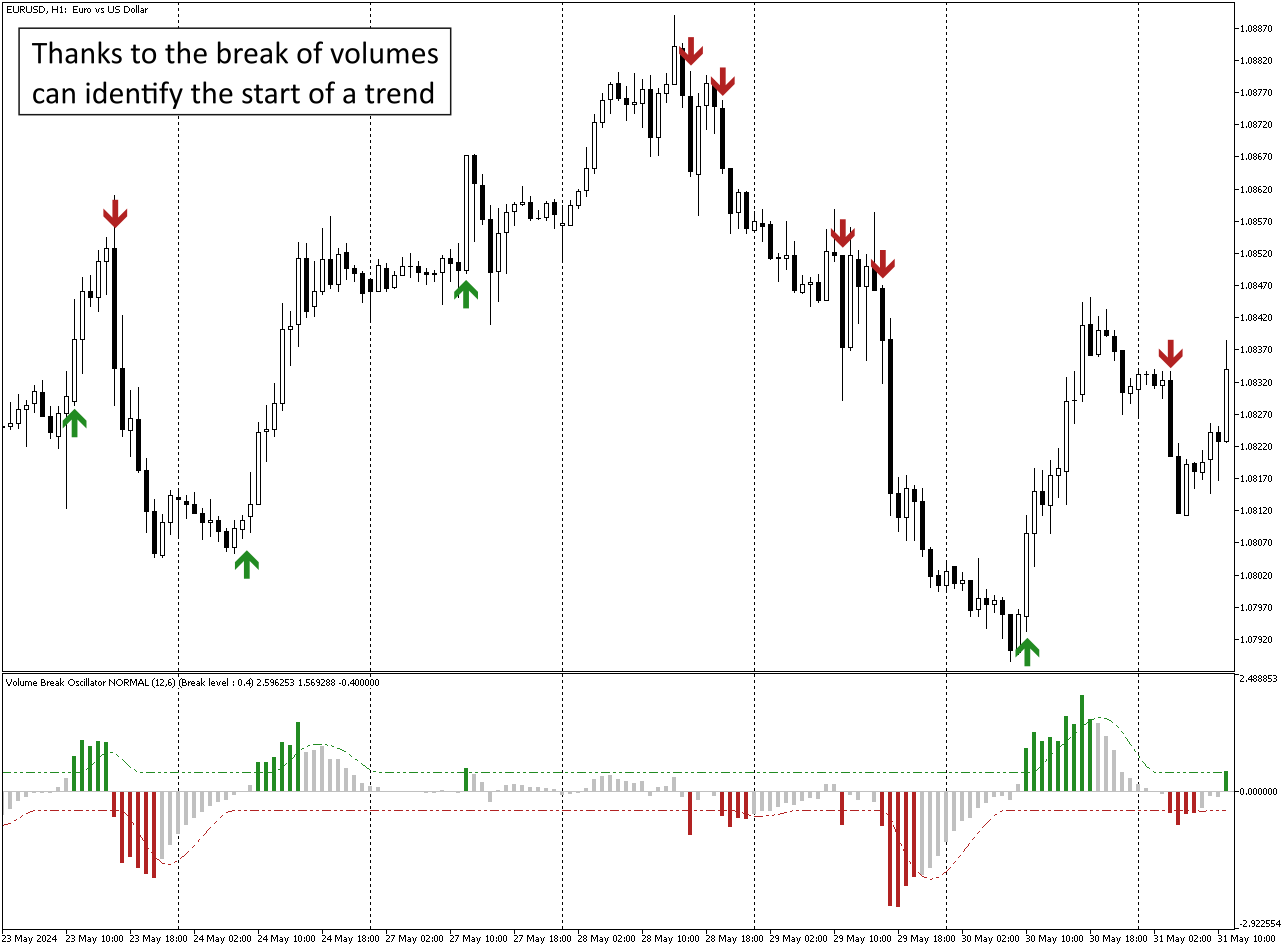
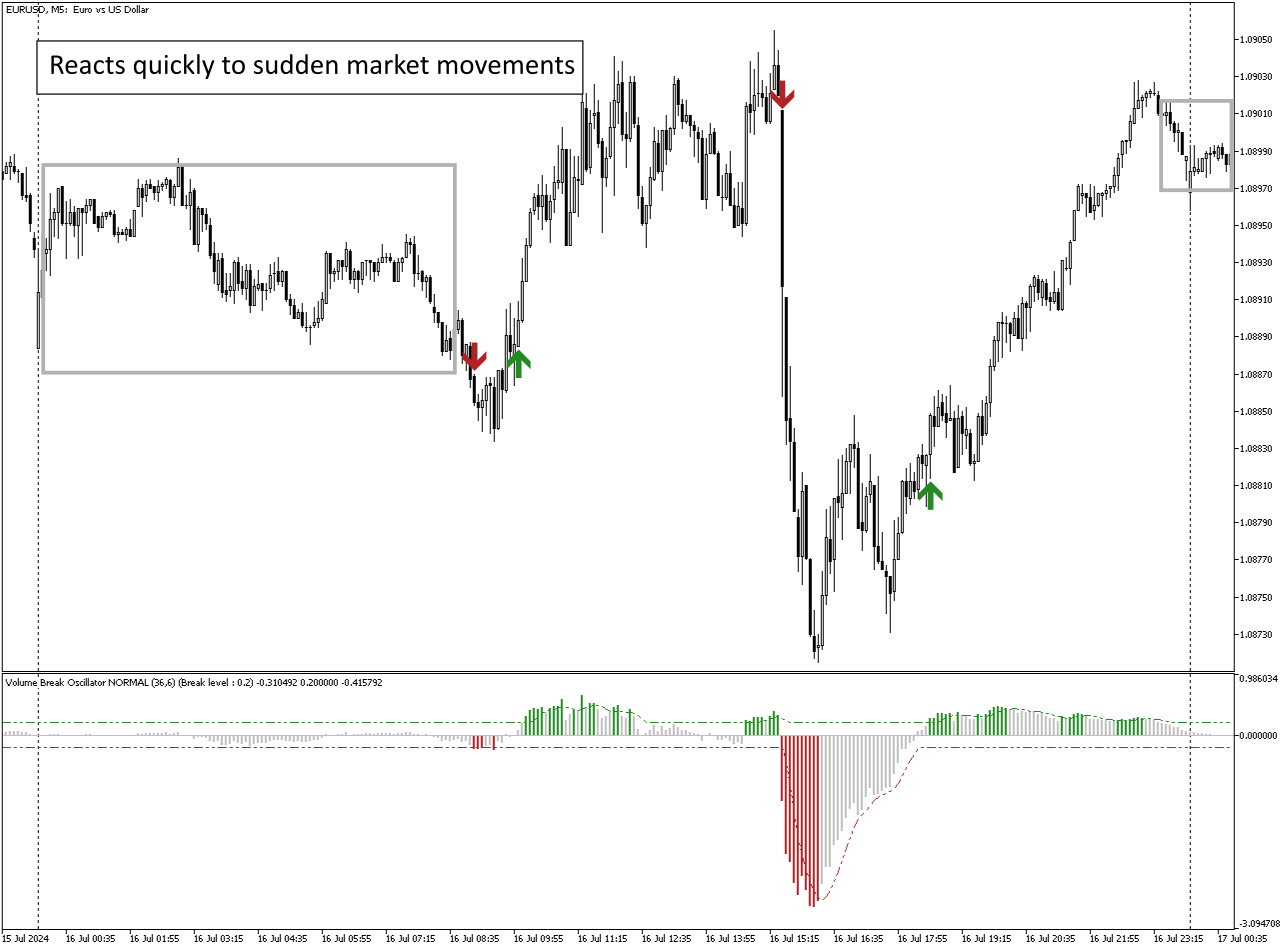
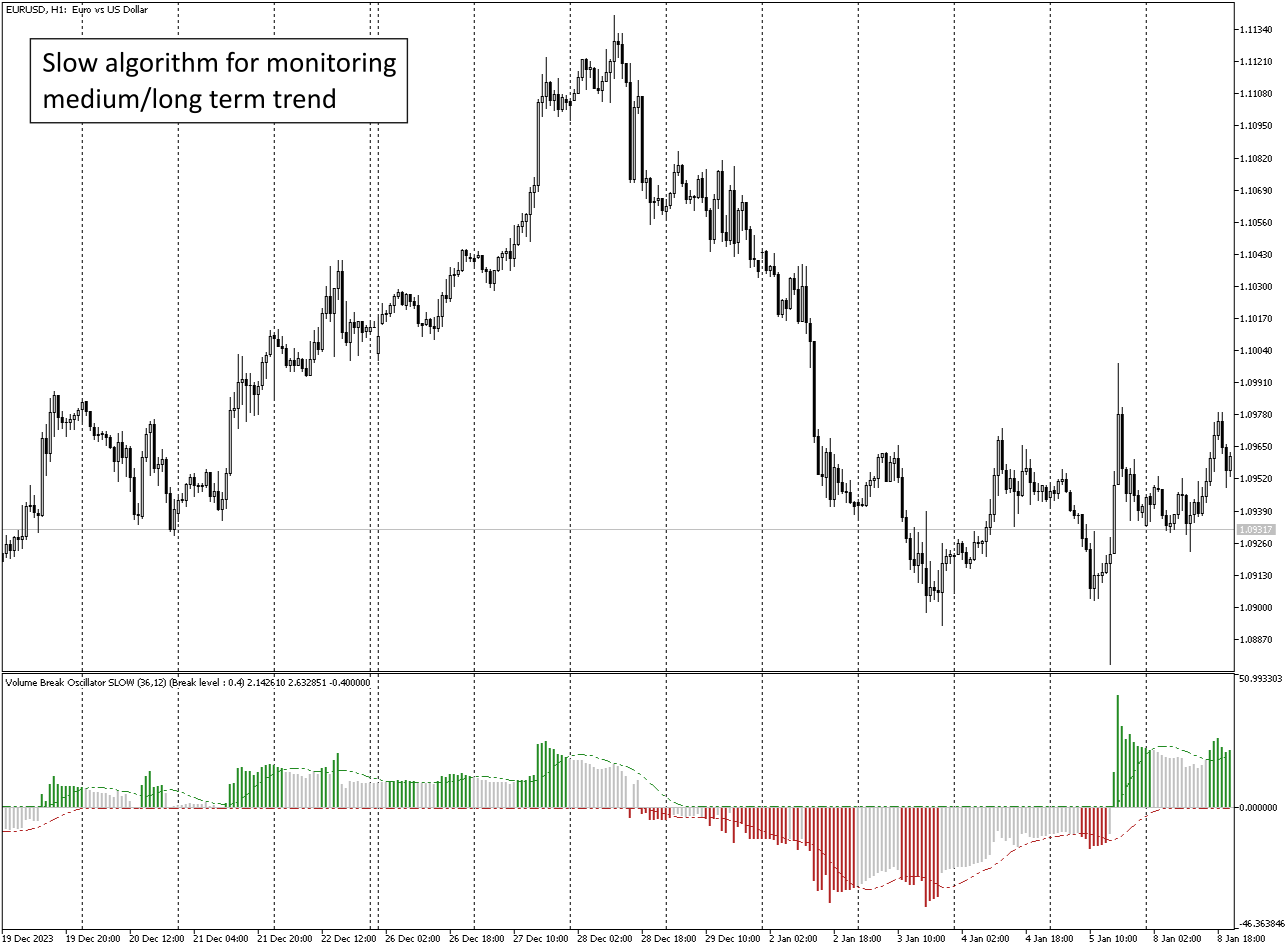
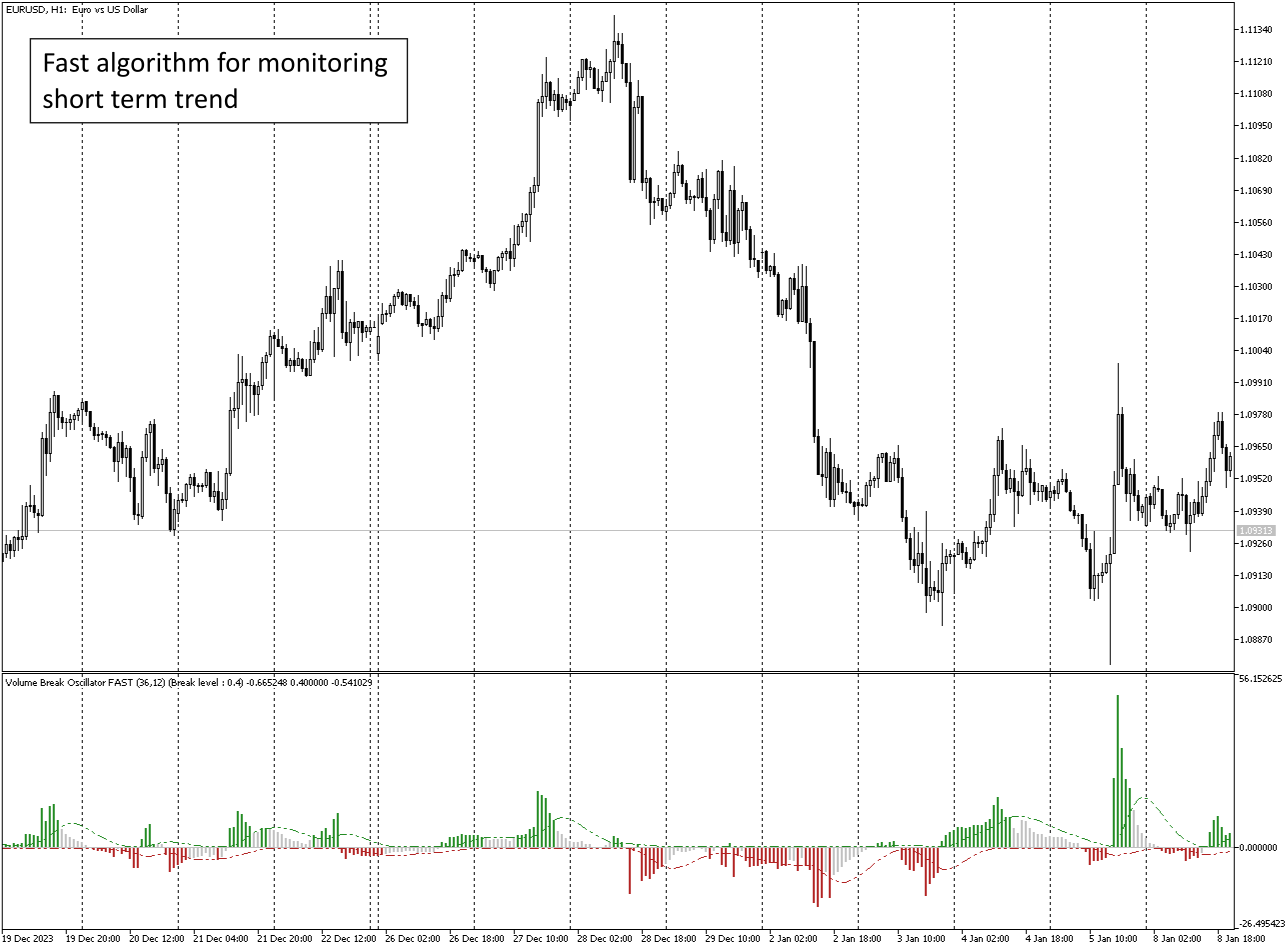
ボリューム ブレイク オシレーターは、オシレーターの形で価格変動とボリューム トレンドを一致させるインジケーターです。
私はボリューム分析を戦略に統合したいと思っていましたが、OBV、マネー フロー インデックス、A/D、ボリューム加重 Macd など、ほとんどのボリューム インジケーターにいつもがっかりしていました。
そのため、このインジケーターを自分で作成し、その有用性に満足したので、市場に公開することにしました。
主な機能:
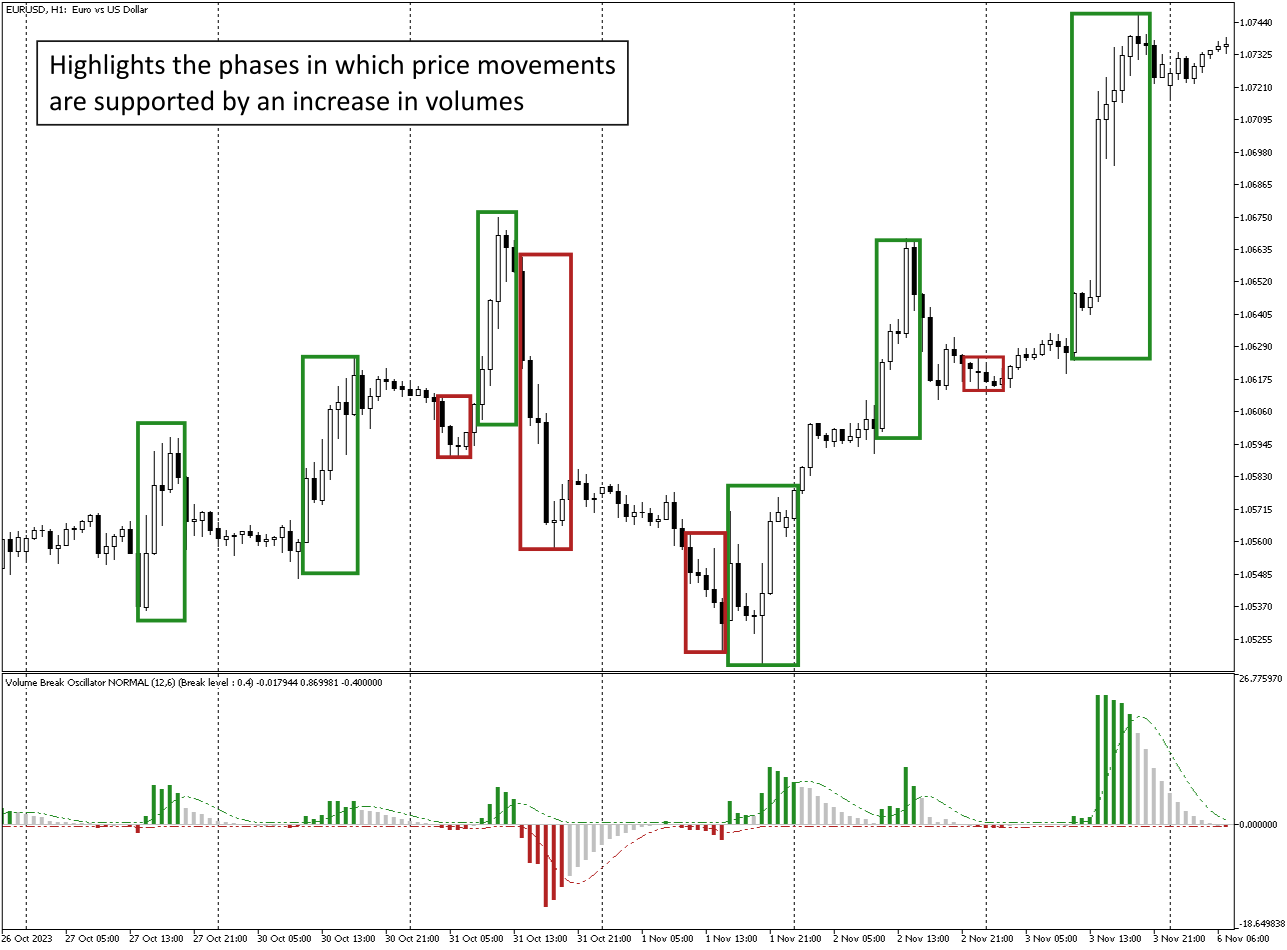
ボリュームの増加 (ブレイク) によってサポートされる方向に価格が動くフェーズを強調します。
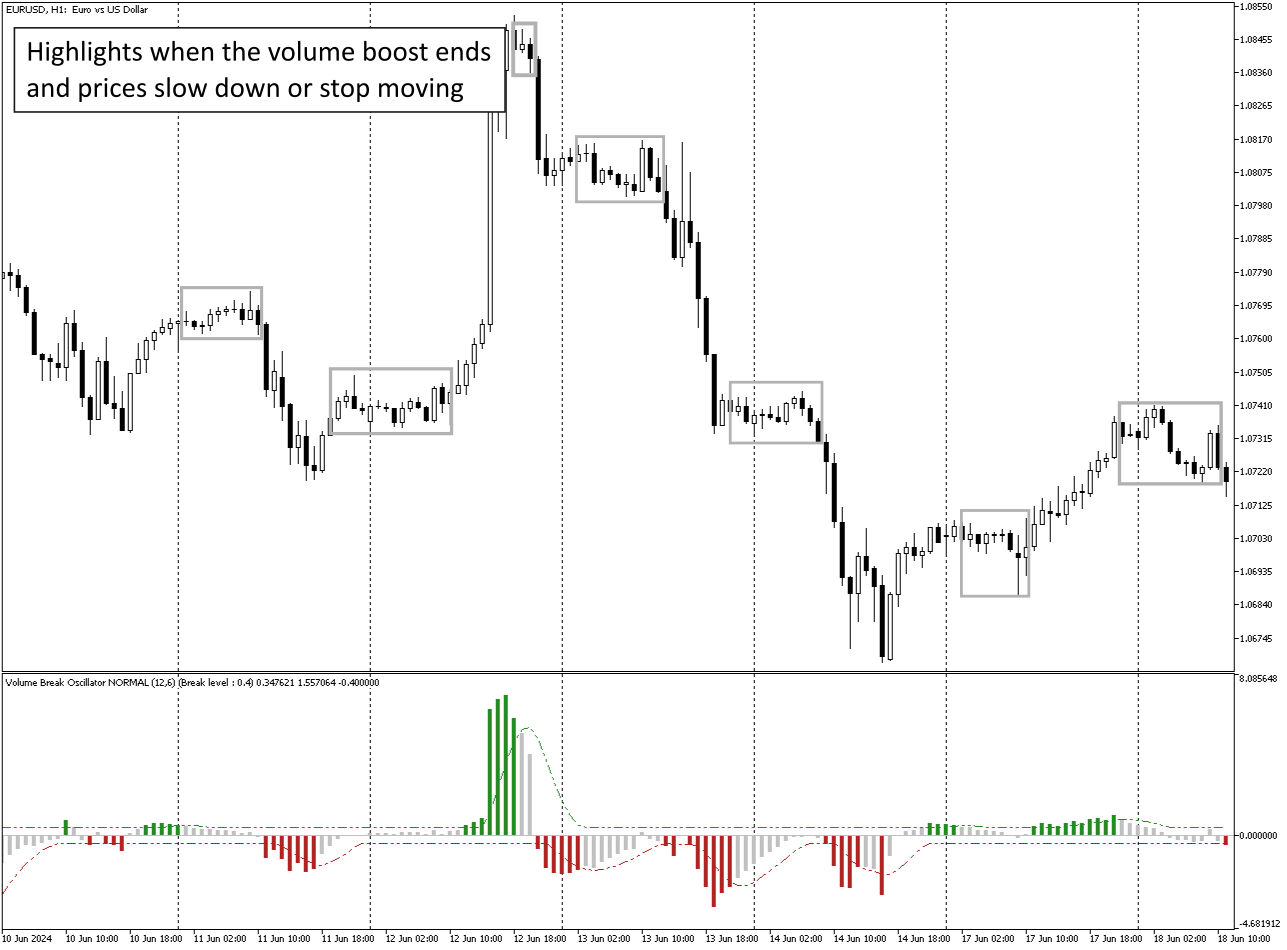
ボリュームの増加が止まり、市場が縮小するフェーズを強調します。
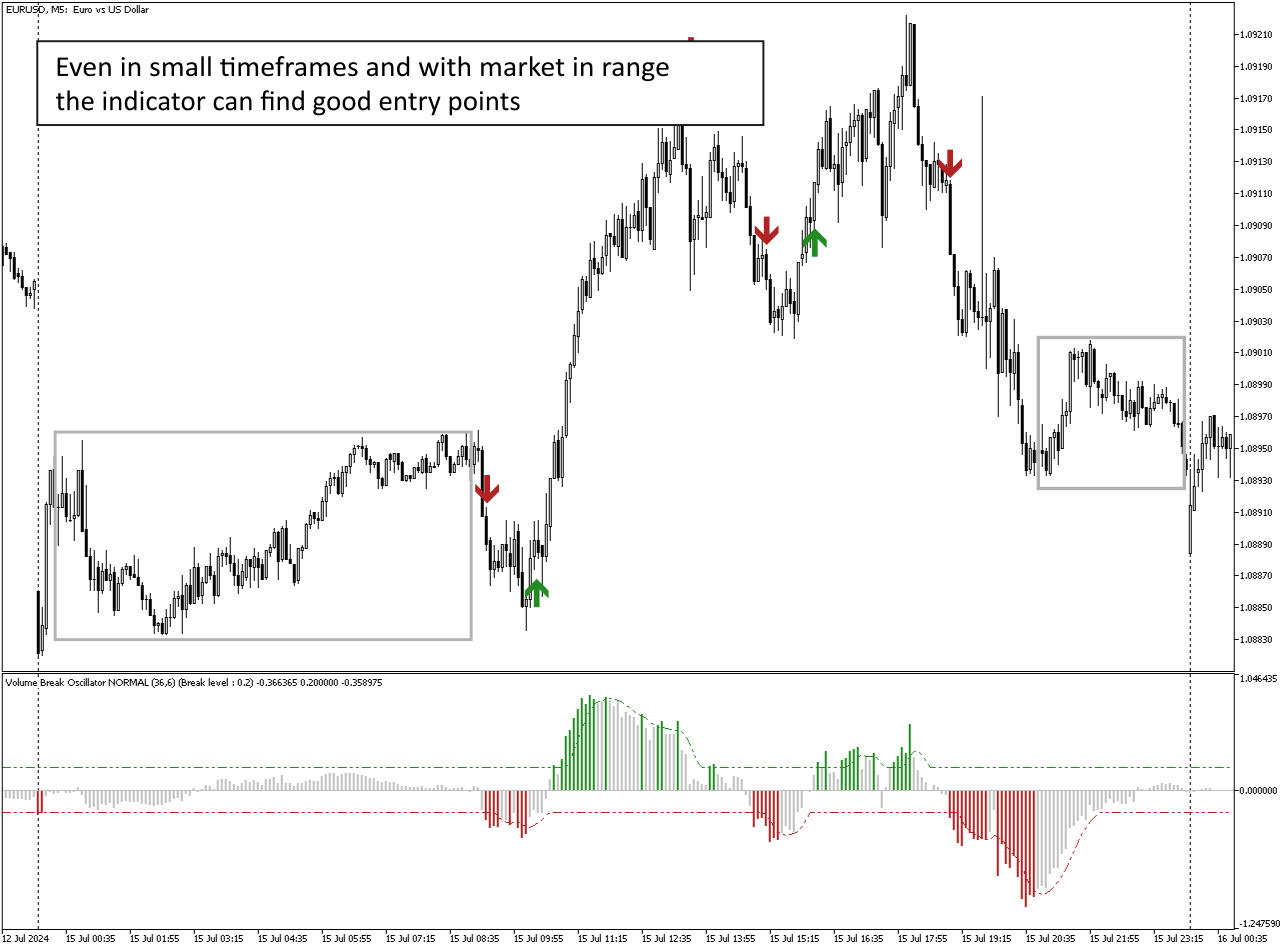
特に時間枠 (<=15 分) のデイトレードでは、価格もボリュームも動かないため、市場が将来の動きに備えられるフェーズを強調します。
ボリュームの増加によってサポートされていない場合、他のエキスパートアドバイザーからの偽のシグナルをフィルタリングします。
トレンドとレンジフェーズを非常に簡単に視覚化できます
入力パラメータ:
計算設定:
計算タイプ: FAST、NORMAL、SLOW。同じ時間枠内で短期、中期、長期を監視します。
計算期間: 計算期間
ボリューム設定:
ボリュームタイプ: TickVolume (主に Forex 用) および RealVolume (株式市場用)
シグナル設定:
シグナル期間: シグナルラインの期間
ブレークレベル: ブレイクアウトシグナルのしきい値レベル
アラート設定
アラートタイプ: クローズバーまたはインスタントアラート
メール
通知
EA で呼び出すバッファー番号:
0 - ヒストグラム
1 - ブレークラインアップ
2 - ブレークラインダウン
皆様、楽しい取引を!