Supply Demand Ribbon MT5 Advanced
- インディケータ
- Gia Thong Nguyen
- バージョン: 1.0
- アクティベーション: 10
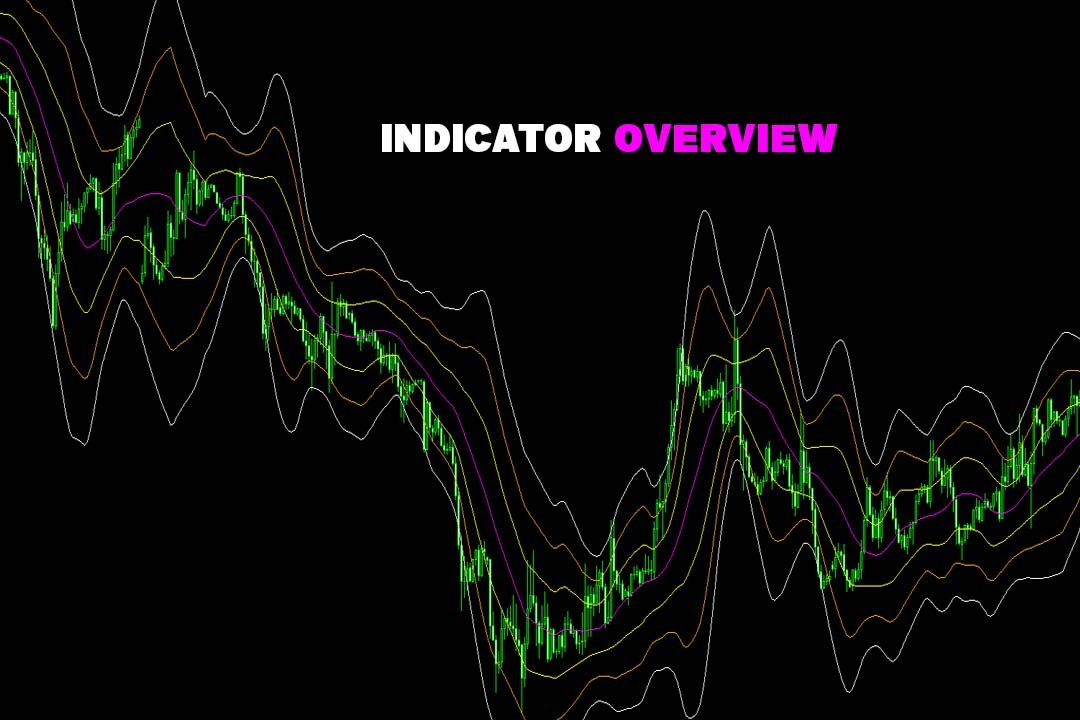
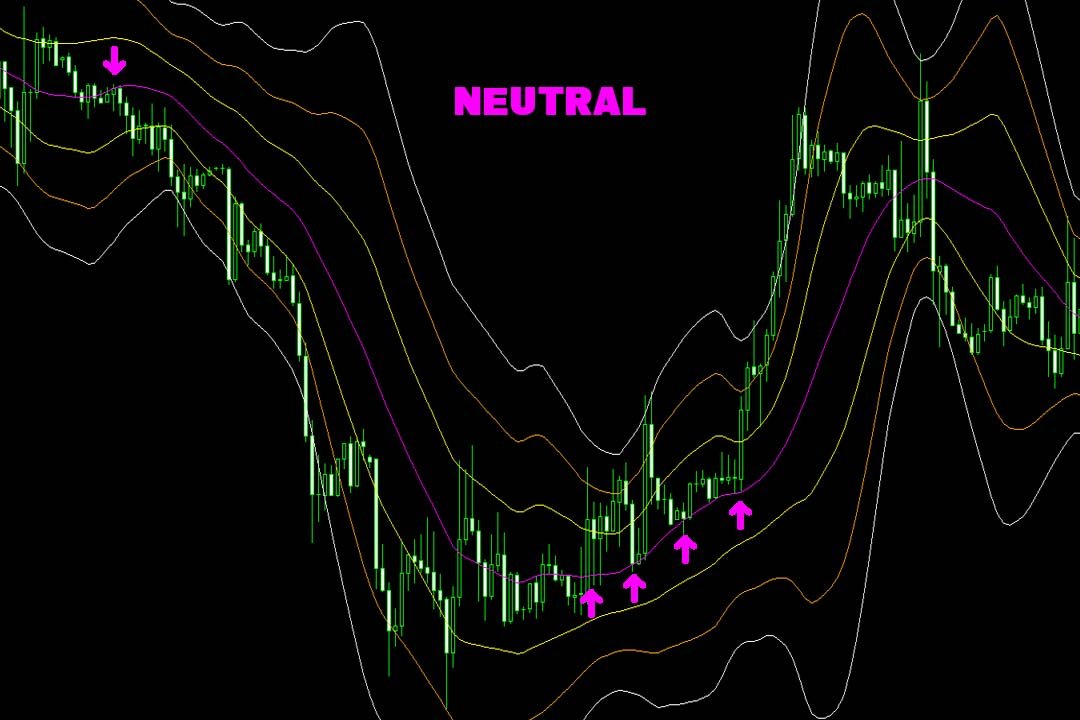
Supply Demand Ribbon is an indicator with moving supply and demand lines that help you identify price zones more easily.
The indicator helps you determine flexible entry, stop loss, and take profit areas.
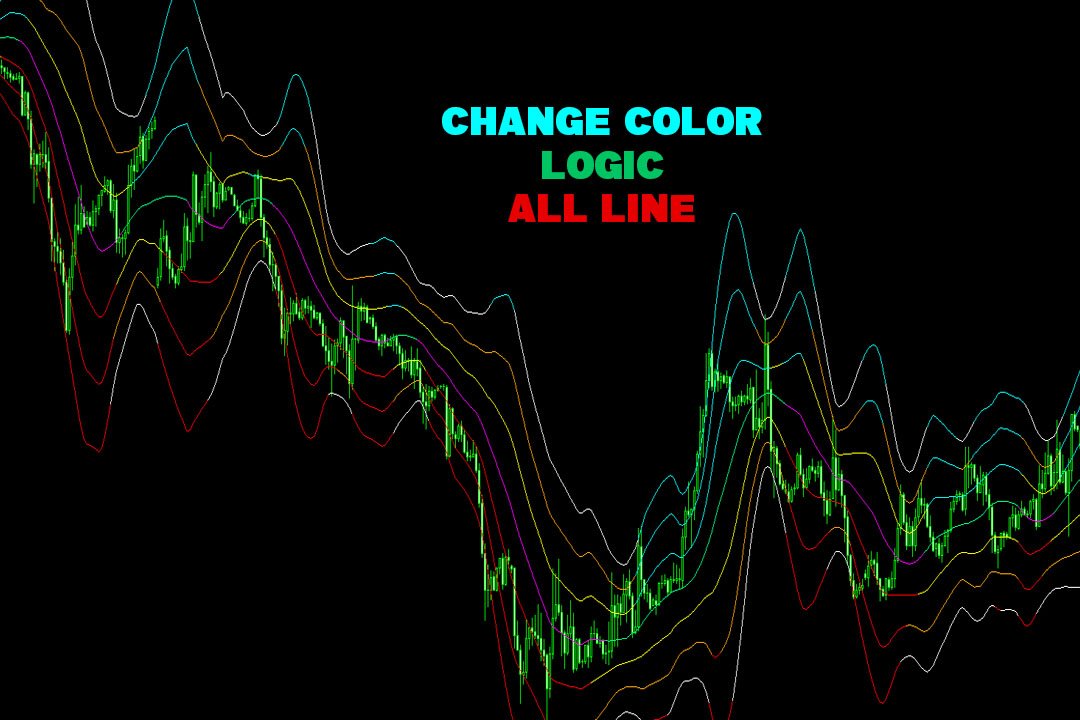
There are also strategies for algorithmically changing ribbon colors.
From there you can come up with many trading strategies for yourself!
You can try the Basic version here!
MT4 version: Click here!
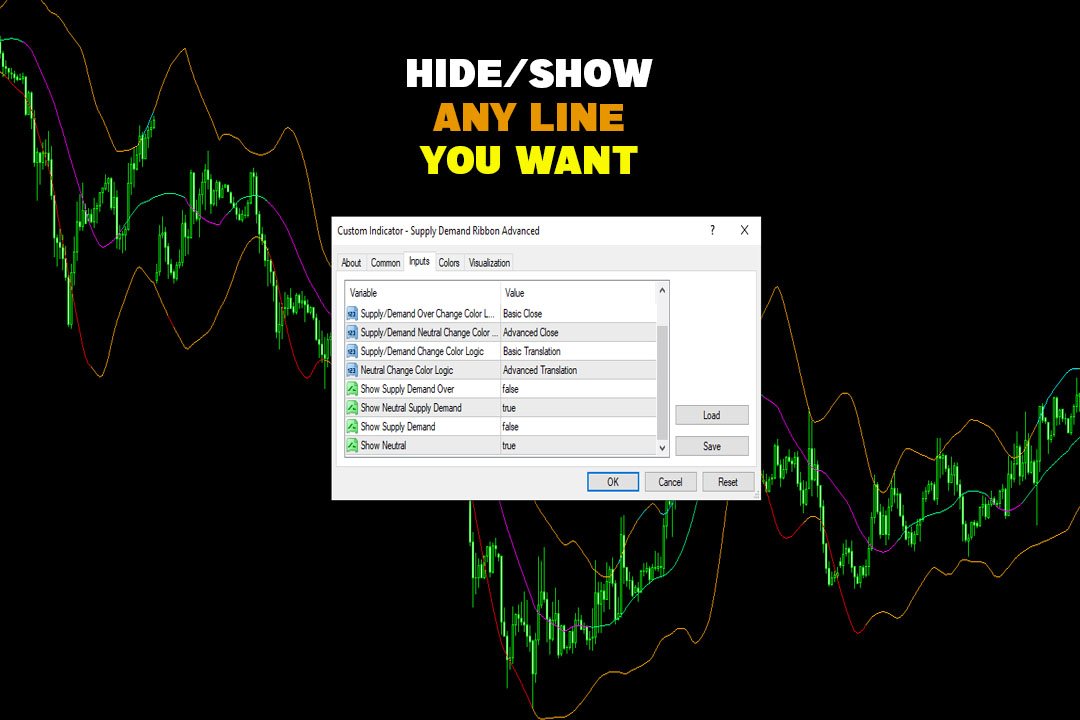
Feature in Advanced version:
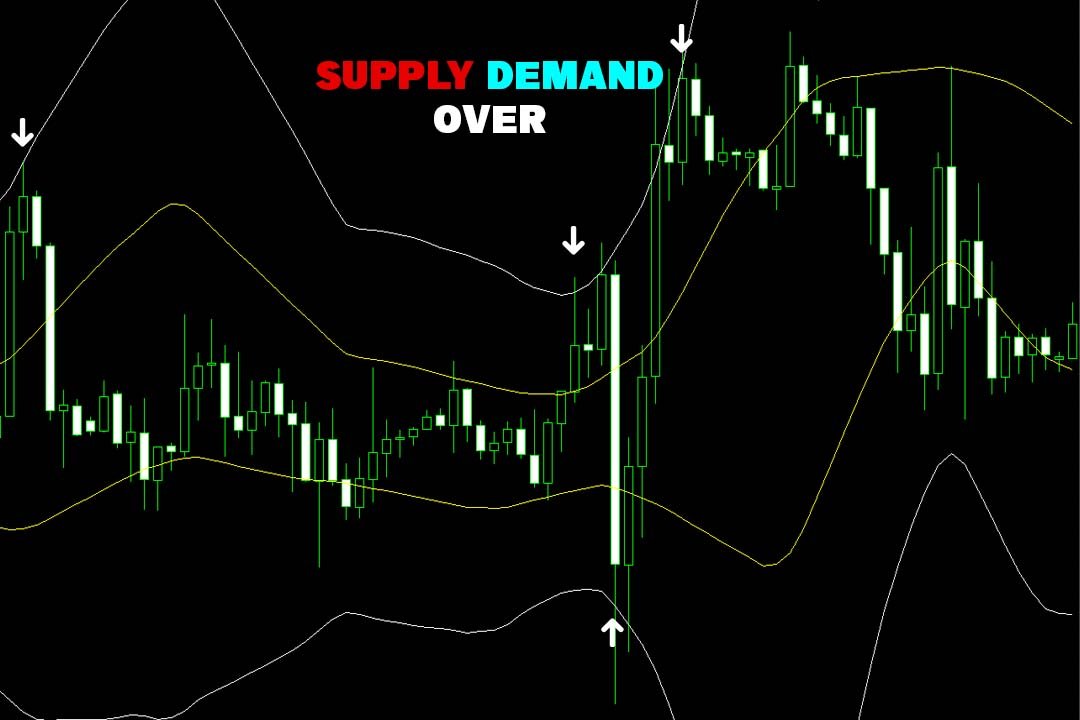
- Hide/Show 2 Supply/Demand Over lines.
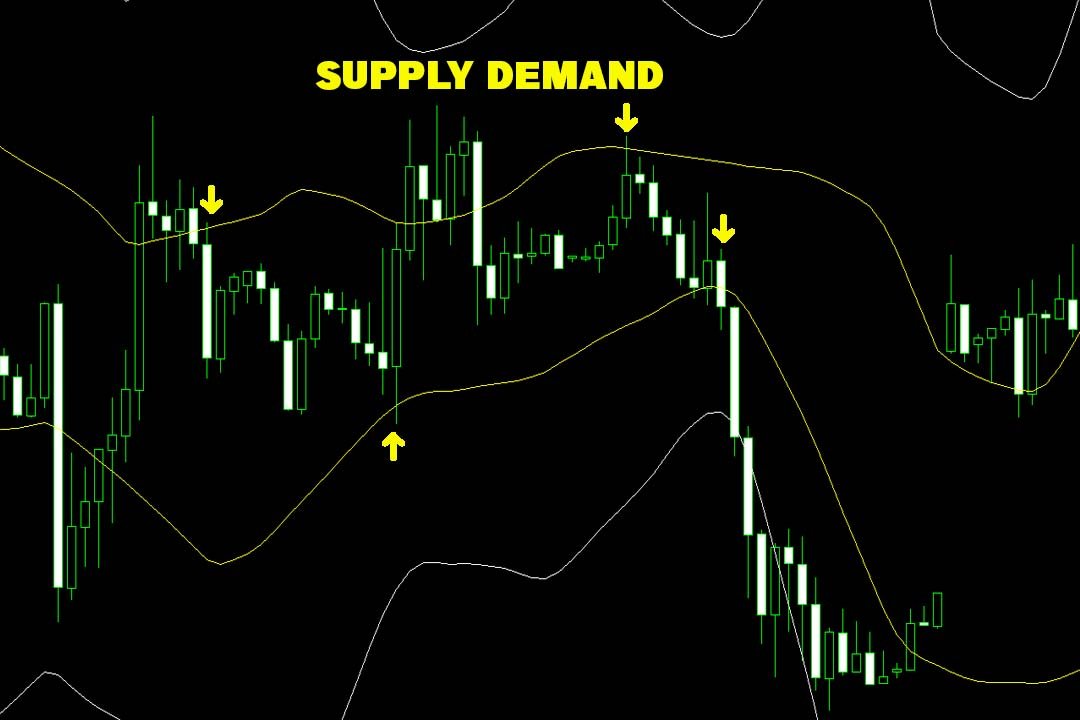
- Hide/Show 2 Supply/Demand lines.
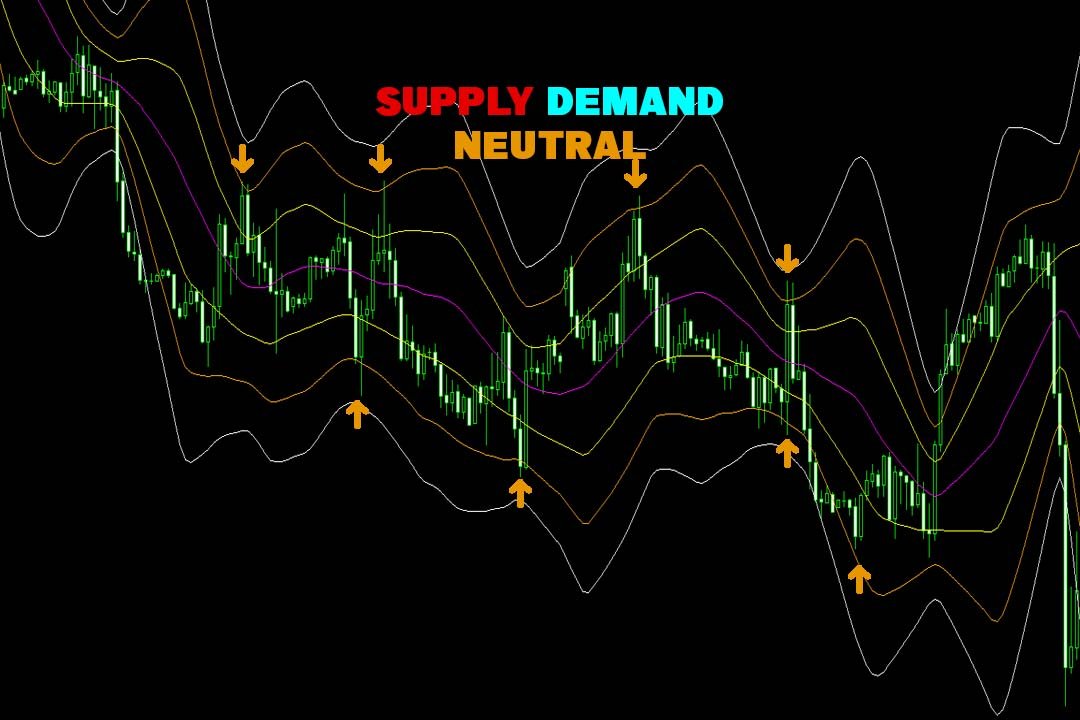
- Hide/Show 2 Neutral Supply/Demand lines.
- Hide/Show Neutral line.
- Change Color Logic All Lines.
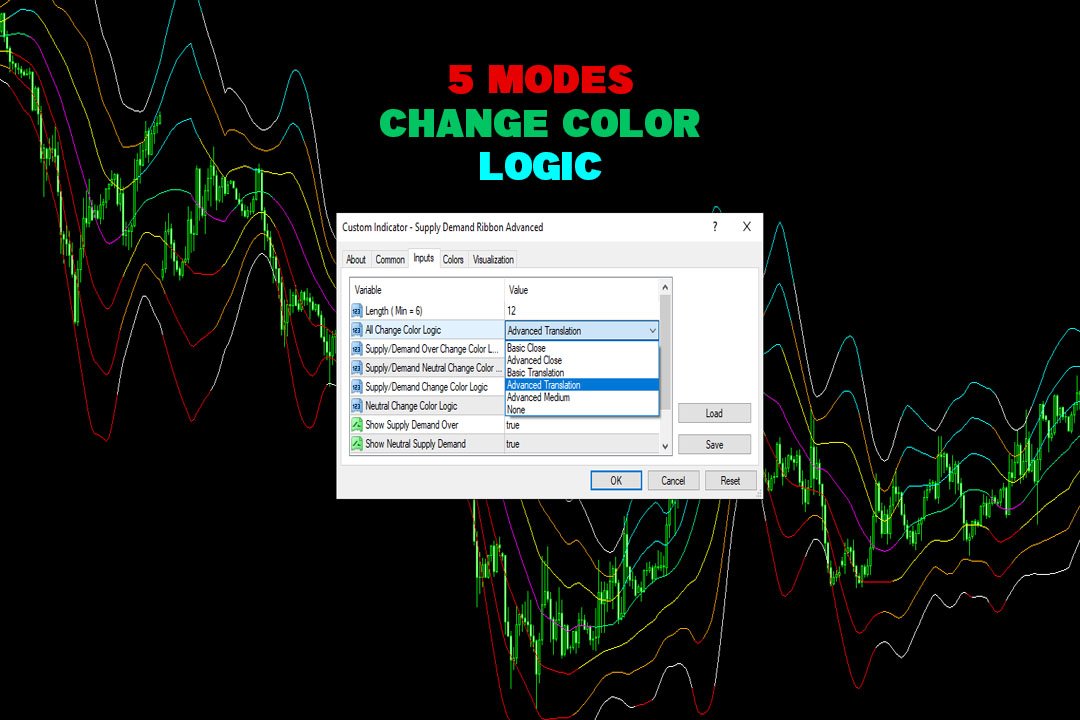
- 5 Modes Change Color Logic:
- - Basic Close
- - Advanced Close
- - Basic Translation
- - Advanced Translation
- - Advanced Medium
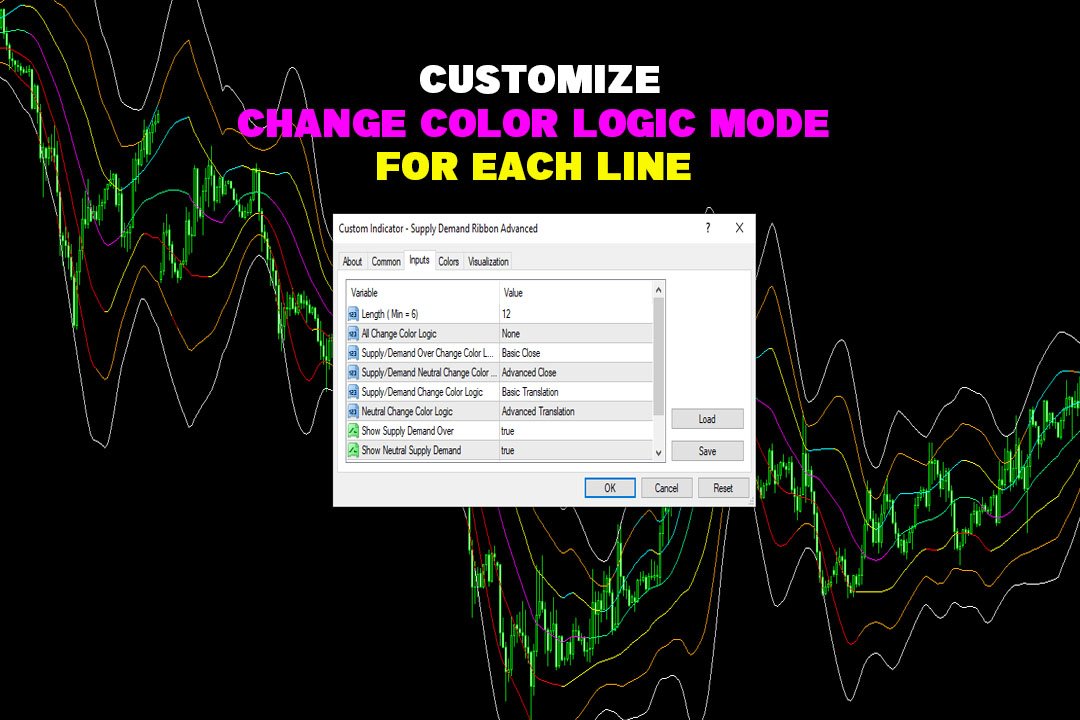
- Customize Change Color Logic mode for each line
- Hide/Show any lines you want