• 概要
  • レビュー
  • コメント

Trigger RSI

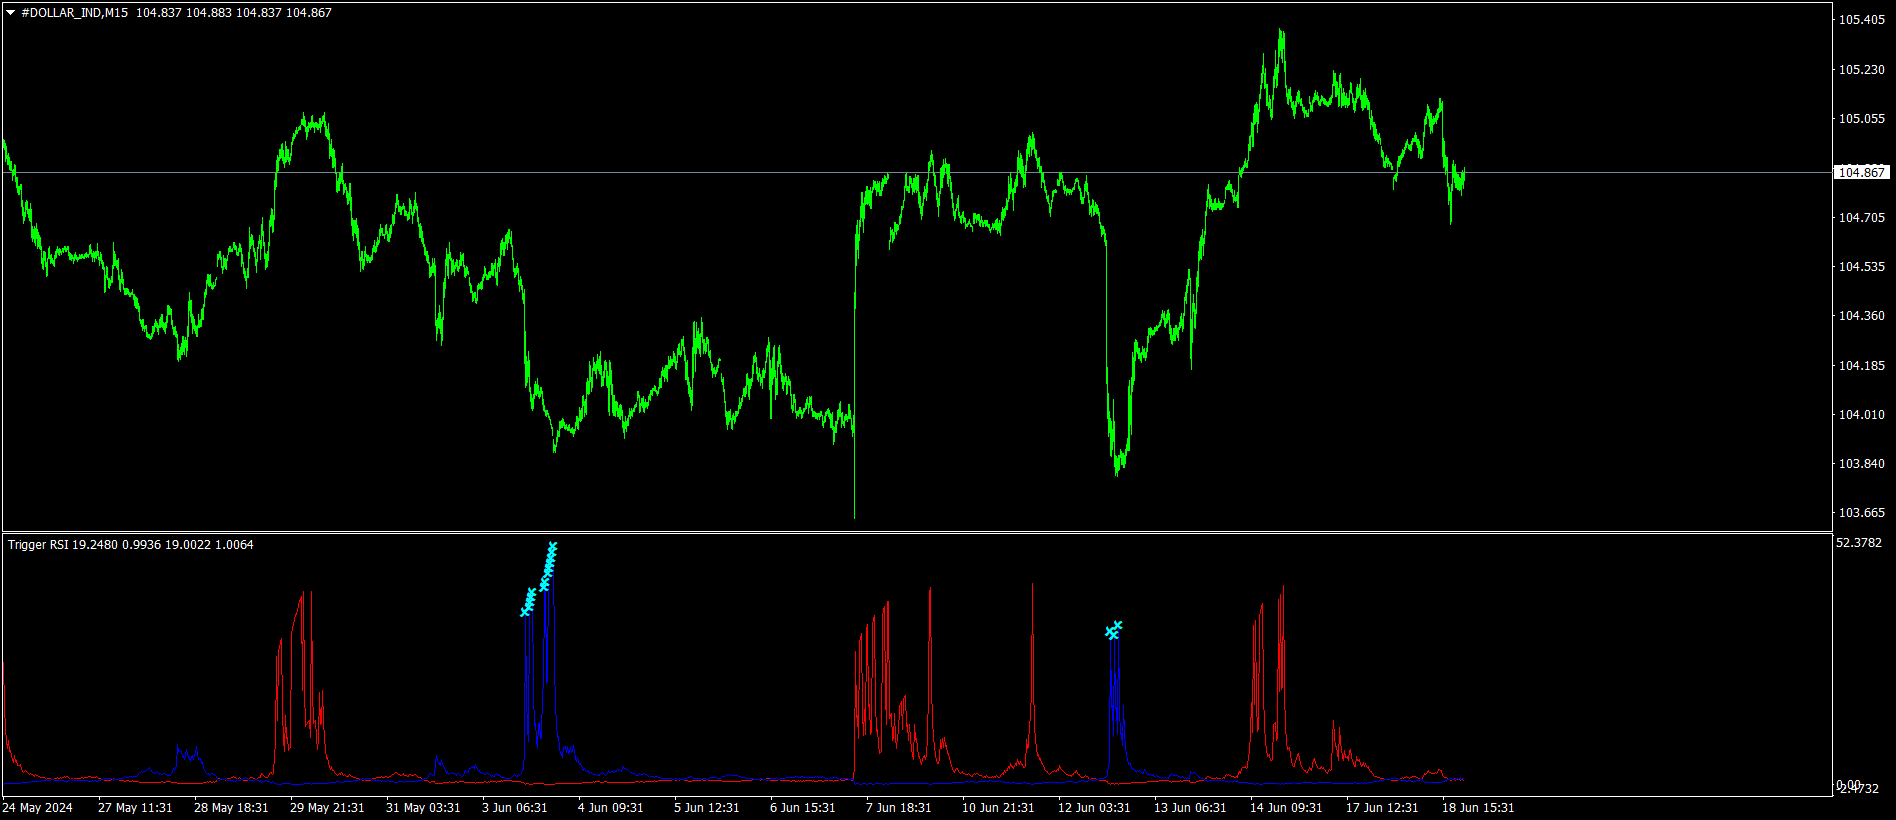
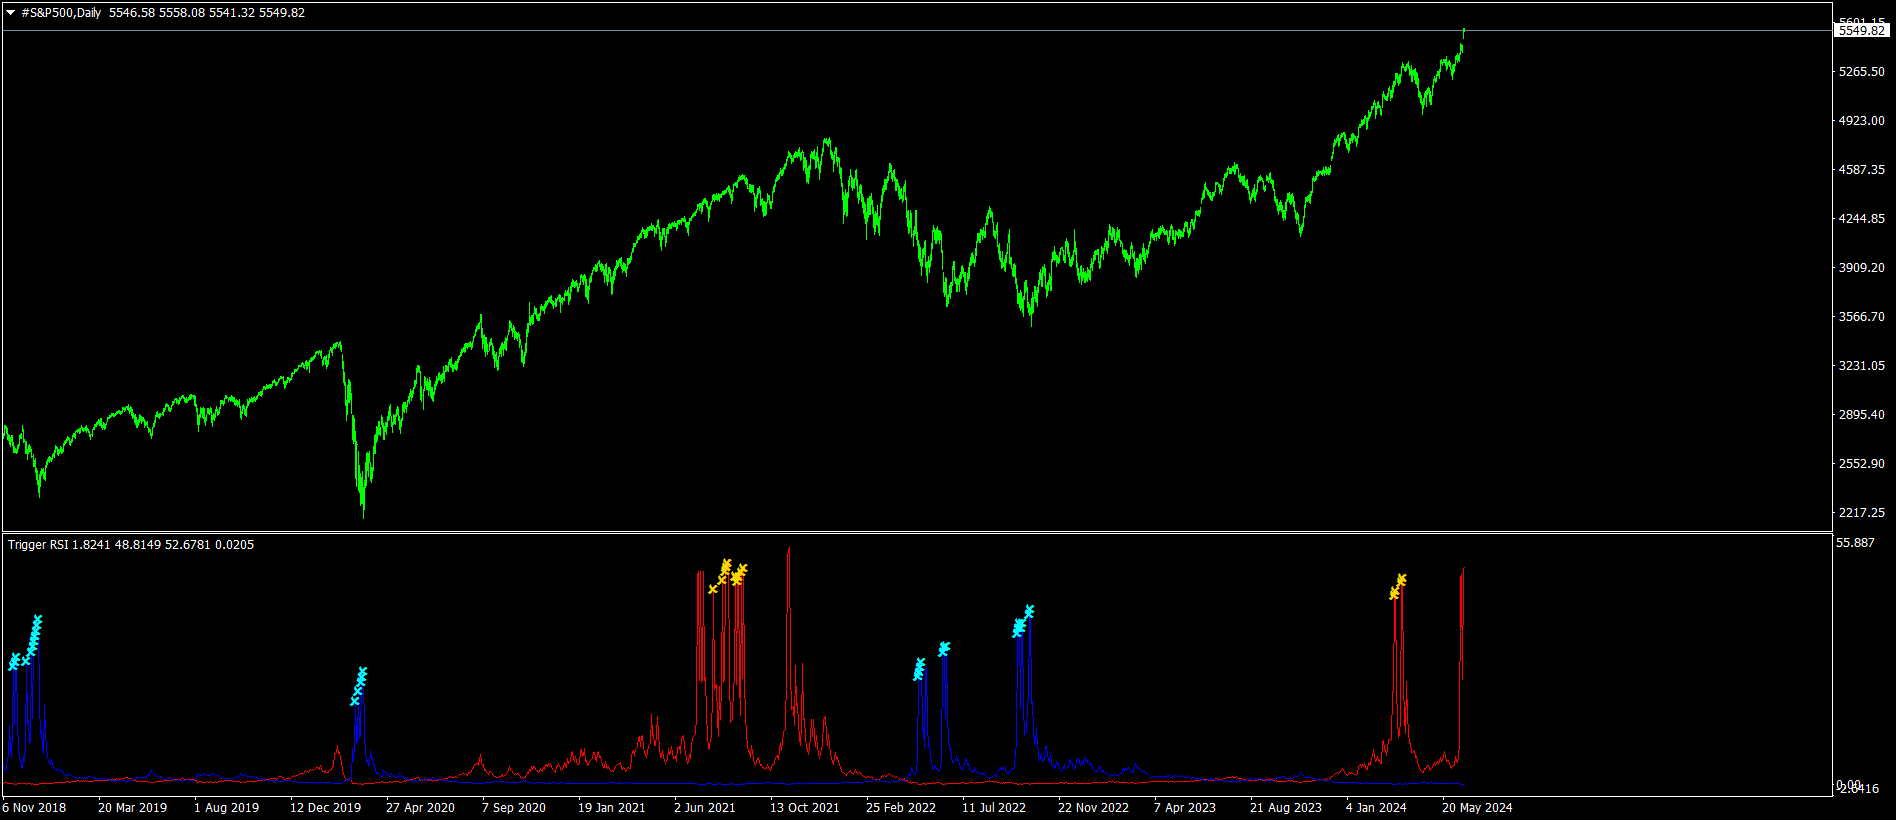
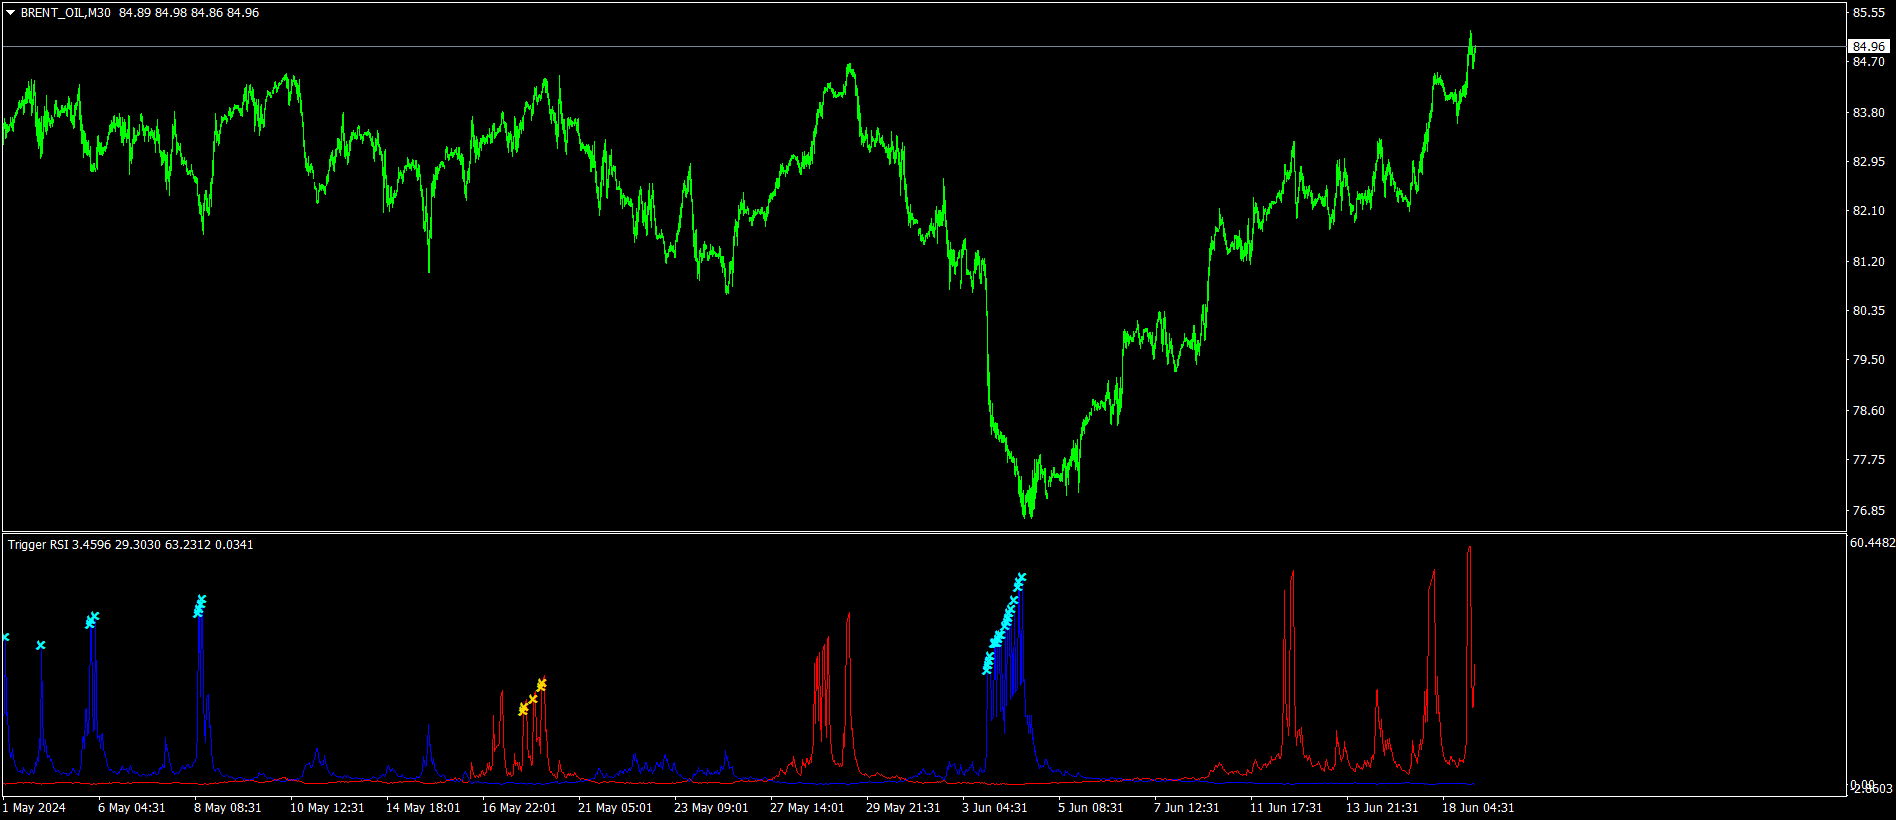
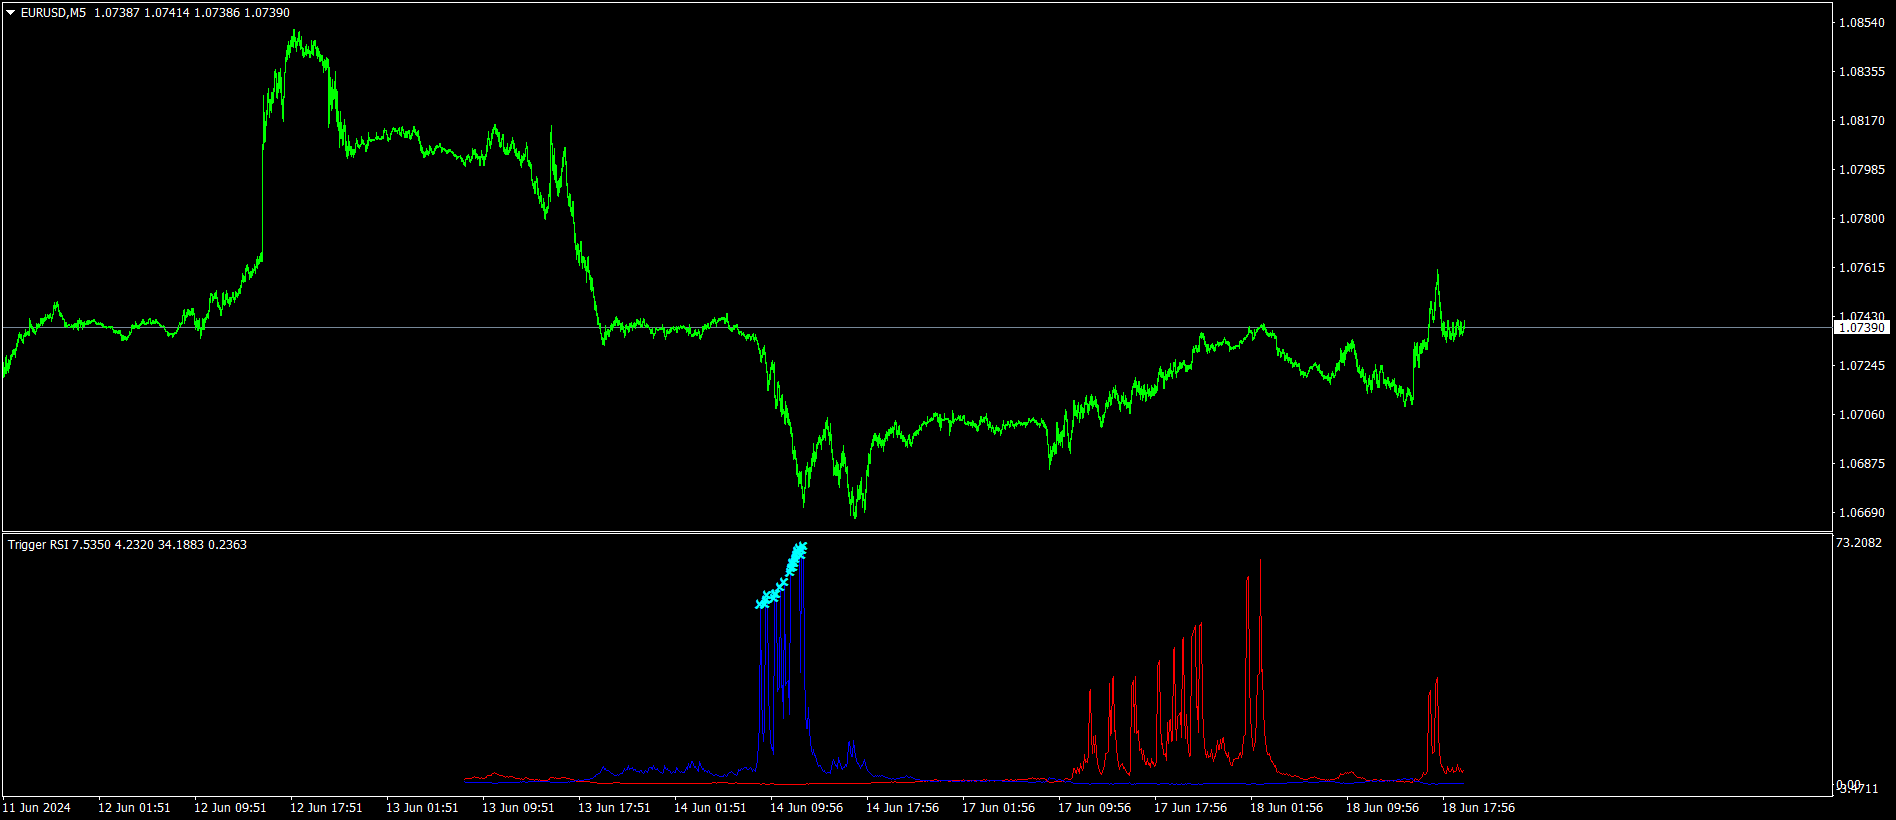
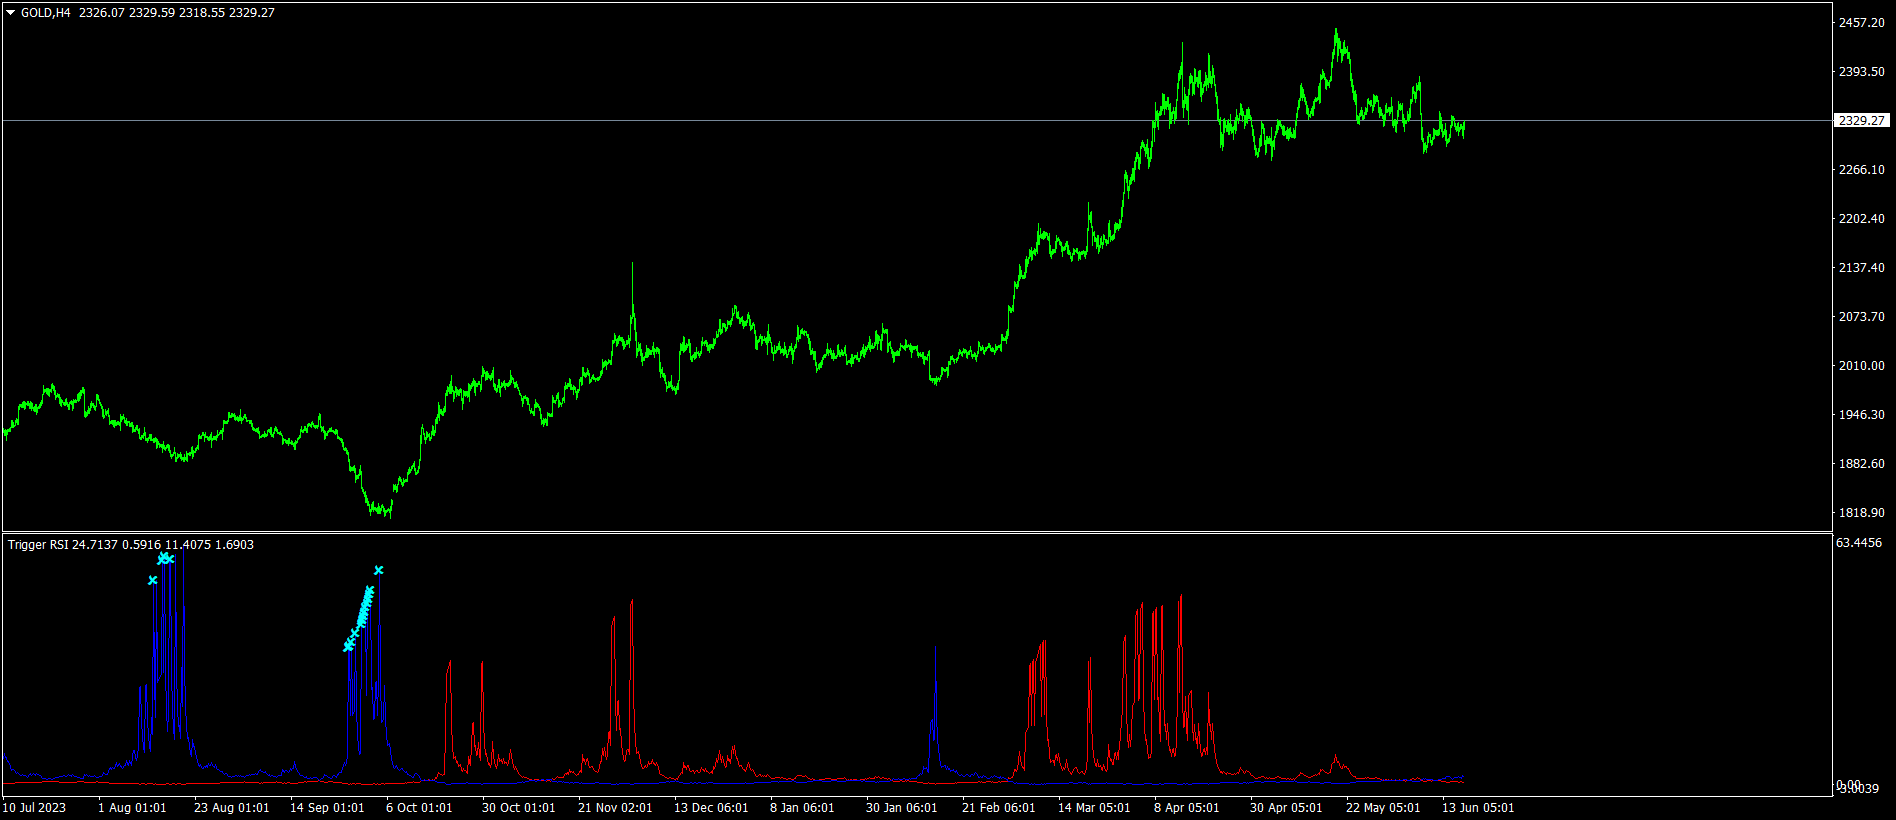
Trigger RSI is a no repaint trend indicator.

it can use all pairs and all time frames.

easy for use beginner and experienced tarders.

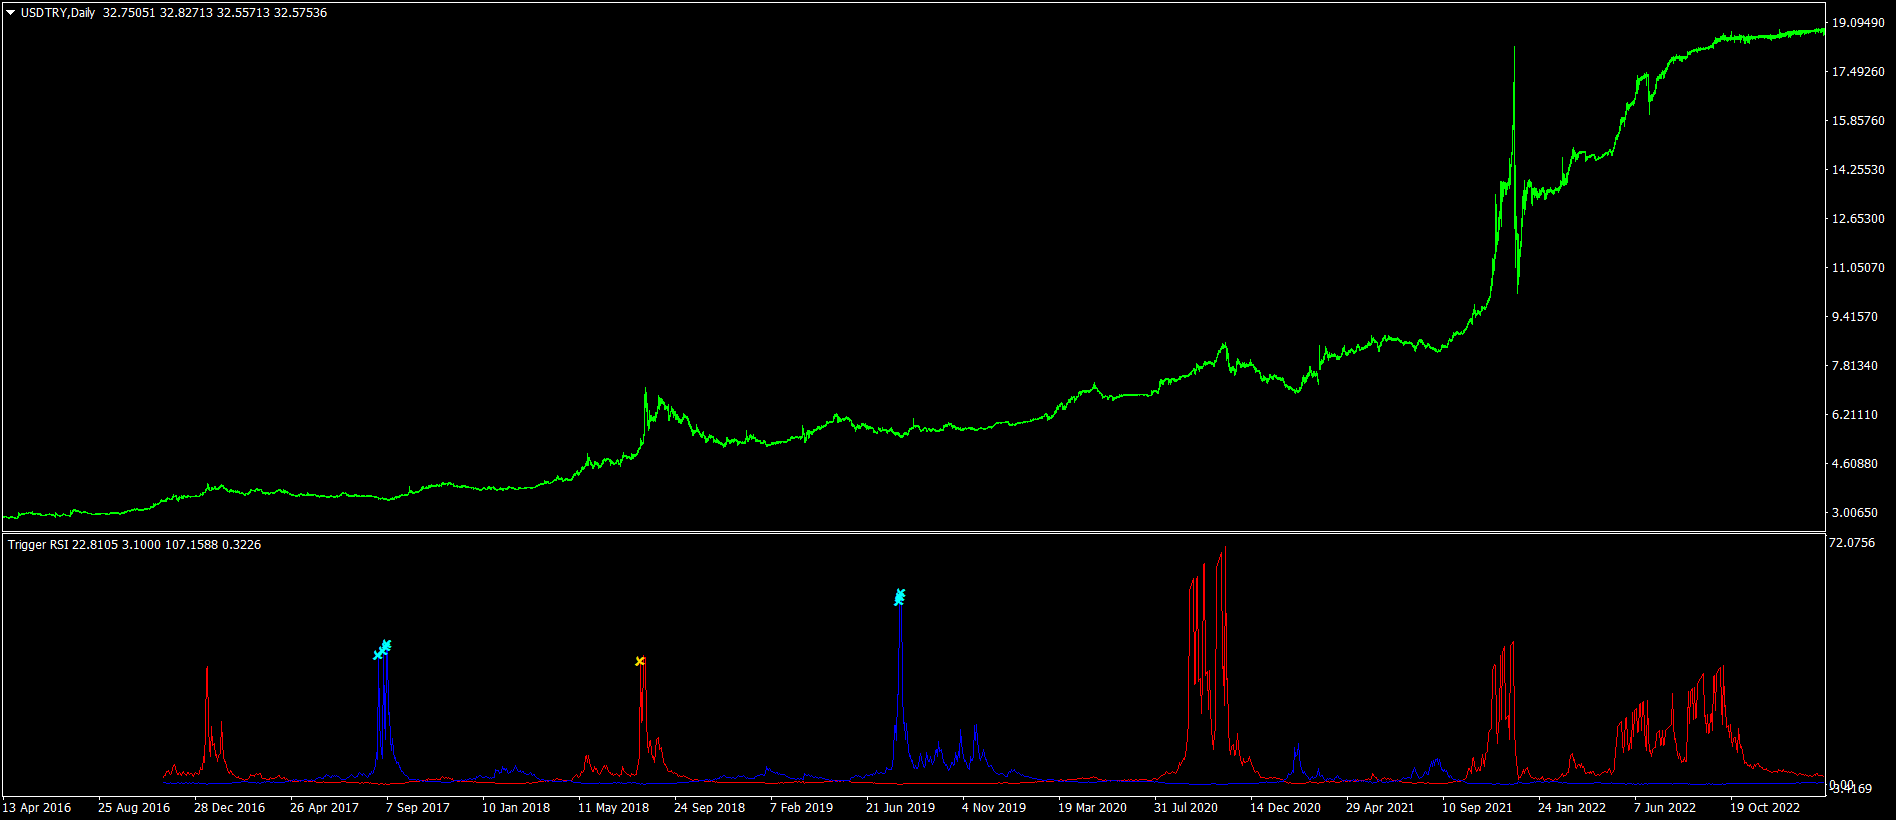
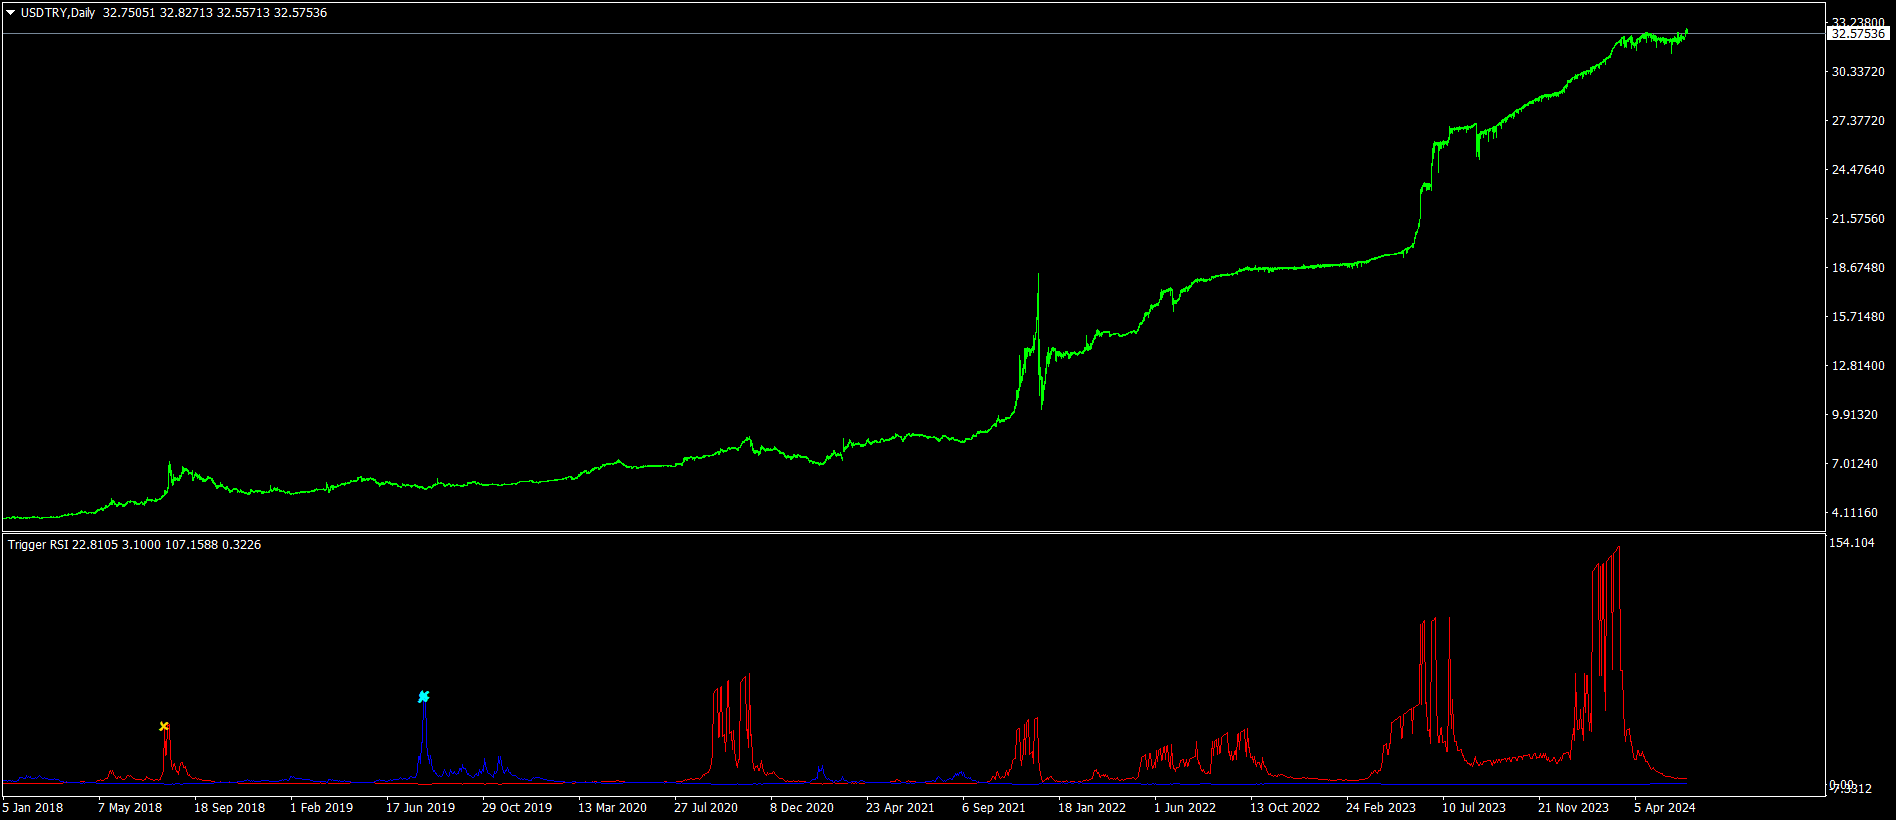
it put aqua and gold point on histograms.

if aqua point on the blue histogram that is buy signal.

if gold point on the red histogram that is sell signal.

cnt value has been set to default 1000.

you can increase it to see back signals.if there is enough bars on charts.

minimum value cnt is 500.

おすすめのプロダクト
Indicator for binary options arrow is easy to use and does not require configuration works on all currency pairs, cryptocurrencies buy signal blue up arrow sell signal red down arrow tips do not trade during news and 15-30 minutes before their release, as the market is too volatile and there is a lot of noise it is worth entering trades one or two candles from the current period (recommended for 1 candle) timeframe up to m 15 recommended money management fixed lot or fixed percentage of the depo
ROYAL DUTCH SKUNK USES THE TREND WAVE INDICATOR AND IT CAN IDENTIFY THE BEGINNING AND THE END OF A NEW WAVE TREND MOVEMENT. AS AN OSCILLATOR, THE INDICATOR IDENTIFIES THE OVERBOUGHT AND OVERSOLD ZONES. IT WORKS GREAT TO CATCH THE SHORT TERM PRICE REVERSALS AND USES A MARTINGALE STRATEGY TO CLOSE ALL TRADES IN PROFIT. USE DEFAULT SETTINGS ON H1 OR HIGHER TIME FRAME ON ANY PAIR FOR MORE ACCURATE TRADES WHY THIS EA : Smart entries calculated by 6 great strategies The EA can be run on even a $20000
Indicator which identifies Trend and also buy/sell opportunities. Use for entries aligned to the Trend.  Although Diamond Trend is very accurate identifying entry points, it is always recommended to use a support indicator in order to reconfirm the operation. Remind to look for those Assets and Timeframes which best fit to your trader behavior/need... Valid for Scalping and Long Term operations. Please, set up a Bars Chart to be able to visualize the indicator properly...  ...And remind to give
の紹介     Quantum平均足PRO チャート 市場のトレンドに対する明確な洞察を提供するように設計された平均足キャンドルは、ノイズを除去し、誤ったシグナルを排除する能力で知られています。混乱を招く価格変動に別れを告げ、よりスムーズで信頼性の高いチャート表現を導入しましょう。 Quantum Heiken Ashi PRO を真にユニークなものにしているのは、従来のローソク足データを読みやすい色のバーに変換する革新的なフォーミュラです。赤と緑のバーはそれぞれ弱気トレンドと強気トレンドをエレガントに強調し、潜在的なエントリーポイントとエグジットポイントを驚くほど正確に見つけることができます。 量子EAチャネル:       ここをクリック MT5のバージョン:       ここをクリック この注目すべき指標には、いくつかの重要な利点があります。 明確性の向上: 価格変動を平滑化することで、平均足バーは市場トレンドをより明確に表現し、有利な取引機会を特定しやすくします。 ノイズの削減: 誤ったシグナルを引き起こすことが多い不安定な価格変動に別れを告げます。 Quan
Taurusは、当社独自の実際の取引量データを活用し、すでに効果的であったMean Reversion戦略を改良するための献身的な努力の頂点を象徴しています。各シンボルを独自のベストな設定で取引し、卓越したリスク・リワード・レシオとバランスの取れたストレスのない取引体験をユーザーに提供します。 主要データ 独自のリアル出来高データに基づく平均回帰戦略 グリッド、マーチンゲール、平均化を使用しない本格的なリスク管理 28の主要なFXシンボルすべてを、それぞれの最適な設定で処理 シンボルごとに最大1トレード、常にストップロスを固定 すべてのトレーダーに適した、取引ごとに100%調整可能なリスク 100%FIFO対応 100%プロップファーム対応 リンク タウラスFAQ - クリック Taurus Chat - クリック 取引シグナル - クリック テクニカル要件 1.お願い 以下のURL をターミナルのプロパティで許可されたURLのリストに 追加して ください。 - 出来高データ用 -> https://stein.investments - ニュースモジュール -> h
This product is a part of  ON Trade Waves Patterns Harmonic Elliot Wolfe you can test free version on EURJPY from this link  Wolf Waves Indicator ウルフウェーブを発見しよう - あなたの究極の取引ツール! どんな時間軸でも簡単にウルフウェーブを見つけるための強力なツールを探していますか?もう探す必要はありません!私たちのウルフウェーブインジケーターは、その仕事を簡単にこなします。なぜこのインジケーターがあなたにぴったりか、以下でご紹介します。 主な特徴: 自動検出: ウルフウェーブインジケーターは、複雑なアルゴリズムを使用して、チャート上のキーポイントを自動的に見つけ、対応するラインを描画します。手動でパターンを探す手間が不要です。 使いやすさ: このインジケーターはシンプルなデザインで、経験豊富なトレーダーからウルフウェーブ初心者まで、誰でも簡単に利用できます。 高精度: 数多くのウルフウェーブインジケーターの中で、当社のものは完璧
This fully automated trading system is part of the Bergland signal. It features a highly efficient trading logic, and a money management system. Reasonable calculated stop loss and take profit levels. It is easy to install and do not require a special setfile. XAUUSD, M15 Live Signal: Bergland Gold You can rent the Bergland signal here. If you like my product, please write a review.
KT Renko Patterns MT4
KEENBASE SOFTWARE SOLUTIONS
2.33 (3)
KT Renko Patterns scans the Renko chart brick by brick to find some famous chart patterns that are frequently used by traders across the various financial markets. Compared to the time-based charts, patterns based trading is easier and more evident on Renko charts due to their uncluttered appearance. KT Renko Patterns features multiple Renko patterns, and many of these patterns are extensively explained in the book titled Profitable Trading with Renko Charts by Prashant Shah. A 100% automate
回帰取引を意味する専門的かつ定量的なアプローチを実装する独自の指標。これは、価格が予測可能かつ測定可能な方法で迂回して平均に戻るという事実を利用しており、非定量的な取引戦略を大幅に上回る明確な出入りルールを可能にします。 [ Installation Guide | Update Guide | Troubleshooting | FAQ | All Products ] 明確な取引シグナル 驚くほど簡単に取引できます カスタマイズ可能な色とサイズ パフォーマンス統計を実装します ほとんどの取引戦略を上回ります 適切なSLおよびTPレベルを表示します 電子メール/音声/視覚アラートを実装します 使い方 インディケータは、より高い時間枠からの完全にカスタマイズ可能な移動平均の周りの標準偏差を測定し、トレンドフォローアプローチを使用して正確に取引を見つけます。取引は、現在のチャートの価格アクションに飛び込むことによって見つけられ、価格が選択したより高い時間枠から計算された平均価格帯に戻ったときに閉じられます。それがコード化される方法のために、指標は高ボラティリティと強いトレンドの
MMM Ichimoku EA strategy: The robot uses its built in Ichimoku indicator all the time and does a calculation to determine the prices trends. If it indicates the price will be bullish, it sends a buy order. If the indicator indicates the price will be bearish, it sends a sell order; It will not send an order unless the calculations determines a good trend of profit; Like all MMM products it is also programmed to minimize your losses and protect your money from the hostile market. We have protecti
This system created by using Corrected MACD,ADX, Different time zone support and resistant points,  tree Parabolic Sars,two Bollinger band, 3 moving average, stochastic oscillator and ADX. In this system, Using parabolic Sars reverse bar count,  Pips difference between closing price and last parabolic Sars in the direction of signal and Trend strength.   Note that this system is not martingale, this system is creating limit order.    Best result for the orders are 45 Pips in USD, 75 Pip
Trend Chase is an indicator that generates trade arrows. It generates trade arrows with its own algorithm. These arrows give buying and selling signals. The indicator certainly does not repaint. The point at which the signal is given does not change. You can use it in all graphics. You can use it in all pairs. This indicator shows the input and output signals as arrows and alert. When sl_tp is set to true, the indicator will send you the close long and close short warnings. It tells you that you
This is a new strategy for SUPPLY DEMAND areas It is based on a calculation using the tick volume to detect the big price action in market for both bear /bull actions this smart volume action candles are used to determine the supply and demand areas prices in between main supply and demand lines indicate sideway market  up arrows will be shown when prices moves above the main supply and the secondary supply lines Down arrows will be shown when prices moves below the main demand and the secondary
これは、キャンドルの終値を予測する指標です。 このインジケータは、主にD1チャートでの使用を目的としていますが. この指標は、従来の外国為替取引とバイナリオプション取引の両方に適しています。 インジケーターは、スタンドアロンのトレーディングシステムとして使用することも、既存のトレーディングシステムへの追加として機能させることもできます。 このインジケーターは、現在のキャンドルを分析し、キャンドル自体の内部の特定の強度係数と、前のキャンドルのパラメーターを計算します。 したがって、この指標は、市場の動きのさらなる方向性と現在のキャンドルの終値を予測します。 この方法のおかげで、この指標は、短期の日中取引だけでなく、中期および長期の取引にも適しています。 インジケーターを使用すると、市場の状況の分析中にインジケーターが生成する潜在的な信号の数を設定できます。 インジケーターの設定には、このための特別なパラメーターがあります。 また、インジケーターは、チャート上のメッセージの形式で、電子メールで、およびPUSH通知の形式で、新しい信号について通知することができます。 購入後は必ず私に書いて
The EA can trade multiple currencies. Please check our signals ( https://www.mql5.com/en/users/ugur-edin/seller ) for detailed information. No grid or martingale! No manual configuration or adjustment needed! Every trade is protected by stop loss. This Expert Advisor only trades for a short time frame at night, during the ending of the New York session. It uses low volatility moments and enters trades based on indicators. It then manages those trades with dynamic stop losses and take profits als
Matrix Arrow EA MT4
Juvenille Emperor Limited
5 (8)
マトリックスアローEAMT4 は、 マトリックスアローインジケーターのMT4 シグナルをチャート上のトレードパネルと手動または100%自動でトレードできるユニークなエキスパートアドバイザーです。 マトリックスアローインジケーターMT4 は、初期段階で現在のトレンドを判断し、最大10の標準インジケーターから情報とデータを収集します。 平均方向移動指数(ADX) 商品チャネルインデックス(CCI) クラシック平研アシキャンドル 移動平均 移動平均収束発散(MACD) 相対活力指数(RVI) 相対力指数(RSI) 放物線SAR ストキャスティクス ウィリアムズのパーセント範囲 すべてのインジケーターが有効な買いまたは売りシグナルを与えると、対応する矢印がチャートに印刷され、次のろうそく/バーの開始時に強い上昇トレンド/下降トレンドを示します。ユーザーは、使用するインジケーターを選択し、各インジケーターのパラメーターを個別に調整できます。 Matrix Arrow EA MT4 を使用すると、チャートのトレードパネルから直接、または100%アルゴリズム取引オプションを使用して100%自動的に
The indicator shows buy or sell on the screen when it catches a signal with its own algorithm. The arrows warn the user to buy or sell. Pairs: USDCHF, AUDUSD, USDJPY, GBPJPY, EURUSD, GBPUSD, EURCHF, NZDUSD, EURCHF and EURJPY. You can test the indicator and choose the appropriate symbols. The best results are on M30. Parameters AlertsOn - send alerts AlertsMessage - send a message AlertsSound - sound alert AlertsEmail - email alert Buy color - buy color Sell color - sell color
Strong Retracement Points Pro demo edition! SRP (Strong Retracement/Reversal Points) is a powerful and unique support and resistance indicator. It displays the closest important levels which we expect the price retracement/reversal! If all level are broken from one side, it recalculates and draws new support and resistance levels, so the levels might be valid for several days depending on the market! If you are still hesitating to start using this wonderful tool, you can check this link to see h
| Fully-automated Smart Money Concept (ICT) inspired trading solution with multi-strategy capabilities | Built by a grid trader >> for grid traders.  This is MT4 version, click  here  for  Blue CARA MT5  (settings and logics are same in both versions)     Real monitoring signal  -->  Cara Gold Intro Blue CARA EA   ('CARA') - short for  C omprehensive  A lgorithmic R esponsive A dvisor is a next-gen  multi-currency    multi-timeframe  EA base on the widely known (and perhapse most popular) Inn
Awesome Oscillator by Bill Williams with the ability to fine-tune and replace the averaging algorithms of the indicator, which significantly expands the possibilities of using this oscillator in algorithmic trading and brings it closer in its properties to such an indicator as the MACD. To reduce price noise, the final indicator is processed with an additional Smooth averaging. The indicator has the ability to give alerts, send mail messages and push signals when the direction of movement of th
The   Strategy Tester   product is an indicator where you can both test and run strategies. There are 64 strategies in total in this indicator. It uses 3 indicators. You can test tens of thousands of strategies by changing the parameter settings of these indicators. You can run 6 strategies at the same time. With this product, you will now create your own signals. Recommendations and Features Used indicators:   Rsi, Bears power, Stochastic It works on all   time frame   Recommended time frame
こんにちはん, 外国為替で安全に取引するためには、必要なのは"pro intraday trading"インジケータだけです。 Decemberインジケータは、あなたが設定した時間間隔でこの楽器の"一日の最低値と最高値"を分析することにより、"安全な買い/売り"ポイントを検出し、即座にあな これは、安全な購入ポイントとして購入1dec購入2チャネル(2ブルーライン購入ゾーン)を提供しています。 単式ホーム1面2線を有する地上駅(2面2線)で、地上駅としての機能を有する地上駅である。 これは、"待機ゾーン"と呼ばれる"最初のピンクのラインと最初の青いラインの間"の安全な取引チャネル間の入札をデカップリングします。 処理を開始するには、"安全な購入または安全な販売ゾーン"への入力を待つだけです。 リスクの理解に応じて、これらのチャネル内で段階的な取引を行います。 日々の戦略: https://charts.mql5.com/28/972/btcusd-m30-hizlifx-trading-ltd-3.png 表示設定 : Youtub
MT4 Universal Panel pro   ex4ファイルを含むすべてのインジケーターとタイムフレーム用に設計されています。 それはあなたのコンピュータのパワーと最大10の時間枠に基づいて無制限のペアをスキャンすることができます。パネルのサイズは自動的に配置されます。 バッファによって任意のインジケータを呼び出すことができます。 これは、すべてのデフォルトおよびカスタムインジケーターで機能します。平観足、rsi、放物線、練行足、フラクタル、サポート抵抗、需給、発散、高値と安値の移動平均に簡単に使用できます。 すべての通貨に対して1つのウィンドウから操作できます。設定についてご不明な点がございましたらお問い合わせください。 これはmt4ダッシュボードであり、どのペアでも機能します。ペア名は以下のように入力するだけです。それは任意の外国為替インジケーターを呼び出し、そのシグナルバーをチェックします。 NS。パネル作業を行い、3ペアと複数の時間枠のみをスキャンする場合は、次のように入力します。 記号:EURUSD、GBPUSD、USDJPY タイム
Gvs Undefeated Trend   indicator is designed for trend and signal trading. This indicator generates trend signals.  It uses many algorithms and indicators to generate this signal. It tries to generate a signal from the points with the highest trend potential. This indicator is a complete trading product. This indicator does not need any additional indicators.  You can only trade with this indicator. The generated signals are displayed on the graphical screen.  Thanks to the alert features you ca
TPO Profile MT4
Kyra Nickaline Watson-gordon
5 (1)
Definition : TPO is a Time Price Opportunity. Instead of using bars or candles with an Open, High, Low, and Close price, each "bar" in a Market Profile is represented by horizontal bars against the price It is called Market Profile terminology. In other words time-price-opportunity (TPO) profiles are histograms of how much time was spent at each price within the span of the profile. By using a TPO chart, you are able to analyze the amount of trading activity, based on time, for each price lev
Harvest GOLD USES THE TREND WAVE INDICATOR AND IT CAN IDENTIFY THE BEGINNING AND THE END OF A NEW WAVE TREND MOVEMENT. AS AN OSCILLATOR, THE INDICATOR IDENTIFIES THE OVERBOUGHT AND OVERSOLD ZONES. IT WORKS GREAT TO CATCH THE SHORT TERM PRICE REVERSALS AND USES A MARTINGALE STRATEGY TO CLOSE ALL TRADES IN PROFIT. USE DEFAULT SETTINGS ON H1 OR HIGHER TIME FRAME ON ANY PAIR FOR MORE ACCURATE TRADES WHY THIS EA : Smart entries calculated by 3 great strategies The EA can be run on even a $
数列の一つに「森林火災数列」があります。これは、最も美しい新しいシーケンスの 1 つとして認識されています。その主な特徴は、このシーケンスが線形トレンドを回避することです。最短のものであってもです。この指標の基礎を形成したのはこのプロパティです。 財務時系列を分析する場合、この指標は可能なすべての傾向オプションを拒否しようとします。そして失敗した場合にのみ、トレンドの存在を認識し、適切なシグナルを発します。このアプローチにより、新しいトレンドの始まりの瞬間を正しく判断できます。ただし、偽陽性の可能性もあります。それらの数を減らすために、このインジケーターに追加のフィルターが追加されました。新しいバーが開くとシグナルが生成されます。いずれの場合も再描画は発生しません。 指標パラメータ: Applied Price - 適用価格定数; Period Main - インディケータのメイン期間、その有効な値は 5 ~ 60 です。 Period Additional - 追加の期間。このパラメーターの有効な値は 5 ~ 40 です。 Signal Filter - 追加の信号フィルター、有効
True Super Arrows is a powerful and versatile indicator that can help you identify and trade profitable trends. The indicator uses a combination of technical indicators to generate arrows that point to the direction of the trend. Features: Multiple trend identification methods:   The indicator uses a combination of moving averages, trend lines, and other indicators to identify trends. Accurate trend direction:   The indicator uses a variety of techniques to ensure that the arrows are pointing in
エルメス スペシャリストは、ロボット自身の傾向と戦略を操作することを目的としたメタ トレーダー用のロボットです。 エルメス ゴールド プロを無料でインストールしてアカウントに操作してください。プライベート メッセージをください。 タイムフレームの使用に関する推奨事項: H1 エルメスはアメリカの金属であるXAUUSD(ゴールド)を扱うために開発されました。 エルメスはアサーティブ スキャルピングの長期エキスパートであるため、「リスク (設定)」の値に応じて、取引せずに 1、2、3 日間滞在することができますが、それについては心配しないで、以下をお読みください。 エントリーとスキャルピング(ショート)クローズの積極性により、低ドローダウン/またはゼロドローダウン(標準設定)に優れた能力を備えています。 アカウントに エルメス を残しておくこともできますし、別の専門家 (ロボット) を呼んで作業してもらうこともできます。問題はありません。 リスクの高い構成 (構成値が低い) を使用しないように注意してください。説明します。 ロボットの設定には次のものがあります。
Advanced Stochastic Scalper - is a professional indicator based on the popular Stochastic Oscillator. Advanced Stochastic Scalper is an oscillator with dynamic overbought and oversold levels, while in the standard Stochastic Oscillator, these levels are static and do not change. This allows Advanced Stochastic Scalper to adapt to the ever-changing market. When a buy or a sell signal appears, an arrow is drawn on the chart and an alert is triggered allowing you to open a position in a timely mann
このプロダクトを購入した人は以下も購入しています
Gann Made Easy は、ミスター・ギャンの理論を使用した取引の最良の原則に基づいた、プロフェッショナルで使いやすい外国為替取引システムです。 W・D・ガン。このインジケーターは、ストップロスとテイクプロフィットレベルを含む正確な買いと売りのシグナルを提供します。 PUSH通知を利用して外出先でも取引可能です。 購入後はご連絡ください!私の取引のヒントと素晴らしいボーナスインジケーターを無料で共有します! おそらく、ギャンの取引手法についてはすでに何度も聞いたことがあるでしょう。通常、ギャンの理論は初心者のトレーダーだけでなく、すでにある程度の取引経験がある人にとっても非常に複雑なものです。なぜなら、ギャンの取引手法は理論的にはそれほど簡単に適用できるものではないからです。私はその知識を磨き、最良の原則を私の外国為替インジケーターに組み込むために数年を費やしました。 このインジケーターは非常に簡単に適用できます。必要なのは、それをチャートに添付し、簡単な取引推奨事項に従うだけです。このインジケーターは常に市場分析の仕事を行い、取引の機会を探します。適切なエントリーポイントを検出
Gold Stuff
Vasiliy Strukov
4.9 (270)
Gold Stuff は、金専用に設計されたトレンド指標であり、あらゆる金融商品にも使用できます。 インジケーターは再描画せず、遅れません。 推奨時間枠 H1. それインディケータでフルオートExpert Advisor EA Gold Stuffが動作します。 あなたは私のプロフィールでそれを見つけることができます. 設定と個人的なボーナスを得るために、購入後すぐに私に連絡してください! トレンド スキャナーの強力なサポートを利用して、無料のインジケーターを入手し、プライバシーを守ります。あーみー!   設定 矢印を描く - オンオフ。 チャートに矢印を描く。 アラート - 可聴アラートのオンオフ。 メール通知 - オンオフ。 電子メール通知。 プチ通知 - オンオフ。 プッシュ通知。 次に、色域を調整します。 Gold Stuff は、金専用に設計されたトレンド指標であり、あらゆる金融商品にも使用できます。 インジケーターは再描画せず、遅れません。 推奨時間枠 H1. それインディケータでフルオートExpert Advisor EA Gold Stuff
Trend Punch
Mohamed Hassan
4.91 (23)
This indicator is unstoppable when combined with our other indicator called  Support & Resistance . After purchase, send us a message and you will get it   for  FREE as a BONUS! Introducing Trend Punch , the revolutionary forex trend indicator that will transform the way you trade! Trend Punch is uniquely designed to provide precise buy and sell arrows during strong market trends, making your trading decisions clearer and more confident. Whether you're trading major currency pairs or exotic sym
製品を購入する前に、以下の情報をお読みください。 Apollo Pips PLUS SP はユニークな製品です。これは、私の新しい「アポロ ピップス」インジケーターと、私のすべての取引インジケーターにアクセスできる「スーパー パック」ボーナスを手に入れたい人のためのものです。 Apollo Pips PLUS SP 製品を購入すると、実際には私の Apollo Pips インジケーターのまったく新しいバージョンを購入することになります。このバージョンのインジケーターには改良されたアルゴリズムと使いやすいパラメーターがあり、あらゆる市場およびあらゆる取引スタイルでインジケーターを使用する機会が得られます。 この製品の購入者は、私のスーパーボーナスとして、他のすべてのインジケーターにも無料でアクセスできます!私のすべての取引ツールにアクセスしたい場合は、この製品が最適です!:) しかし、これがすべてではありません!:) この製品のすべての購入者は、私の新しいインジケーターを無料で入手する資格もあります!:)新しい取引インジケーターを利用できるようになりました。私の特権のある「スーパー パッ
An exclusive indicator that utilizes an innovative algorithm to swiftly and accurately determine the market trend. The indicator automatically calculates opening, closing, and profit levels, providing detailed trading statistics. With these features, you can choose the most appropriate trading instrument for the current market conditions. Additionally, you can easily integrate your own arrow indicators into Scalper Inside Pro to quickly evaluate their statistics and profitability. Scalper Inside
Please contact me after purchase to immediately get your PDF strategy + documentation for Trend Pulse !  Official release price of $89  (2 /50 copies left). Next price is $199 . Introducing Trend Pulse , a unique and robust indicator capable of detecting bullish, bearish, and even ranging trends! Trend Pulse uses a special algorithm to filter out market noise with real precision. If the current symbol is moving sideways, Trend Pulse will send you a ranging signal, letting you know that it'
mql5と Telegramの モーニング・ブリーフィングで、詳細とスクリーンショットを含む毎日のマーケット・アップデートをご覧 ください! FX Power MT4 NGは 、長年の人気を誇る通貨強度計FX Powerの次世代モデルです。 この次世代ストレングスメーターは何を提供するのでしょうか?初代FXパワーの魅力すべて プラス GOLD/XAUの強さ分析 より正確な計算結果 個別に設定可能な分析期間 カスタマイズ可能な計算上限値により、さらに優れたパフォーマンスを実現 もっと見たい人のための特別なマルチインスタンス設定 すべてのチャートでお好みの色を無限に設定可能 数え切れないほどの通知オプションにより、重要なことを見逃すことはありません。 Windows 11とmacOSのスタイルで角を丸くした新しいデザイン 魔法のように動くインジケーターパネル FXパワーの主な機能 すべての主要通貨の強さの完全な履歴 すべての時間枠における通貨の強さの履歴 すべてのブローカーとチャートで同一の計算結果 100%信頼できるリアルタイム計算 -> リペイントなし ドロップダウン・リストから
TPSpro TREND PRO は 、市場を自動的に分析し、トレンドとその各変化に関する情報を提供し、再描画せずに取引に参加するためのシグナルを提供するトレンド指標です。 インディケータは各ローソク足を使用し、個別に分析します。さまざまなインパルス(アップまたはダウンインパルス)を指します。通貨、仮想通貨、金属、株、指数の取引への正確なエントリーポイント! バージョンMT5                   インジケーターの完全な説明   インジケーター -   RFI LEVELS と併用することをお勧めします。 主な機能: レンダリングなしで正確な入力信号! シグナルが表示された場合、それは関連性を維持します。これは、シグナルを提供してからそれを変更する可能性があり、入金時の資金の損失につながる可能性があるリドローインジケーターとの重要な違いです。より高い確率と精度で市場に参入できるようになりました。矢印が表示された後、ターゲットに達する (利益確定) か反転シグナルが表示されるまで、ローソク足を色付けする機能もあります。 STOP LOSS / TAKE PROFIT
まず第一に、この取引インジケーターは再描画されず、再描画されず、遅延しないことを強調する価値があります。これにより、手動取引とロボット取引の両方に理想的なものになります。 ユーザーマニュアル:設定、入力、戦略。 アトミックアナリストは、価格の強さとモメンタムを利用して市場でより良いエッジを見つけるためのPA価格アクションインジケーターです。ノイズや誤ったシグナルを除去し、取引ポテンシャルを高めるための高度なフィルターを備えています。複雑なインジケーターの複数のレイヤーを使用して、アトミックアナリストはチャートをスキャンし、複雑な数学的計算をシンプルなシグナルと色に変換します。これにより、どのような初心者トレーダーでも理解して使用し、一貫した取引の決定を行うことができます。 「アトミックアナリスト」は、新規および経験豊富なトレーダー向けにカスタマイズされた包括的な取引ソリューションです。プレミアムインジケーターとトップノッチの機能を1つの取引戦略に組み合わせ、すべてのタイプのトレーダーにとって汎用性のある選択肢にします。 デイリートレーディングとスキャルピング戦略:高
Trend Screener
STE S.S.COMPANY
4.82 (92)
トレンドインジケーター、1つのツールに組み込まれたすべての重要なトレンド機能を備えたトレンドトレーディングとフィルタリングのための画期的なユニークなソリューション! これは、すべてのシンボル/商品(外国為替、商品、暗号通貨、インデックス、株式)で使用できる100%再描画されていないマルチタイムフレームおよびマルチ通貨インジケーターです。 トレンドスクリーナーは、チャート内のドットで矢印トレンドシグナルを提供するインジケーターに続く効率的なインジケーターです。 トレンド分析インジケーターで使用できる機能: 1.トレンドスキャナー。 2.最大利益分析を備えたトレンドライン。 3.トレンド通貨強度メーター。 4.アラート付きのトレンド反転ドット。 5.アラート付きの強いトレンドドット。 6.トレンド矢印 毎日の分析例、毎日のシグナルパフォーマンス...など、トレンドスクリーナーインジケーターを使用して、ここで見つけることができます: ここをクリックしてください 期間限定オファー:トレンドスクリーナーインジケーターは、50ドルと生涯でのみご利用いただけます。 (元の価格125 $) MQ
Gold Channel is a volatility-based indicator, developed with a specific timing algorithm for the XAUUSD pair, which consists of finding possible corrections in the market. This indicator shows two outer lines, an inner line (retracement line) and an arrow sign, where the theory of the channel is to help identify overbought and oversold conditions in the market. The market price will generally fall between the boundaries of the channel. If prices touch or move outside the channel it is a tra
通貨強さウィザードは、取引を成功させるためのオールインワン ソリューションを提供する非常に強力な指標です。このインジケーターは、複数の時間枠のすべての通貨のデータを使用して、このまたはその外国為替ペアのパワーを計算します。このデータは、使いやすい通貨インデックスと通貨パワーラインの形式で表され、特定の通貨のパワーを確認するために使用できます。 必要なのは、取引したいチャートにインジケーターを接続することだけです。インジケーターは、取引する通貨の実際の強さを示します。このインジケーターは、トレンドに合わせて取引するときに有利に利用できる売買高の圧力の極値も示します。このインジケーターには、フィボナッチに基づく可能なターゲットも表示されます。 このインジケーターは、PUSH 通知を含むあらゆるタイプのアラートを提供します。 購入後ご連絡下さい。私の取引のヒントをあなたと共有し、素晴らしいボーナスインジケーターを無料で提供します! 幸せで有益な取引をお祈りします。
現在20%OFF! 初心者やエキスパートトレーダーのためのベストソリューション! このダッシュボードソフトウェアは、28の通貨ペアで動作しています。それは私達の主要な指標(高度な通貨の強さ28と高度な通貨インパルス)の2に基づいています。それは全体の外国為替市場の大きい概観を与えます。それは、すべての(9)時間枠で28の外国為替ペアのための高度な通貨の強さの値、通貨の動きの速度と信号を示しています。チャート上で1つのインディケータを使用して市場全体を観察し、トレンドやスキャルピングの機会をピンポイントで見つけることができたら、あなたのトレードがどのように改善されるか想像してみてください。 このインディケータには、強い通貨と弱い通貨の識別、潜在的な取引の識別と確認がより簡単になるような機能が搭載されています。このインディケータは、通貨の強さや弱さが増加しているか減少しているか、また、すべての時間枠でどのように機能しているかをグラフィカルに表示します。 新機能として、現在の市場環境の変化に適応するダイナミックなマーケットフィボナッチレベルが追加され、すでに当社のAdvan
- Real price is 80$ - 40% Discount ( It is 49$ now ) Contact me for instruction, any questions! Introduction The breakout and retest strategy is traded support and resistance levels. it involves price breaking through a previous level.  The break and retest strategy is designed to help traders do two main things, the first is to avoid false breakouts. Many false breakouts start with a candlestick that breaks out of a level but ends with an immediate candlestick that brings the price back into t
PZ Day Trading
PZ TRADING SLU
3.67 (3)
このインディケータは、価格アクション分析とドンチャンチャネルのみを使用して、ジグザグ方式で価格の反転を検出します。再描画やバックペインティングを一切行わずに、短期取引向けに特別に設計されています。それは彼らの操作のタイミングを増やすことを目指している賢明なトレーダーにとって素晴らしいツールです。 [ インストールガイド | 更新ガイド | トラブルシューティング | よくある質問 | すべての製品 ] 驚くほど簡単に取引できます すべての時間枠で価値を提供します 自己分析統計を実装します 電子メール/音声/視覚アラートを実装します 可変長のブレイクアウトと混雑ゾーンに基づいて、インディケータは価格アクションのみを使用して取引を選択し、市場が非常に高速に行っていることに反応します。 過去のシグナルの潜在的な利益が表示されます この指標は、独自の品質とパフォーマンスを分析します 負けブレイクアウトは強調表示され、説明されます インジケータは、非バックペインティングおよび非再ペイントです この指標は、日中のトレーダーが単一の価格反転を見逃さないようにするのに役立ちます。ただし、す
Clear Breakout
Martin Alejandro Bamonte
5 (1)
「Breakout Buy-Sell」インジケーターは、異なる市場セッション(東京、ロンドン、ニューヨーク)での価格ブレイクアウトに基づいて、潜在的な売買機会を識別し、強調するために設計されています。このインジケーターは、トレーダーが買いゾーンと売りゾーン、および利益確定(TP)とストップロス(SL)レベルを明確に視覚化するのに役立ちます。 使用戦略 インジケーターは以下のように使用できます: 初期設定 :市場セッションを選択し、GMTオフセットを調整します。 市場の視覚化 :各セッションの開始時に描かれるブレイクアウトボックスを観察します。これらのボックスは期間の高値と安値を示します。 売買シグナル :ボックスの高値を超えた場合は買いシグナルと見なされます。安値を下回った場合は売りシグナルと見なされます。 リスク管理 :TP1、TP2、TP3、およびSLレベルを使用してポジションを管理します。TPレベルは異なる利益目標のために設計されており、SLは不利な動きに対する保護を保証します。 応用戦略 このインジケーターを最大限に活用するために、以下の戦略が推奨されます: ロンドンセッション
現在26%オフ 初心者やエキスパートトレーダーに最適なソリューション! このインジケーターは、独自の機能と新しい計算式を取り入れた、ユニークで高品質、かつ手頃な価格のトレーディングツールです。たった1枚のチャートで28の為替ペアの通貨強度を読み取ることができます。新しいトレンドやスキャルピングチャンスの引き金となるポイントを正確に特定することができるので、あなたのトレードがどのように改善されるか想像してみてください。 ユーザーマニュアルはこちら  https://www.mql5.com/en/blogs/post/697384 これが最初の1本、オリジナルだ! 価値のないクローンを買わないでください。 特別な サブウィンドウの矢印で強い通貨の勢いを表示 GAPがあなたのトレードを導く! 基準通貨や気配値が売られすぎ・買われすぎのゾーン(外相フィボナッチレベル)にあるとき、個別チャートのメインウィンドウに警告表示。 通貨がレンジの外側から反落した場合、プルバック/リバーサルのアラート。 クロスパターンの特別なアラート 複数の時間枠を選択可能で、トレンドを素早く
PRO Renko Systemは、特別にRENKOチャートを取引するために設計された高精度の取引システムです。 これは、様々な取引商品に適用することができる普遍的なシステムです。 システムは効果的に正確な逆転信号へのアクセスを与えるいわゆる市場の騒音を中和する。 表示器は非常に使いやすく、信号の生成に責任がある1つの変数だけがあります。 あなたは簡単にお好みの任意の取引ツールとレンコバーのサイズにツールを適応させることができます。 私はいつもあなたが私のソフトウェアで収益性の高い取引を支援するために余分なサポートを提供する準備ができています! 私はあなたに幸せで収益性の高い取引をしたいです! ご購入後にご連絡ください! 私はあなたに私のレンコチャートジェネレータを送信します。 私はまた、私の個人的な推奨事項やシステムの他のモジュールを無料で共有します!
まず第一に、この取引ツールはノンリペイント、ノンリドロー、ノンラグの指標であり、プロの取引に理想的ですことを強調する価値があります。 オンラインコース、ユーザーマニュアル、デモ。 スマートプライスアクションコンセプトインジケーターは、新米から経験豊富なトレーダーまで、非常 に強力なツールです。Inner Circle Trader AnalysisやSmart Money Concepts Trading Strategiesなど、20以上の有用な指標を1つに組み合わせています。このインジケーターはスマートマネーコンセプトに焦点を当て、大手機関の取引方法を提供し、彼らの動きを予測するのに役立ちます。 特に、流動性分析に優れており、機関がどのように取引しているかを理解しやすくしています。市場のトレンドを予測し、価格の動きを慎重に分析するのに優れています。機関の戦略とトレードを合わせることで、市場の動向についてより正確な予測ができます。このインジケーターは多目的であり、市場構造を分析し、重要な注文ブロックを特定し、さまざまなパターンを認識するのに優れています。 このインジケー
現在31%オフ! 初心者やエキスパートトレーダーに最適なソリューション! このインジケータは、独自の機能と秘密の数式を組み込んだ、ユニークで高品質かつ手頃な価格のトレーディングツールです。たった1枚のチャートで28の通貨ペアのアラートを表示します。新しいトレンドやスキャルピングチャンスの引き金となるポイントを正確に把握することができるので、あなたのトレードがどのように改善されるか想像してみてください! 新しい基本的なアルゴリズムに基づいて構築されているため、潜在的な取引の特定と確認がより簡単になります。これは、通貨の強さや弱さが加速しているかどうかをグラフィカルに表示し、その加速のスピードを測定するためです。加速すると物事は明らかに速く進みますが、これはFX市場でも同じです。つまり、反対方向に加速している通貨をペアにすれば、利益を生む可能性のある取引を特定することができるのです。 通貨の勢いを示す縦の線と矢印は、あなたの取引の指針となるでしょう。 ダイナミックマーケットフィボナッチ23レベルはアラートトリガーとして使用され、市場の動きに適応します。もしインパルスが黄色
IX Powerは 、FX Powerの無敵の精度をついにFX以外のシンボルにも提供します。 お気に入りの指数、株式、コモディティ、ETF、さらには暗号通貨の短期、中期、長期のトレンドの強さを正確に判断します。 お使いの端末が提供する すべてを分析する ことができます。ぜひお試しいただき、取引 タイミングが大幅に改善 されることをご体験ください。 IXパワーの主な特徴 100%正確で再描画されない計算結果 - ターミナルで利用可能なすべての取引シンボルに対して 予め設定され、さらに個別に設定可能な強度分析期間のドロップダウン選択 Eメール、メッセージ、モバイル通知による無数の通知オプション EAリクエストのためのアクセス可能なバッファ カスタマイズ可能な計算制限により、さらに優れたパフォーマンスを実現 もっと見たい人のための特別なマルチインスタンス設定 すべてのチャートでお好みの色を無限に設定可能 Windows 11とmacOSのスタイルで角を丸くした新しいパネルデザイン サブ・ウィンドウとメイン・チャートの間をシームレスに移動する、魔法のように動く
Advanced Supply Demand
Bernhard Schweigert
4.9 (314)
現在33%オフ 初心者にもエキスパートトレーダーにも最適なソリューション このインジケーターは独自の機能と新しい公式を多数内蔵しており、ユニークで高品質かつ手頃な取引ツールです。このアップデートでは、2つの時間枠ゾーンを表示できるようになります。より長いTFだけでなく、チャートTFとより長いTF(ネストゾーンを表示)の両方を表示できます。すべてのSupply Demandトレーダーの皆さんのお気に召すはずです。:) 重要情報の公開 Advanced Supply Demandの可能性を最大化するには、 https://www.mql5.com/ja/blogs/post/720245 にアクセスしてください。   エントリーまたはターゲットの正確なトリガーポイントを正確に特定できれば取引がどのように改善されるか想像してみてください。新しい基盤となるアルゴリズムに基づいて構築されているため、買い手と売り手の間の潜在的な不均衡をさらに簡単に特定できます。これは、最も強い需要と供給のゾーンと、過去のパフォーマンス(古いゾーンを表示)がグラフィカルに表現されるためです。これらの機能は、最適
NAM Order Blocks
NAM TECH GROUP, CORP.
5 (1)
MT4マルチタイムフレームオーダーブロック検出インジケーター。 特徴 -チャートコントロールパネルで完全にカスタマイズ可能で、完全な相互作用を提供します。 -必要な場所でコントロールパネルを表示および非表示にします。 -複数の時間枠でOBを検出します。 -表示するOBの数量を選択します。 -さまざまなOBユーザーインターフェイス。 -OBのさまざまなフィルター。 -OB近接アラート。 -ADRの高線と低線。 -通知サービス(画面アラート|プッシュ通知)。 概要 注文ブロックは、金融機関や銀行からの注文収集を示す市場行動です。著名な金融機関と中央銀行が外国為替市場を牽引しています。したがって、トレーダーは市場で何をしているのかを知る必要があります。市場が注文ブロックを構築するとき、それは投資決定のほとんどが行われる範囲のように動きます。 注文の構築が完了すると、市場は上向きと下向きの両方に向かって急激に動きます。注文ブロック取引戦略の重要な用語は、機関投資家が行っていることを含むことです。それらは主要な価格ドライバーであるため、機関投
Enigmera
Ivan Stefanov
5 (4)
エニグメラ:市場の中核 https://www.enigmera.com はじめに このインディケータと取引システムは、金融市場に対する驚くべきアプローチです。ENIGMERAは、フラクタルサイクルを使用して、サポートとレジスタンスレベルを正確に計算します。本格的な蓄積局面を示し、方向性と目標を示します。 トレンド中でも調整中でも機能するシステムです。 どのように作動するのか? ENIGMERAは、支持線・抵抗線、目標線、乖離線の3つのラインで構成されています。このシステムは、過去のデータを現在と未来に外挿する典型的な市場指標とは異なり、現在の完全な画像を提供します。支持線上にある場合、それは本当の支持を意味し、抵抗線上にある場合、それは本当の抵抗を意味する。ある水準が破られた場合、それはトレンドの変化を意味する。再描画はしない。 市場は常に進化しているため、ENIGMERAはその評価ツールを適応させ、定期的に戦略を修正しています。  これにより、すべてのシナリオが徹底的に評価されることが保証されます。この市場指標の独自性は、その能力を見れば明らかです。  ENIGM
トレンドトレーディング は、タイミングのプルバックとブレイクアウトにより、市場で起こっているトレンドから可能な限り利益を得るように設計された指標です。確立されたトレンドの中で価格が何をしているかを分析することにより、取引の機会を見つけます。 [ インストールガイド | 更新ガイド | トラブルシューティング | よくある質問 | すべての製品 ] 自信を持って効率的に金融市場を取引する むち打ちにならずに確立されたトレンドから利益を得る 収益性の高いプルバック、ブレイクアウト、早期の逆転を認識する この指標は、独自の品質とパフォーマンスを分析します 複数時間枠のダッシュボードを実装します インジケーターは再描画されていません 電子メール/音声/視覚アラートを実装します 確立されたトレンドは多くの取引機会を提供しますが、ほとんどのトレンド指標はそれらを完全に無視しています。インジケーターの解釈はかなり簡単です: (1) トレンドの変化 (2) トレンドの方向への後退 (3) トレンドの方向へのブレイクアウト 赤いダッシュ は下降トレンド中の修正です 青いダッシュ は上昇ト
最初のパルスレベルを反転 (RFI)     指示する     ロシア     -        utilizar con   el indicador の ESP 推奨事項 -   TPSpro トレンド プロフェッショナル版 -   MT5のバージョン 最も重要なことは、将来においても最も重要なことです。 機能のプリンシパル: ゾーンのほとんどは、ベンダーとコンプラドールによってアクティブ化されます。 状況を直感的に把握できるよう、初期の衝動を修正します。 LOGIC AI: MUESTRA zonas (círculos) parabuscar puntos de entrada cuando se activa una plantilla 視覚的に優れた視覚効果があり、最も重要な機能がすべて揃っていることに注意してください。 優れたニベレス/ゾーンの視覚化 (modo MTF) 世界で最も人気のある場所/ゾーンです。これを使用するのに最適な方法です (   TPSproTREND PRO   )。 アルゴリズム プロフェッショナル セパラド パソ ア パソ パラ オペラ それは
Scalper Vault は、スキャルピングを成功させるために必要なすべてを提供するプロフェッショナルなスキャルピング システムです。このインジケーターは、外国為替およびバイナリー オプションのトレーダーが使用できる完全な取引システムです。推奨される時間枠は M5 です。 システムは、トレンドの方向に正確な矢印シグナルを提供します。また、トップとボトムのシグナルとギャン マーケット レベルも提供します。 インジケーターは、プッシュ通知を含むすべてのタイプのアラートを提供します。 インジケータの購入後にご連絡ください。私の個人的な取引の推奨事項と素晴らしいボーナス指標を無料で共有します! 幸せで有益な取引をお祈りします!
M1 Arrow
Oleg Rodin
4.73 (15)
市場の2つの基本原則に基づく日中戦略。 このアルゴリズムは、追加のフィルターを使用したボリュームと価格の波の分析に基づいています。インディケータのインテリジェントアルゴリズムは、2つの市場要因が1つに結合した場合にのみシグナルを出します。インディケータは、より高い時間枠のデータを使用して、M1チャート上の特定の範囲の波を計算します。そして波を確認するために、インジケーターはボリュームによる分析を使用します。 このインディケータはレディトレーディングシステムです。トレーダーが必要とするのは、信号に従うことだけです。また、インジケーターはあなた自身の取引システムの基礎になることができます。取引はミニッツチャートでのみ行われます。 インジケーターがMTFの原則を使用しているという事実にもかかわらず、インジケーターのアルゴリズムは可能な限り安定しています。 購入後、必ず私に書いてください!私の取引設定と推奨事項をあなたと共有します!
Order Block Hunter
Noha Mohamed Fathy Younes Badr
5 (2)
Order block hunter indicator is the best indicator for  hunt the order blocks that area where there has been a large concentration of limit orders waiting to be executed Order blocks are identified on a chart by observing previous price action and looking for areas where the price experienced significant movement or sudden changes in direction .This indicator does that for you by using very complicated codes and helps you to take the best areas To buy and sell because it make marks at the best a
`All in One Chart Patterns` チャートパターンはトレーダーの間で議論の的となっています。信頼できるシグナルだと考える人もいれば、そうでないと考える人もいます。当社の「Chart Patterns All-in-One」インジケーターは、これらのパターンを表示し、自分自身で理論を検証できるようにします。これらのパターンの収益性は、インジケーターの有効性を反映するものではなく、むしろパターン自体の評価です。「Chart Patterns All-in-One」インジケーターは、これらのパターンを視覚化するための優れたツールであり、取引戦略における有効性について自分自身で結論を下すことができます。 このインジケーターは、複数のチャートパターンを1つの統合ツールに組み合わせて、MetaTrader 4 (MT4) で使用します。チャートから直接各パターンをオンまたはオフに切り替える機能を提供し、カスタマイズ可能で効率的な分析を可能にします。以下は、インジケーターとその中に含まれるパターンの詳細な説明です。 #### 含まれるパターン: 1. **パターン
作者のその他のプロダクト
up-down indicator is no repaint and works all pairs and lower than weekly time frames charts. it is suitable also 1 m charts for all pairs. and hold long way to signal. dont gives too many signals. when red histogram cross trigger line that is up signal.and price probably will down when blue histogram cross trigger line that is down signal.and price probably will go up. when the signals not seen press + button on terminal . too see weekly chart because of low data on chart ,it needs to lower p
on free demo press zoom out button to see back.. cnt number is bar numbers.you can change up to 3000 related to chart bars numbers. minimum value is 500. there is g value set to 10000. no need to change it. this indicator almost grail,no repaint and all pairs ,all timeframe indicator. there is red and blue histograms. if gold x sign comes on red histogram that is sell signal. if blue x sign comes on blue histogram that is buy signal. this indicator on thise version works all pairs.al timeframe
Thise indicator is up down v6  comes with tradingwiev pinescript. purchased people, after installed on terminal ,contact me on mql5  to get BONUS  TradingView pinescript. up-down indicator is no repaint and works all pairs and lower than weekly time frames charts. it is suitable also 1 m charts for all pairs. and hold long way to signal. dont gives too many signals. when red histogram cross trigger line that is up signal.and price probably will down when blue histogram cross trigger line that
up down stars indicator is no repaint indicator. it hold long way to signals. suitable all pairs and all timeframes. it needs at least 1000 bars on charts. 1 is critical level for signals. if red line reach 1 it gives red star to sell.. if blue line reach 1 it gives blue star to buy.. signals comes mostly exact time. sometimes lower timeframes it makes consecutive signals.
volatility level indicator is a volatility oscillator to see trend reversal points. price trends has reverese when volatility inreased . this indicator show trend reversal points volatility. mostly same level up and down volatility is reversal points. red colour shows up points of volatilty.and probably trend will down. blue colour oscillator shows deep point of price when increased volatiliyty. on pictures horizontal lines on oscillator has drawed by hand.to see the before level and compare now
norepaint arrows indicator is a nrp indicator. never change signals or put signals back. when price up  blue arrow is sell ,when price down aqua arrows are buy signals. thise indicator can use all time frames and for all pairs.. Mostly use lower timeframes.  cnt value is 1000 bars. to see back signals ,cnt value can be increase if there is enough bars on charts. minimum value cnt is 500. dont use lower then 500. g value has been set to optimum value is 1. Increasing g value gives more signals.
indicator is no repaint trend indicator. when red stars up to line that is probably end of long trades. when blue stars up to line that is probably end of down trades. indicator can use all pairs and lower than weekly charts, to use weekly chart need to at least 500 bars data on back.and lowering processing value 500. it is also suitable for 1m charts. indicator hold long way to go. there is not too many signals.
nrp vertex g indicator is no repaint vertex indicator. it works all time frame and all pairs. working princible is wery easy and can use beginners. when histogram up side and there is a white star on it that is buy signal.. and reverse signal sell comes when histogram below zero and white star on it.that is sell signal. indicator hold long time to signal.and it is not neccesary to stay on computer. minimum bar number is 500 bars on chart to work of it. and the cnt nr is minimum 500 can be. but p
norepaint buy sell indicator is norepaint indicator.and works all pairs and all timeframes. Indicator hold too long way to signals. And show major and minor cycles.and gives signals Minor cycles are indicating with x signs. Major cycles are indicating big arrows. So 5m chart and 15m chart more suitable For major cycles, 1 h and 4h chart suitable for minor cycles. using is wery simple ,it puts arrow on price probably buy sell arrows. thise indicator is suitable for beginner and experienced trader
THISE INDICATOR NOT WORK ON FREE DEMO. there is a protocol to work it. target finder indicator is a forecast the find probably targets.up and down. to use thise indicator, there is a protocol,i explain below. first load indicator  you will see blue and red lines. on the left side look to the higher value of line ,and draw horizantal line on top it. and on the right side see the LEVEL NUMBER. Finding UP TARGET h=put that level number  m=1 b=1 pres ok. you will see on the screen ,on top right ,r
buy sell star indicator has a different algoritms then up down v6 and buy sell histogram indicators. so that i put this a another indicator on market. it is no repaint and all pairs and all time frame indicator. it need minimum 500 bars on charts. when  the white  x sign on the red histogram that is sell signals. when the white x sign on the blue  histogram that is sell signals. this indicator does not guarantie the win.price can make mowement on direction opposite the signals. this is multi tim
indicator is no repaint trend indicator.for mt5 when white stars up to Red histogram that is probably end of long trades. when White stars up to Blue histogram that is probably end of down trades. indicator can use all pairs and lower than weekly charts, to use weekly chart need to at least 500 bars data on back.and lowering processing value 500. it is also suitable for 1m charts. indicator hold long way to go. there is not too many signals.
up down v6 for mt5 is no repaint all timeframe and all pairs indicator. red histogram cros trigger that is up point,and put a red point on histogram. and blue histogram cros trigger that is deep point.and put blue point on histogram. this indicator need to sometimes zoom out .for thise pres + button. if newly comes signal is too high makes before invisible.red and blue points are there.to see the signals. indicator is no repaint and can use all time frame and all pairs. only need minimum 500 bar
double line indicator is no repaint trend indicator. it can be use all pairs and all timeframes. it is wery ease to use.also beginner can use. it gives gold and aqua points on the double lines. aqua points is come when the prices is down. and gold points is come when the prices is on top. it can be used all time frames and all pairs. suitable for experienced and beginners traders.
buy sell stars  is a no repaint ,all pairs and all time frames indicator. first set control periot 500 to see signals. it need minimum 500 bars on charts. concept of indicator is wery easy. if white point on the red histogram that means sell . if white point on blue histogram that means buy.. indicator is no repaints.but some times makes drawdown. so case it need to look one upper time frame. indicator is not guarantie the win..
フィルタ:
レビューなし
レビューに返信