SSN Support Resistance With Alerts MT5
- インディケータ
- Ongkysetiawan
- バージョン: 1.3
- アクティベーション: 10
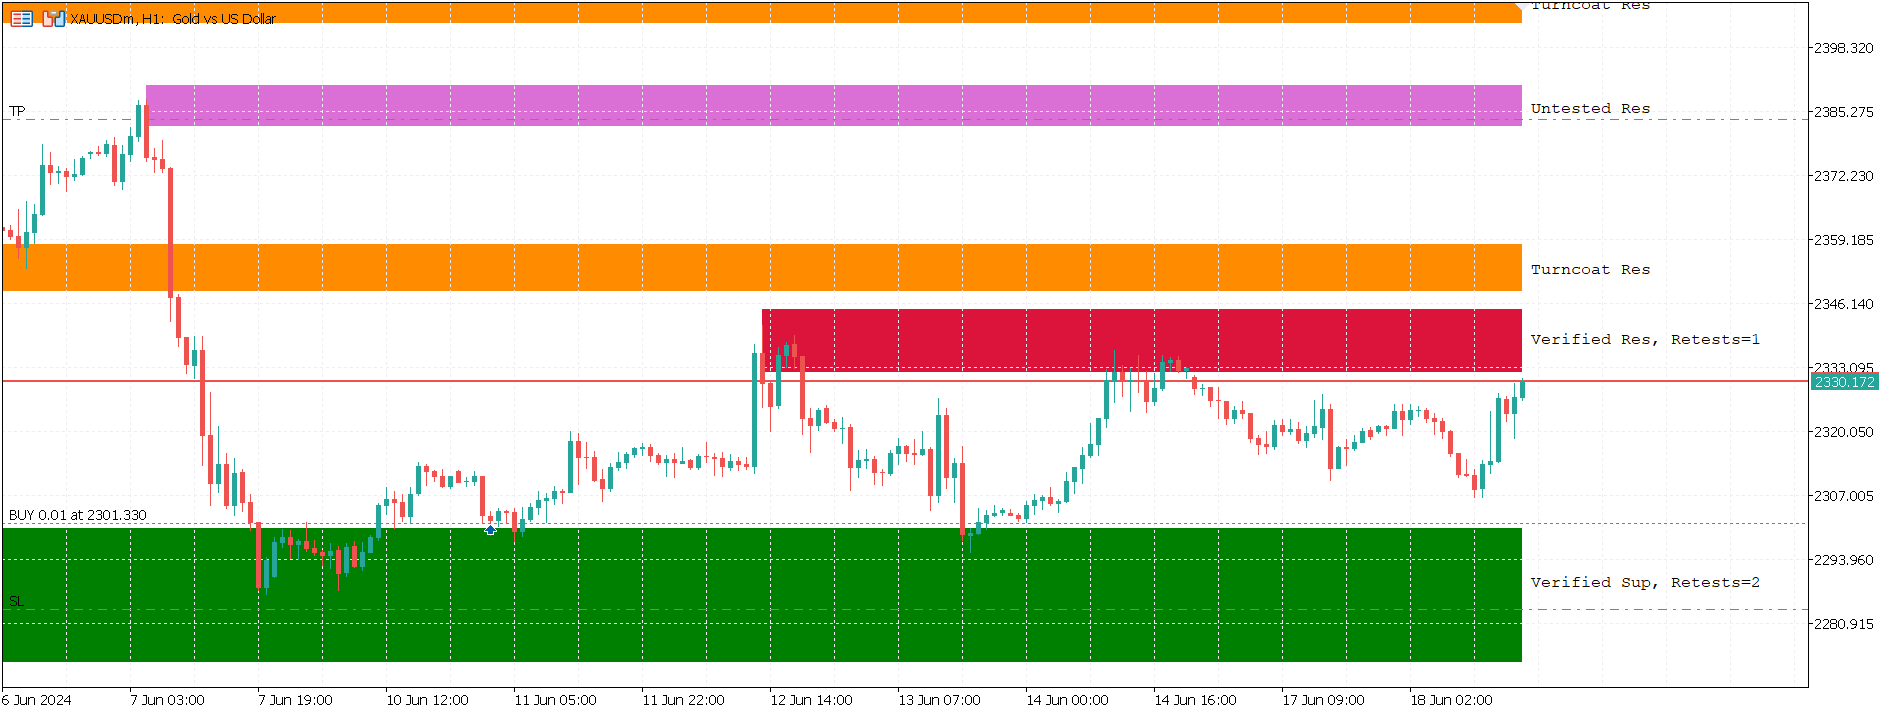
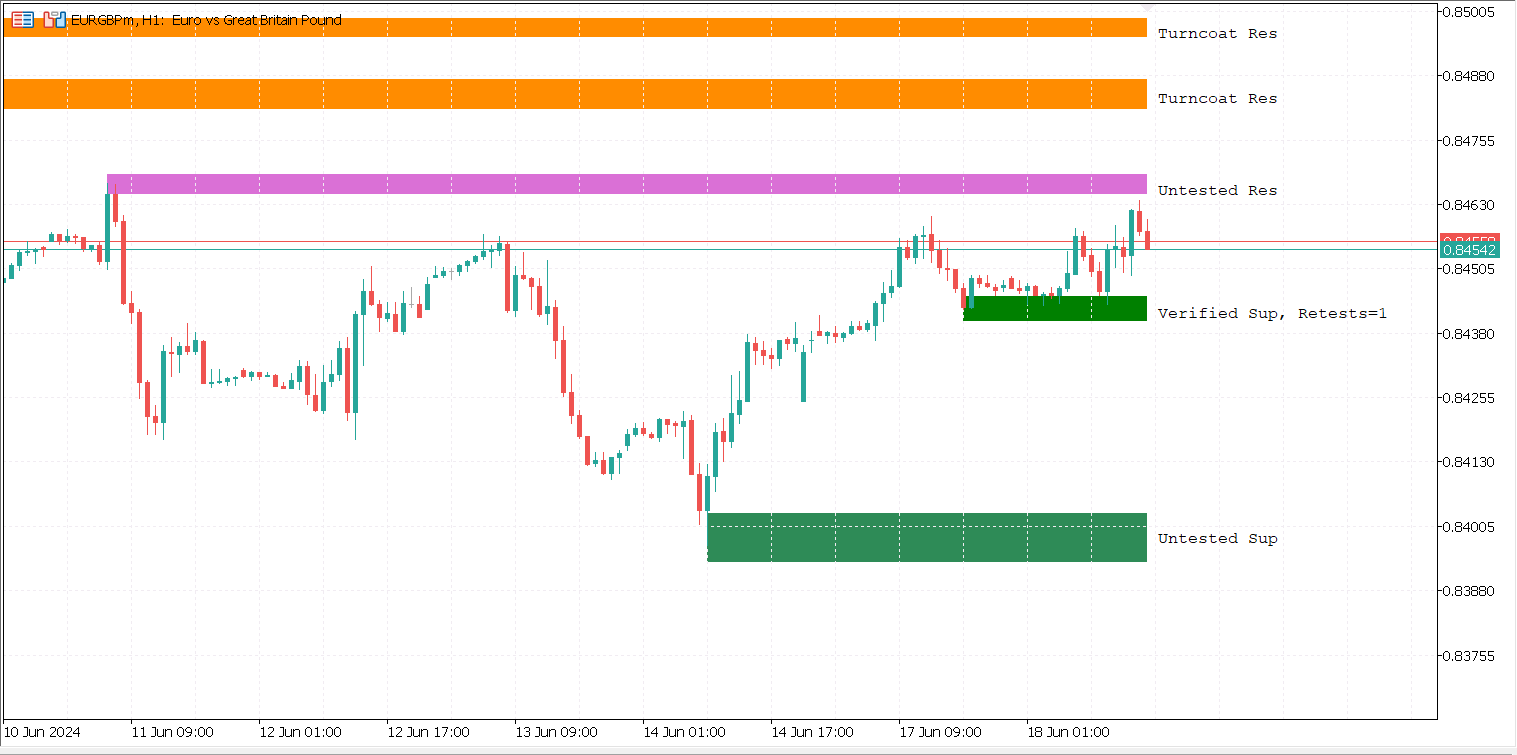
The indicator identifies critical support and resistance areas. It also can give alerts and notifications to your mobile.
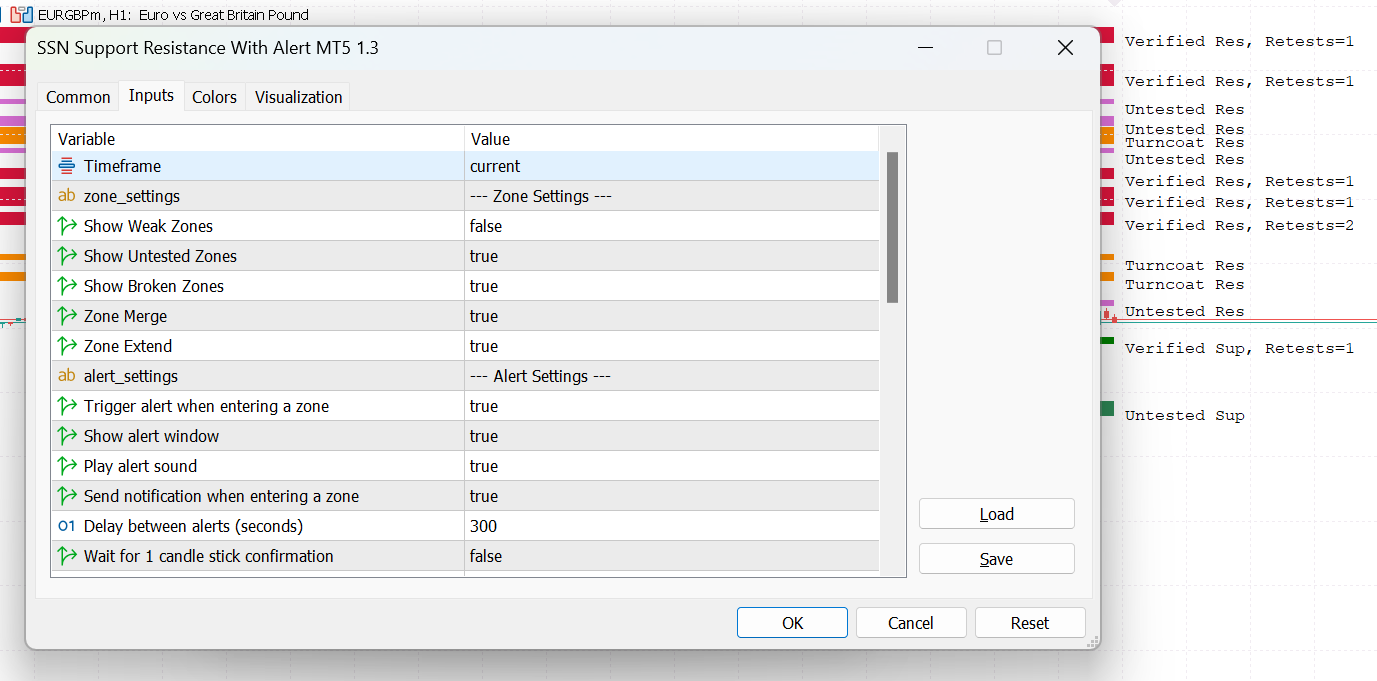
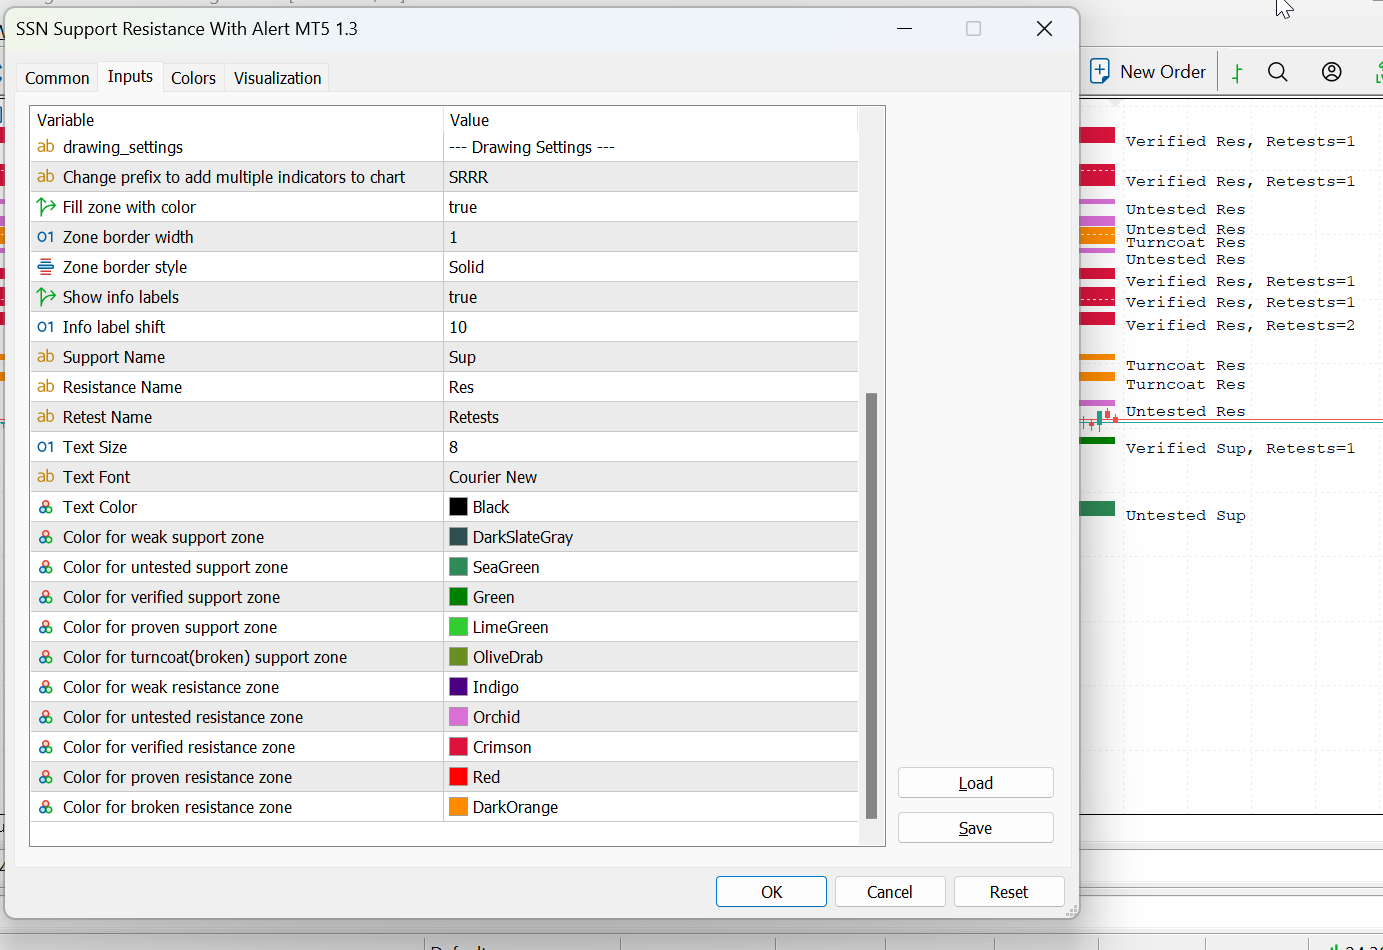
A lot of customization options are available:
- You can have different timeframe on your current chart. For example, if your current chart timeframe is H1, you can assign the indicator timeframe to M15.The indicator identifies critical support and resistance areas. It also can give alerts and notifications to your mobile. A lot of customizations are available.
- There is an option named 'Wait for 1 candle stick confirmation', to send notifications only if there is one candle has broke a support or resistance.
- The label and color can also be customized.
- And more...
You can use my indicator to help you make a better decision on your trade.