Perfect Histogram
- インディケータ
- Teofil Creanga
- バージョン: 1.0
- アクティベーション: 5
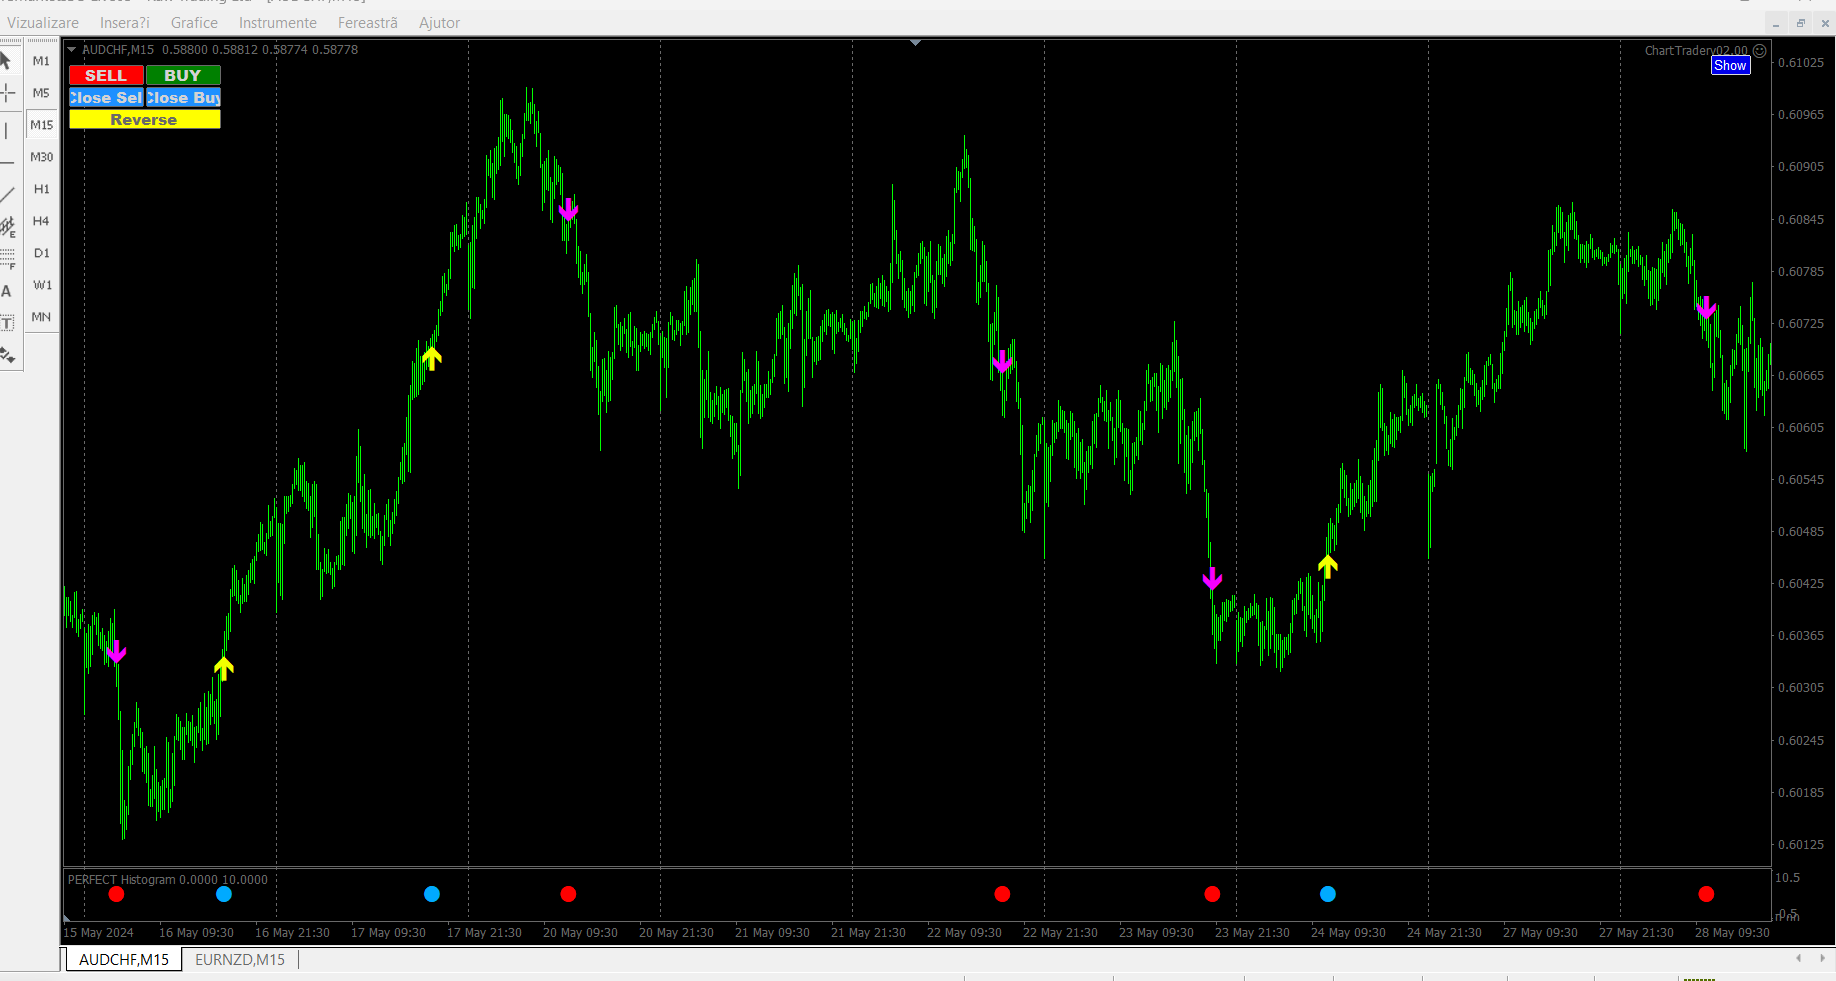
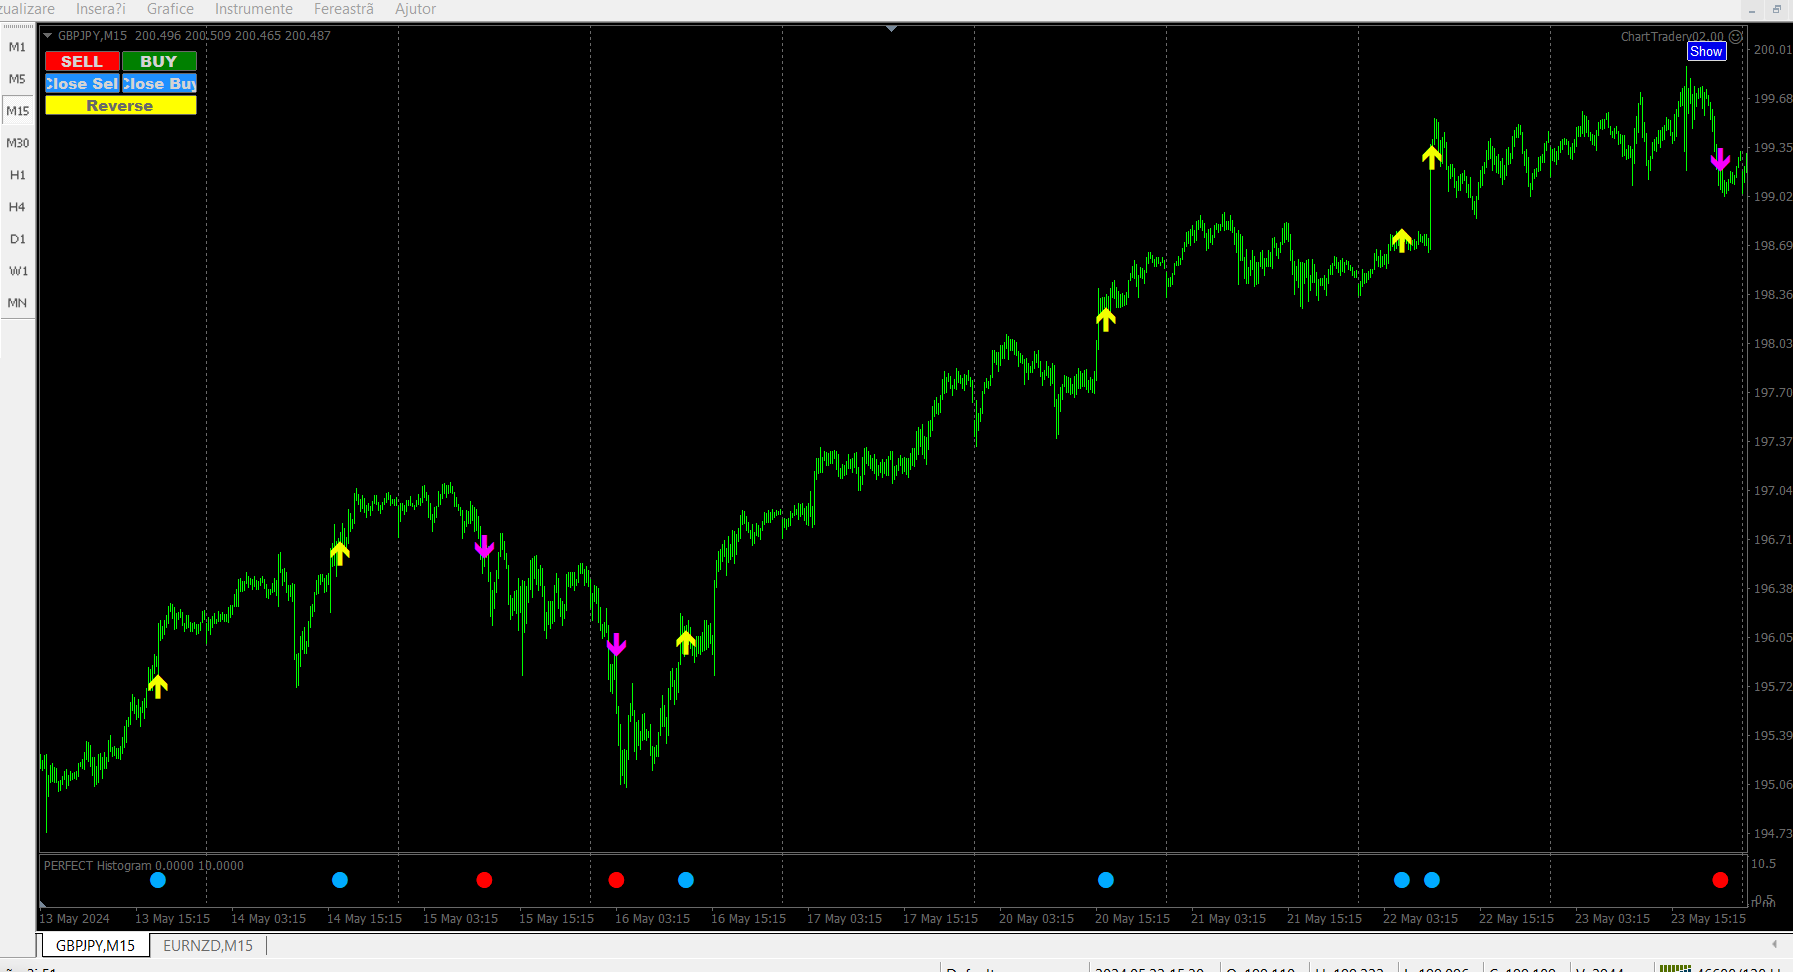
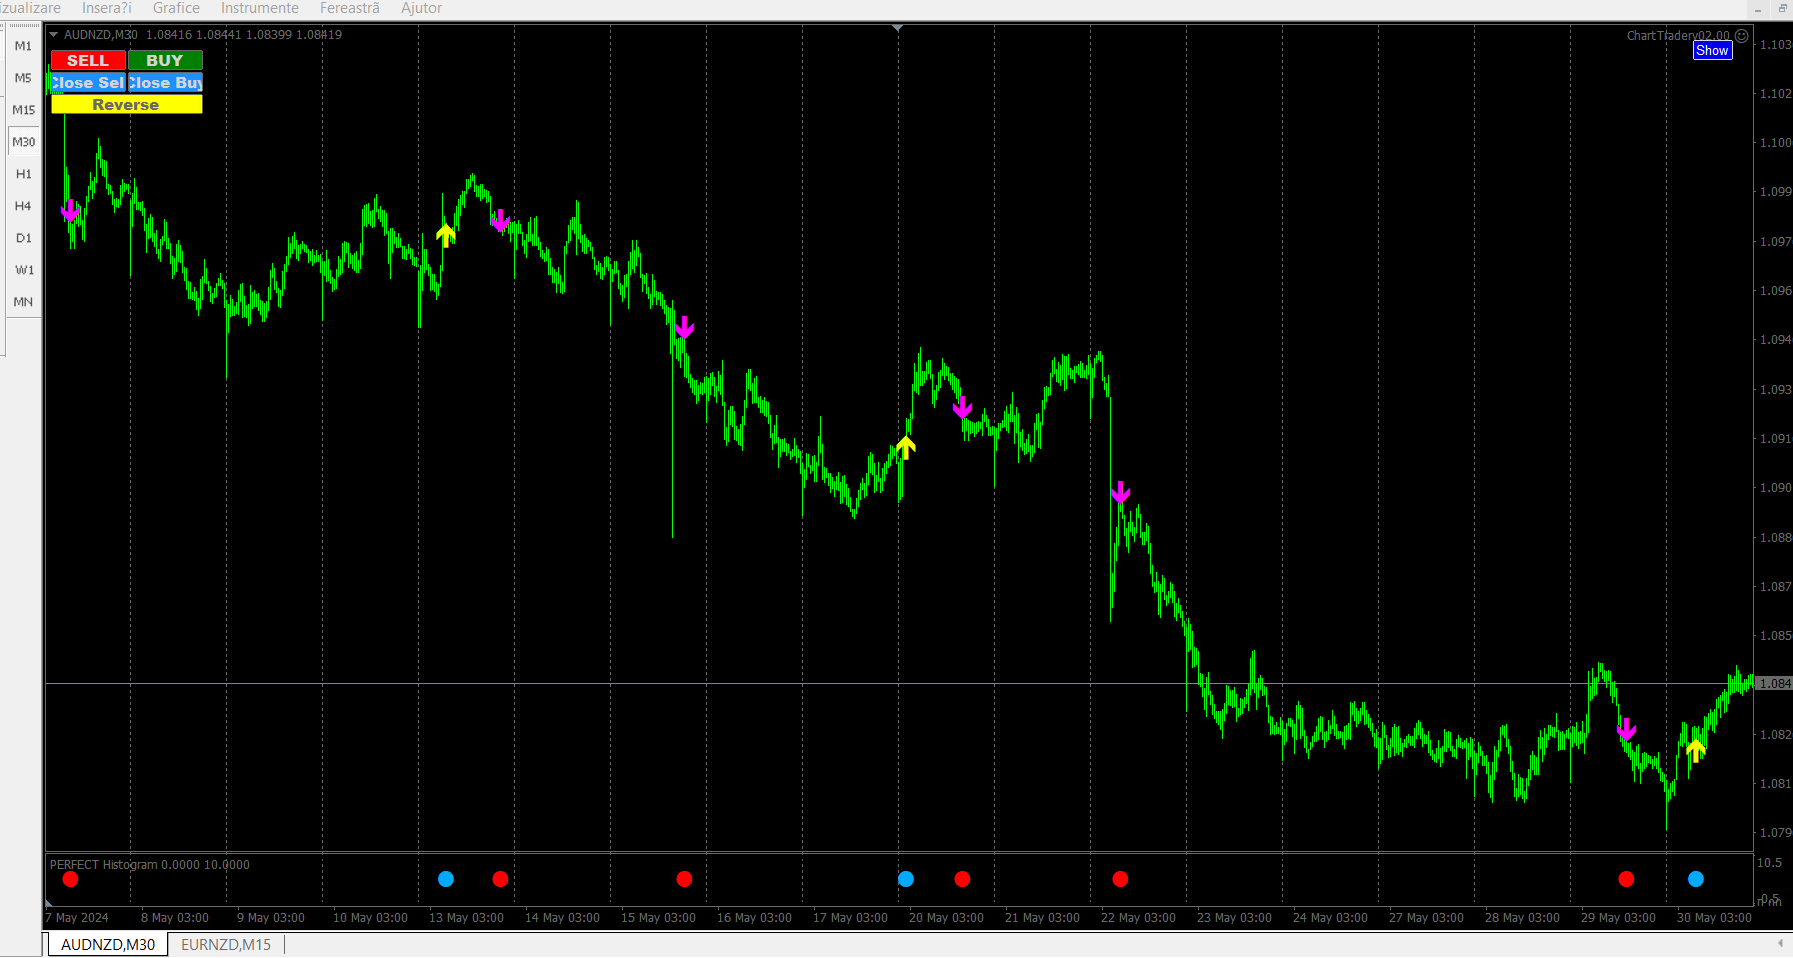
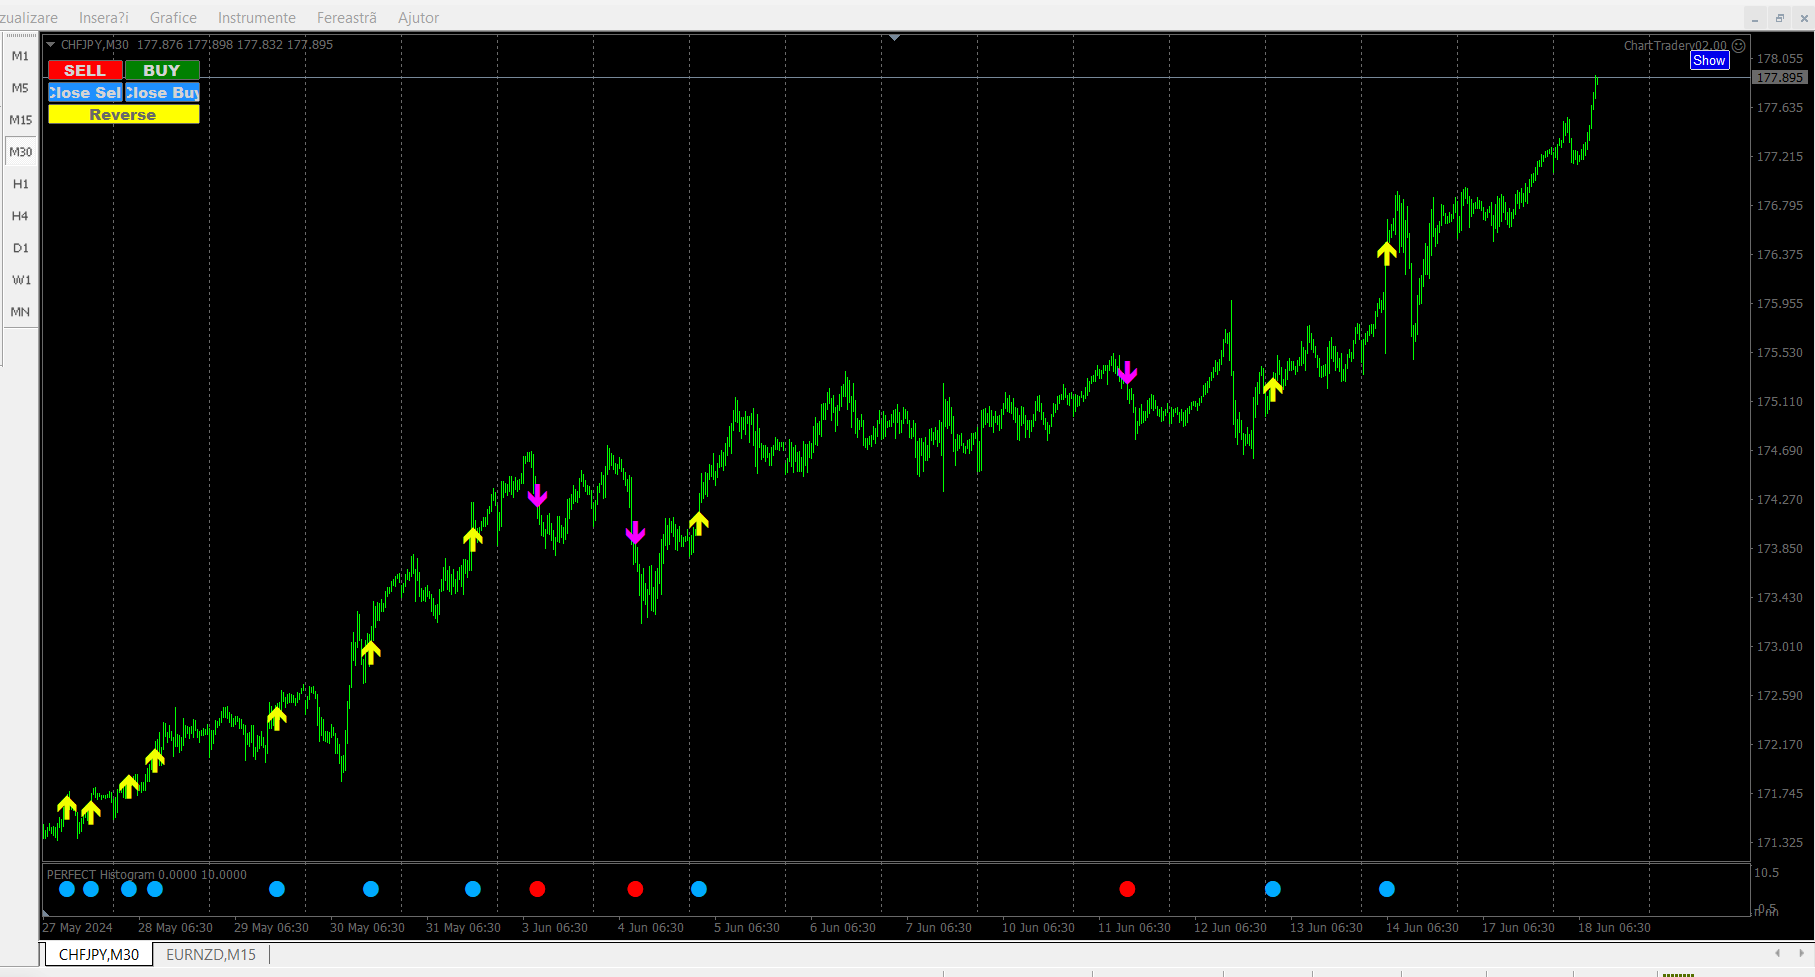
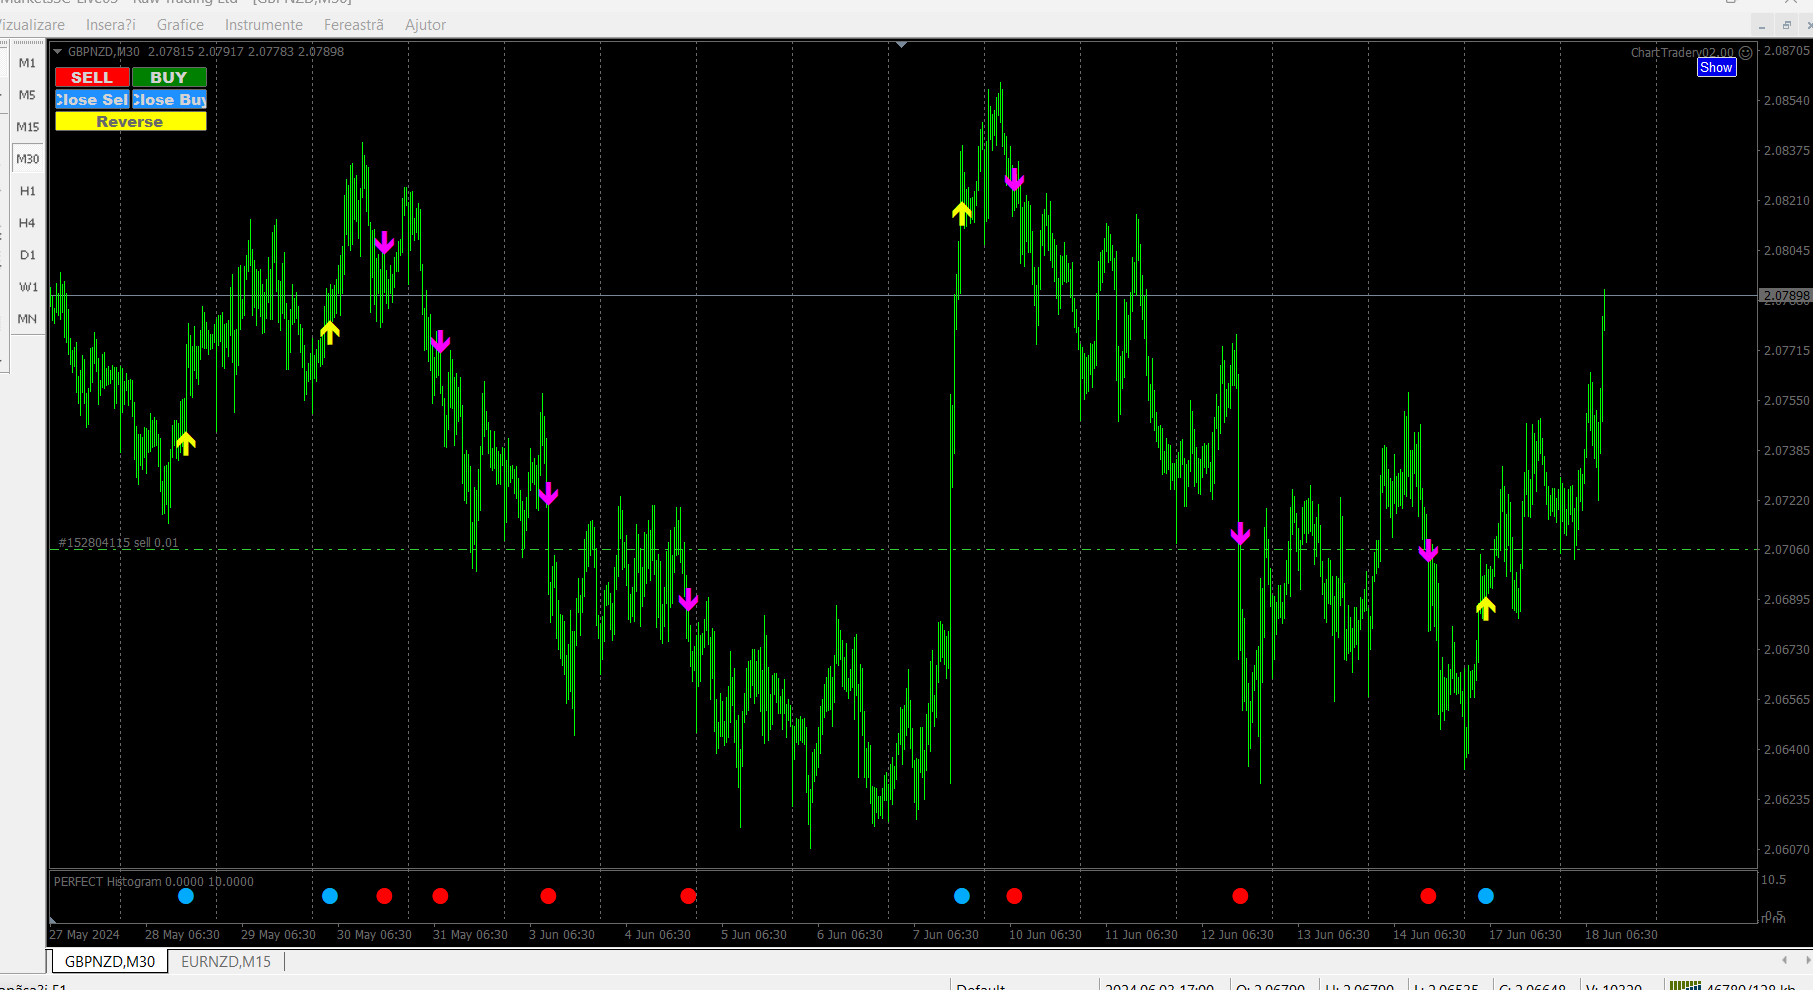
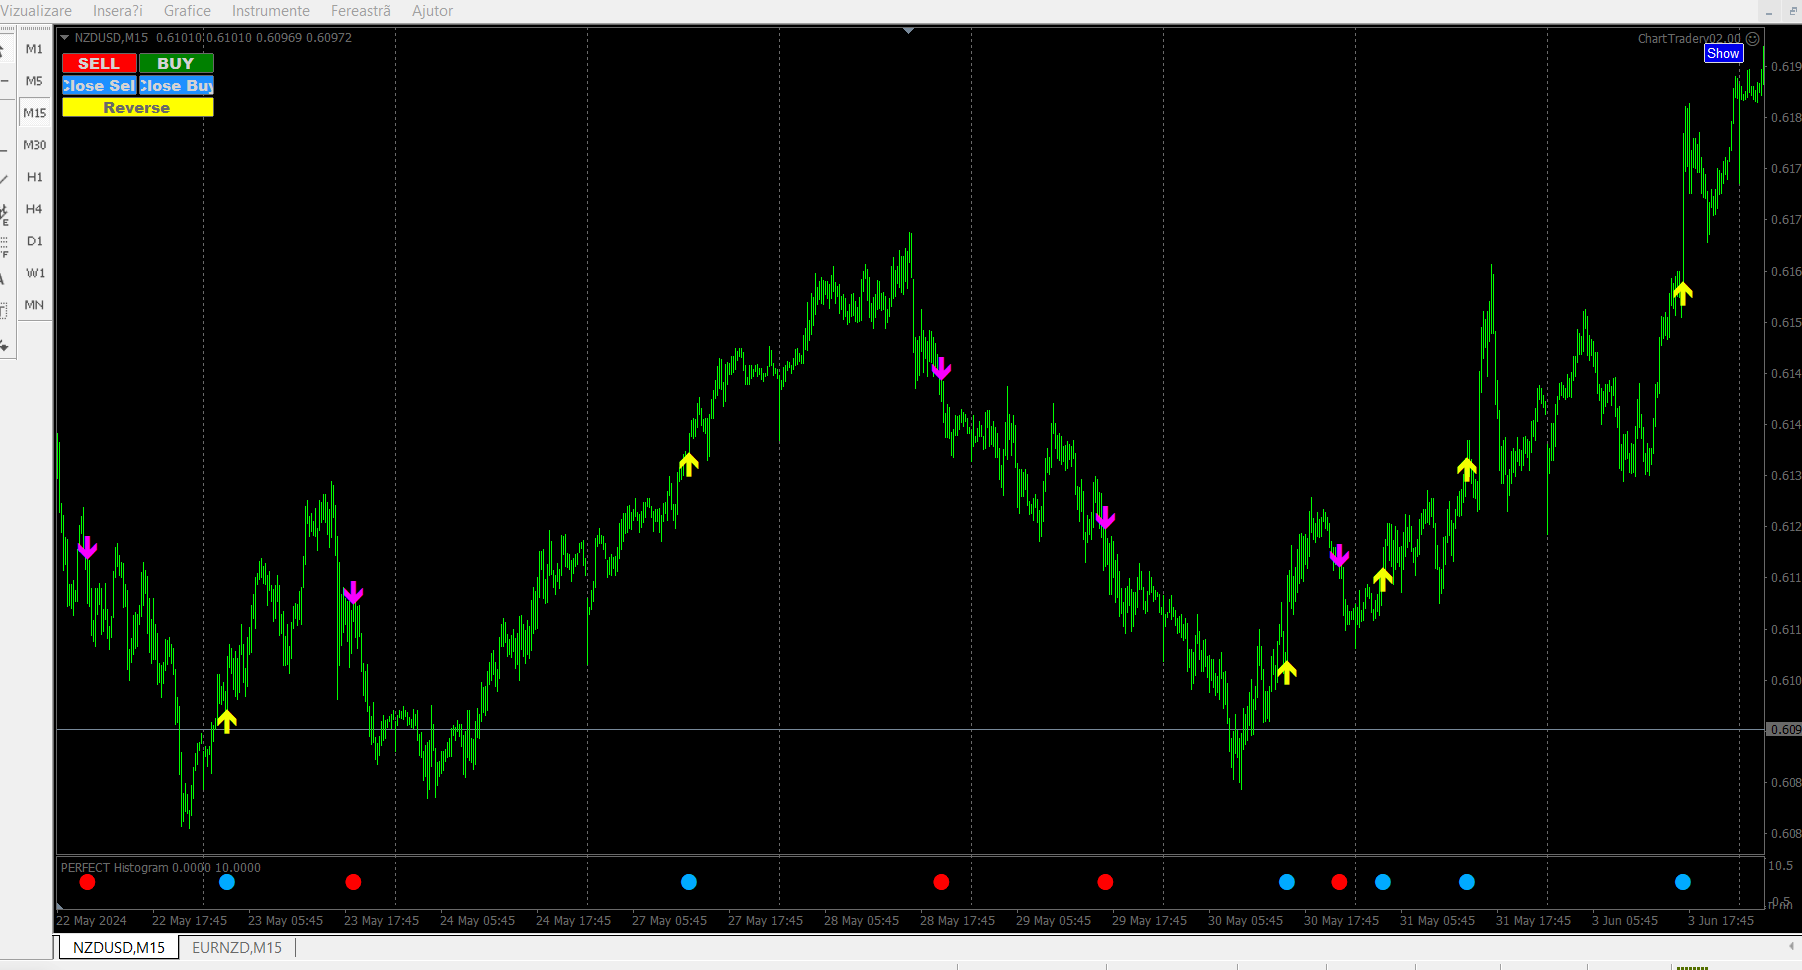
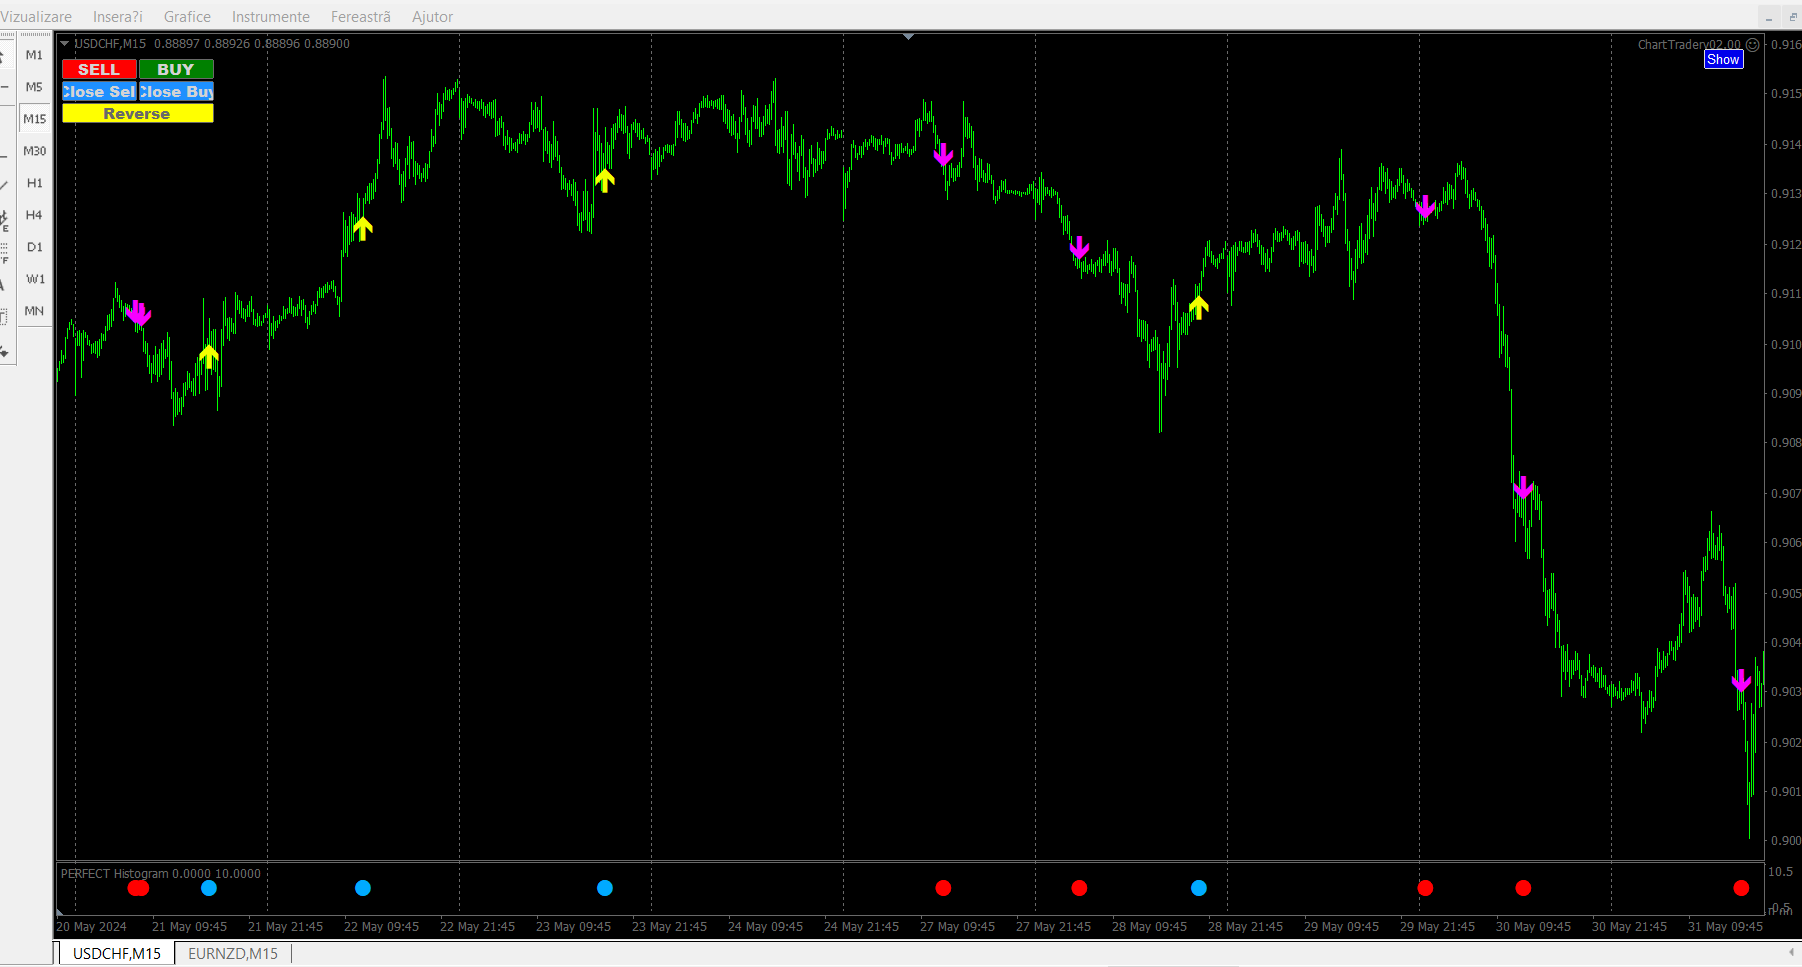
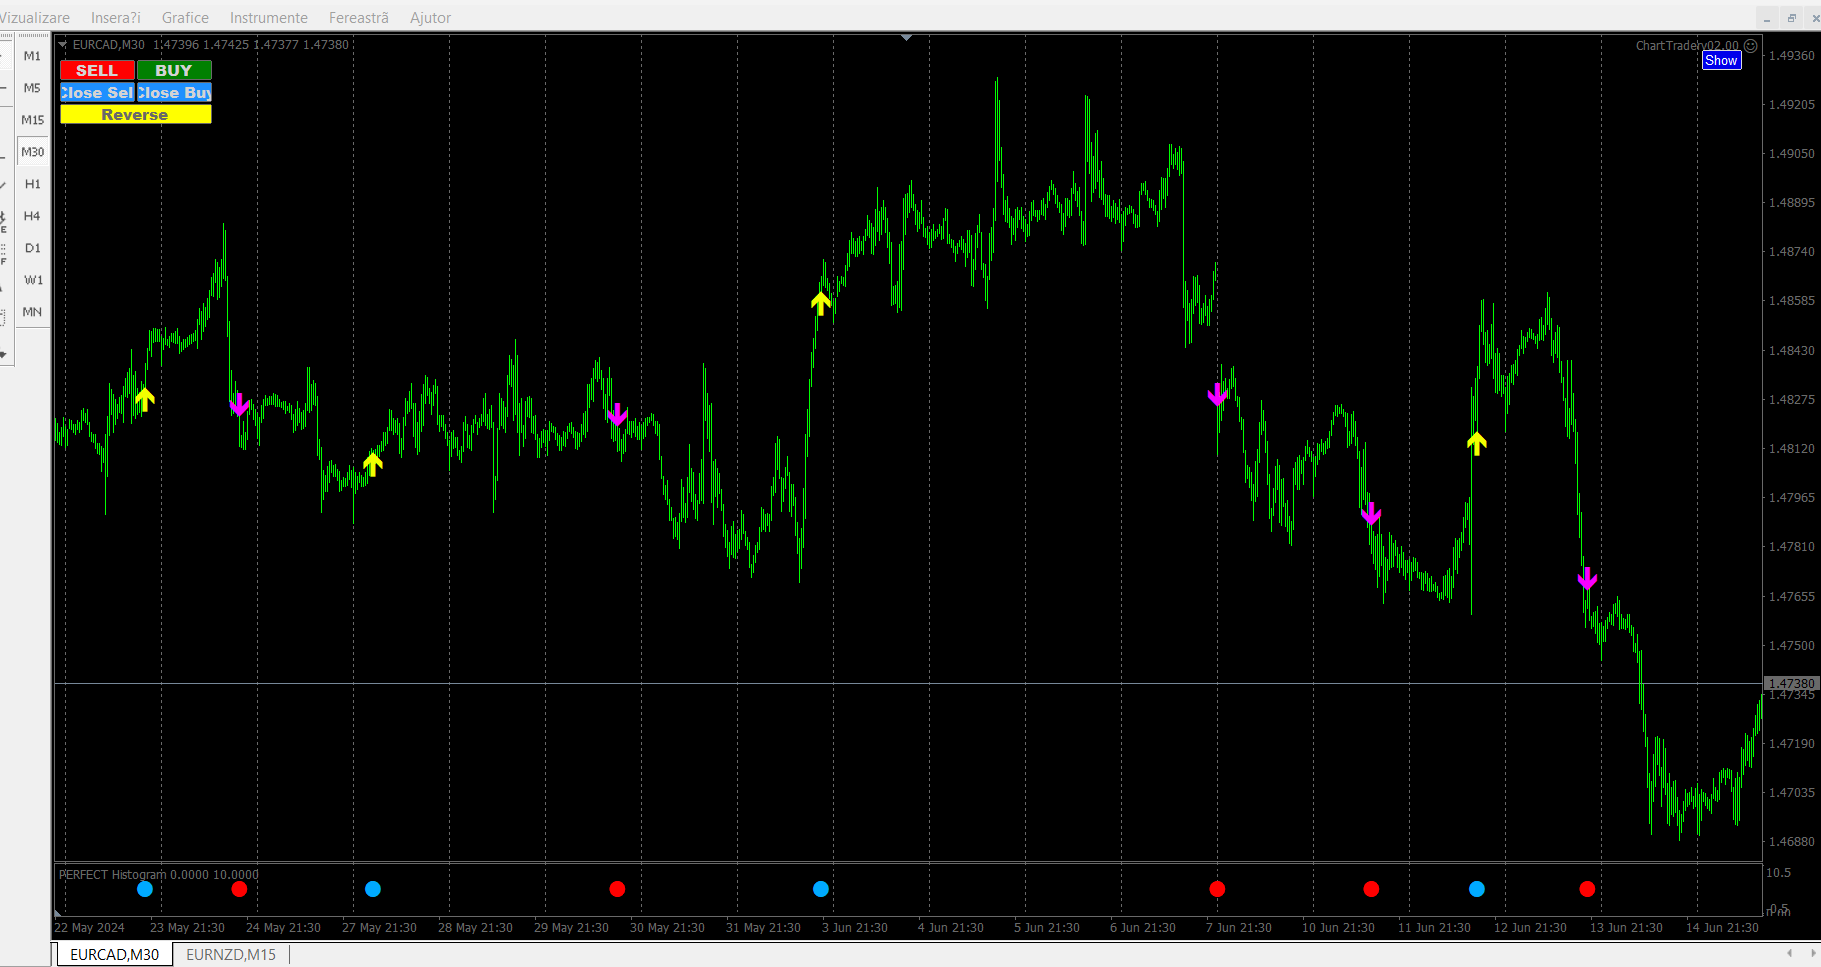
Histogramă PERFECTĂ
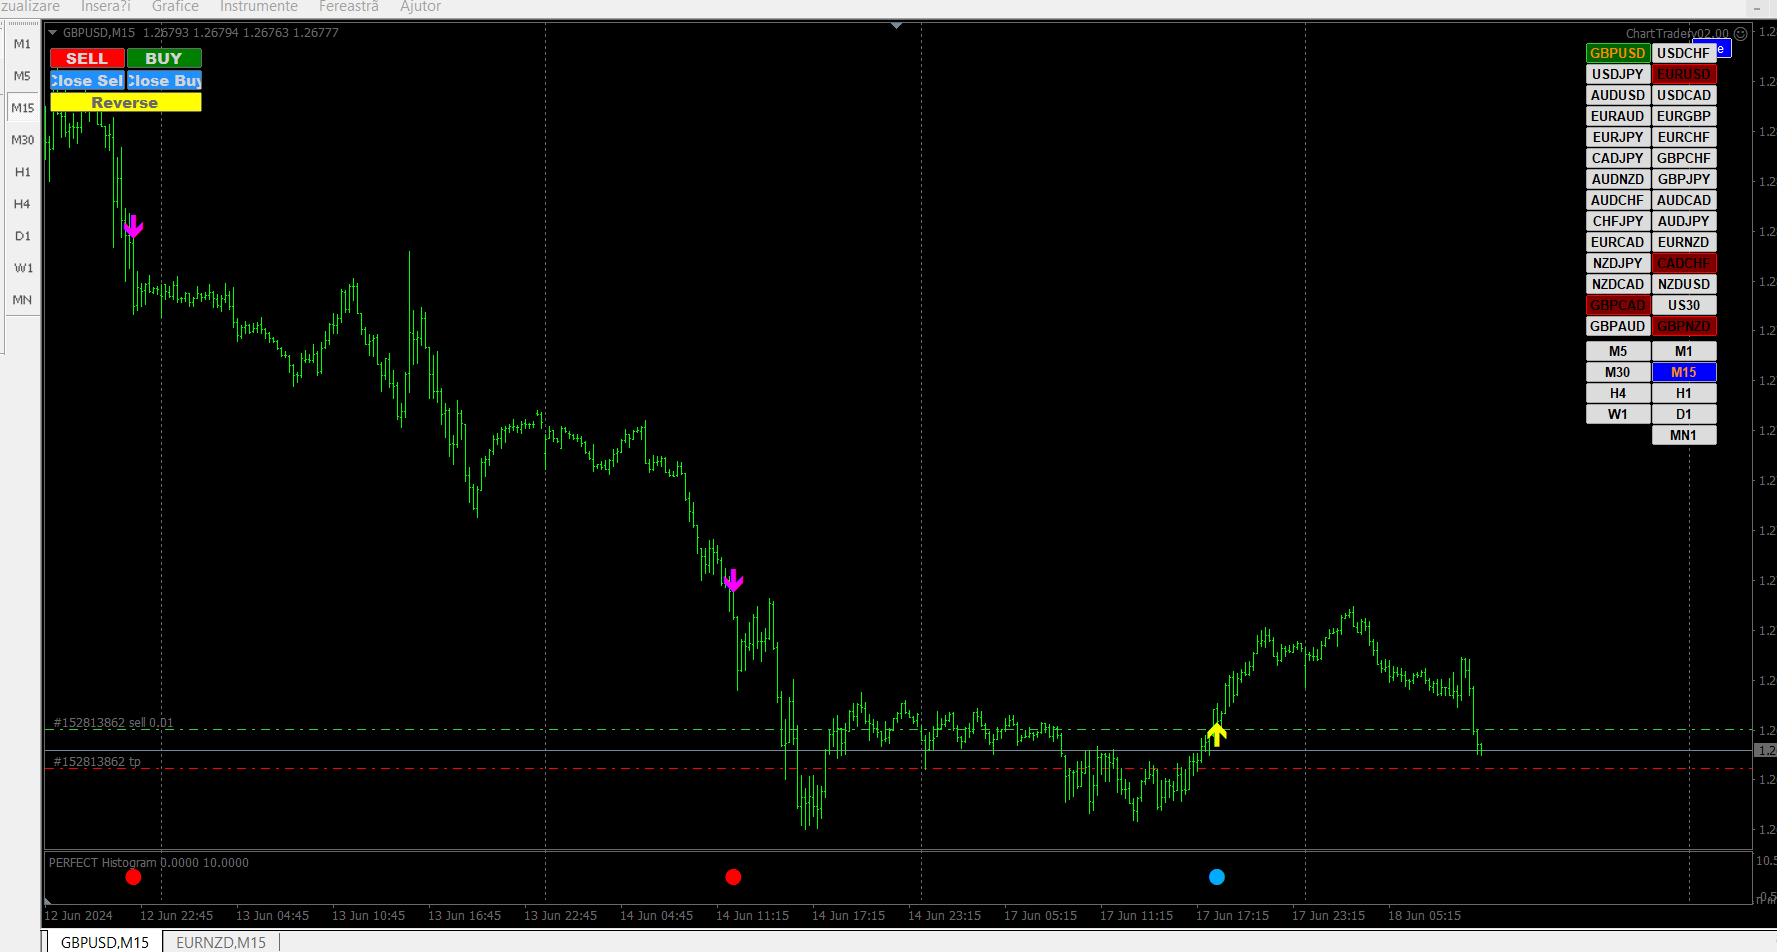
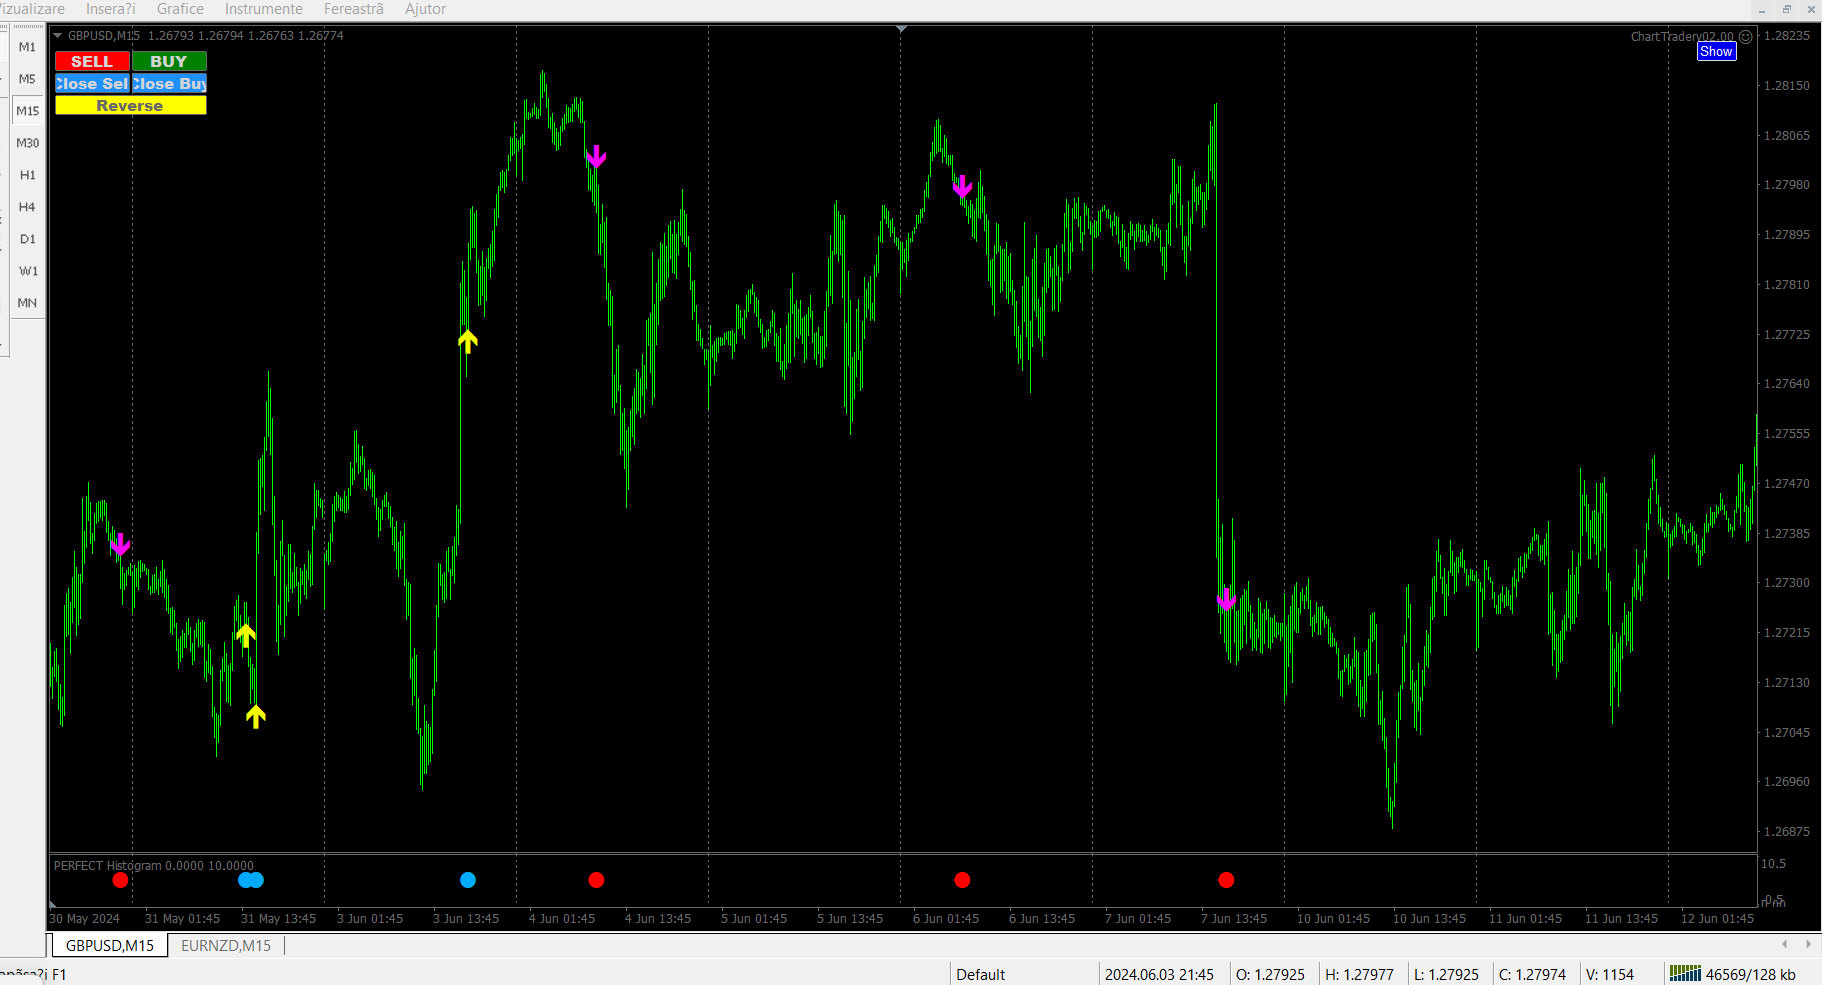
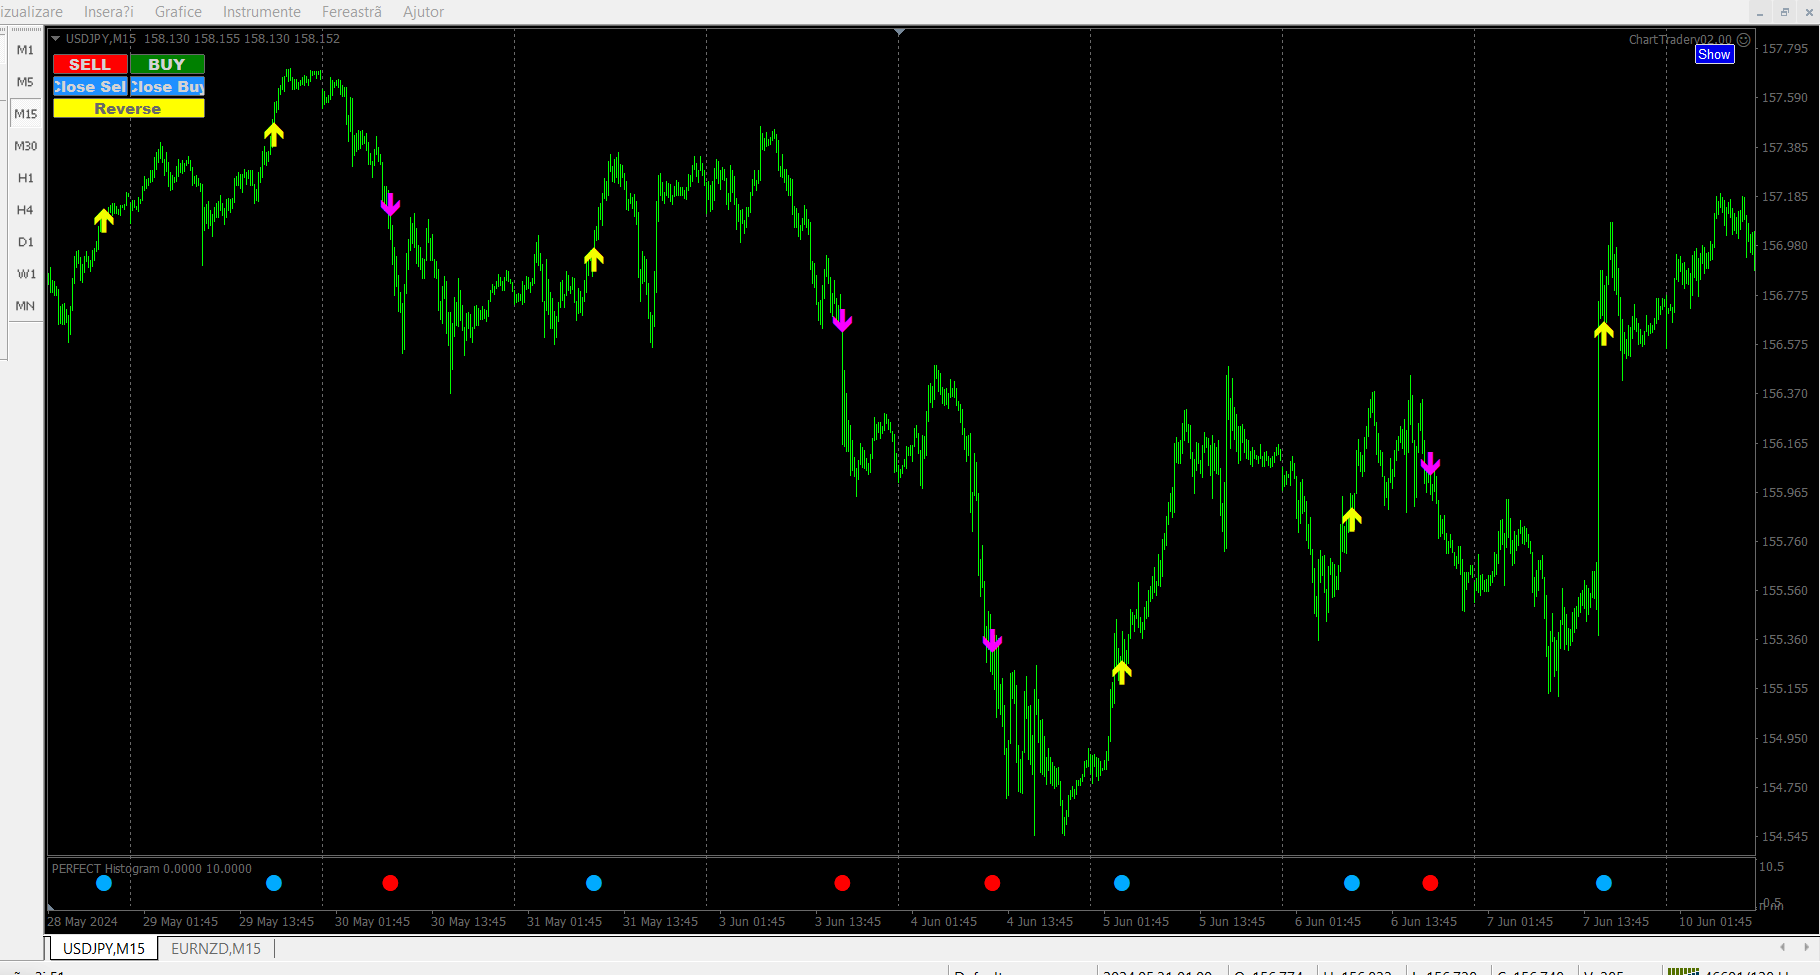
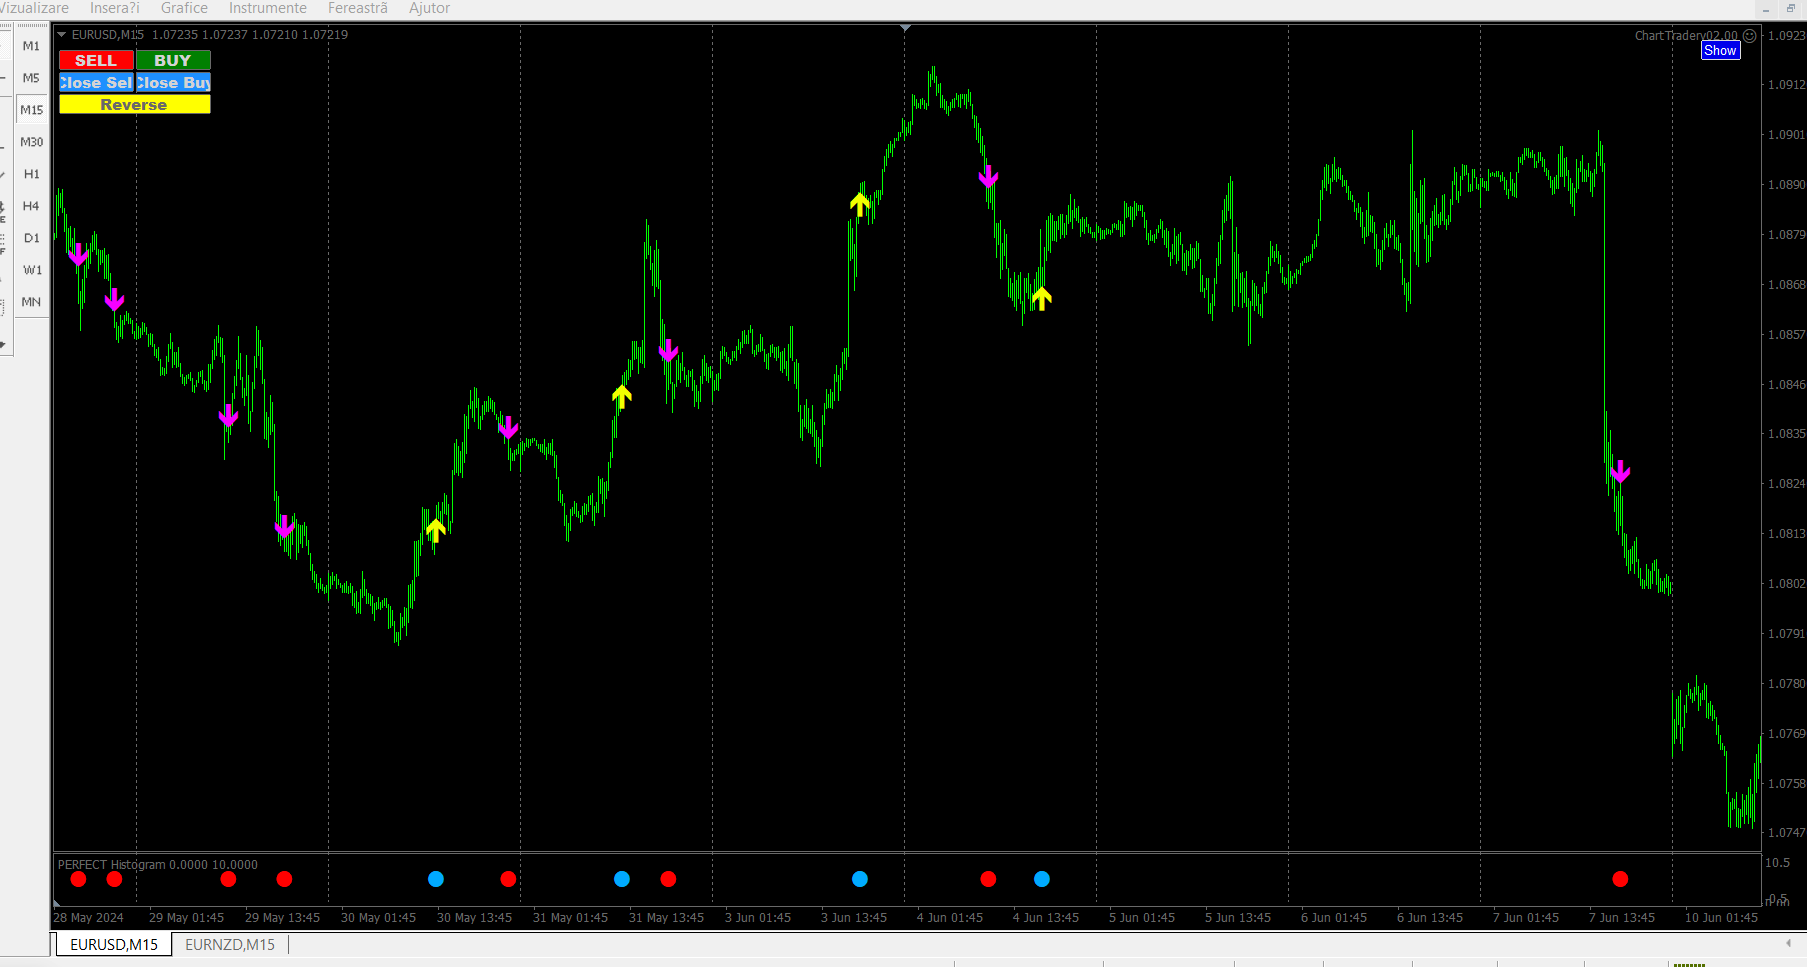
Acest indicator este indicatorul săgeților PERFECT transformat într-un indicator histogramă.
Faceți cumpărături la cercul albastru.
Vindeți cercului roșu.
Acest indicator este de câteva ori mai bun decât BRICS indicator.
Și asta este foarte bine.
În primul rând pentru că dă semnale mai des.
Se poate tranzacționa de mai multe ori pe zi folosind mai multe valute Perechi.
În al doilea rând, tranzacțiile sunt, în general, mai lungi.
Profitul țintă poate depăși 10 sâmburi.
Deși recomand pentru siguranță să fie 10 sâmburi.
Dar se poate face în funcție de situație.
În al treilea rând, acest indicator merge pe toate perechile.
Recomand mai întâi M15.
Indicatoarele Histogramă PERFECT și PERFECT nu revopsesc.
Vedeți videoclipul.
Vă doresc succes!
IMPORTANT!
Verificați mai întâi indicatorul sau expertul pe un cont DEMO, înainte de a-l cumpăra!
Analizați-l bine!
Vorbeste cu vanzatorul!
Închiriați-l pentru o perioadă mai scurtă de timp.
Pentru a vedea cum funcționează și dacă funcționează pe computer.
Odată ce l-ați cumpărat, nu veți putea să-l returnați și să obțineți banii înapoi.