Candle Bull and Bear Multi Time Frame
- インディケータ
- Ricky Andreas
- バージョン: 1.0
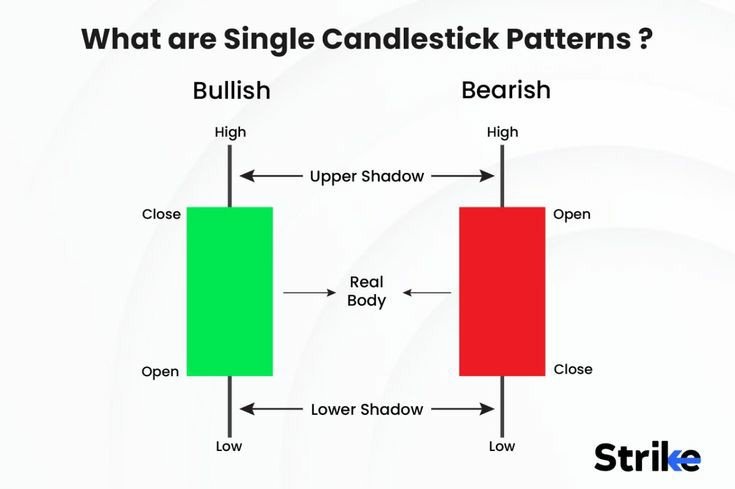
This indicator is used to measure bullish and bearish candles on each time frame and I provide notifications for reminders
This indicator is used to measure bullish and bearish candles on each time frame and I provide notifications for reminders