Liquidity ICT Series
- インディケータ
- Juan Pablo Castro Forero
- バージョン: 1.0
- アクティベーション: 20
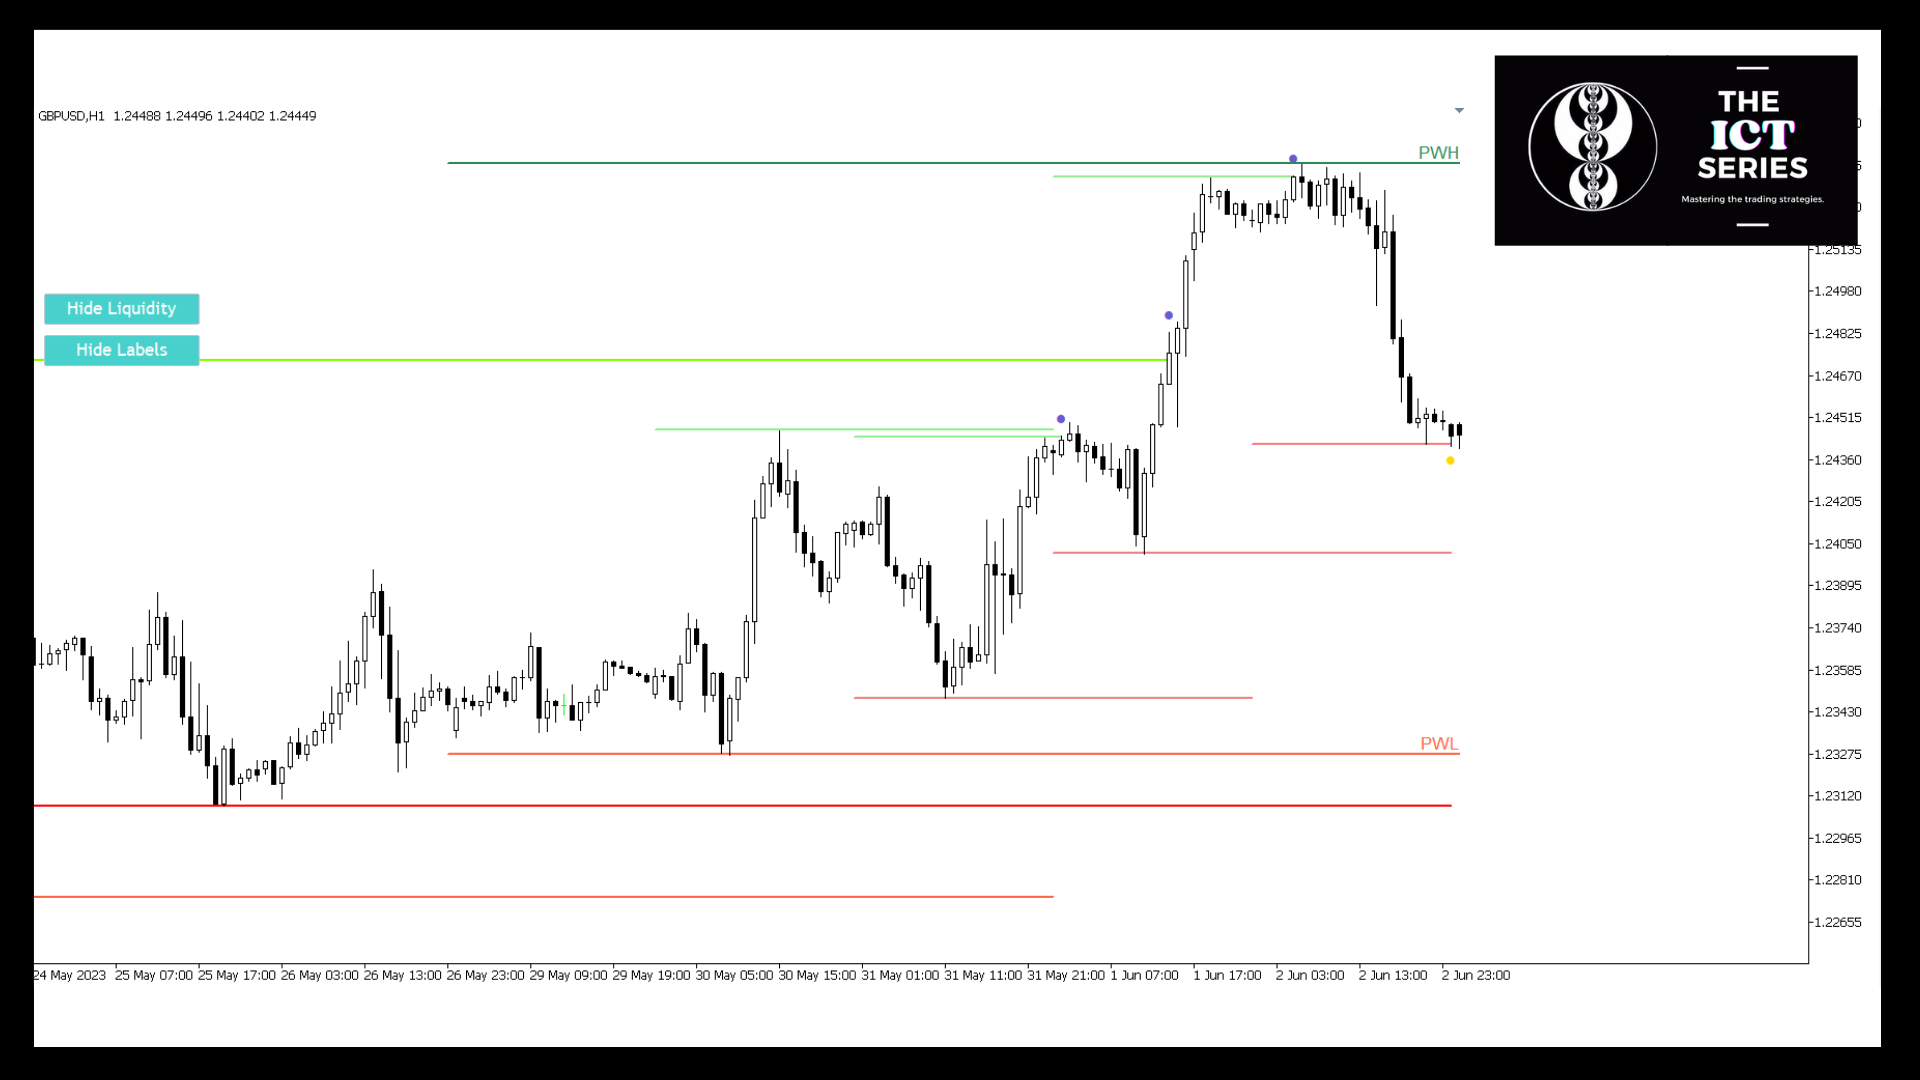
Liquidity ICT はエントリーポイントを見つけるための最適なツールです。流動性プールがタップされたときにアラートを受け取り、理想的な取引のタイミングを把握します。アラートは取引方向を知らせ、最も近い流動性プールでの利確ポイントを設定します。このインジケーターを使用すると、取引する方向と、どのレベルで利確とストップロスを設定するべきかがわかります。機関投資家の視点から市場を理解するのに役立つよう設計されています。
流動性ICTで何ができますか?
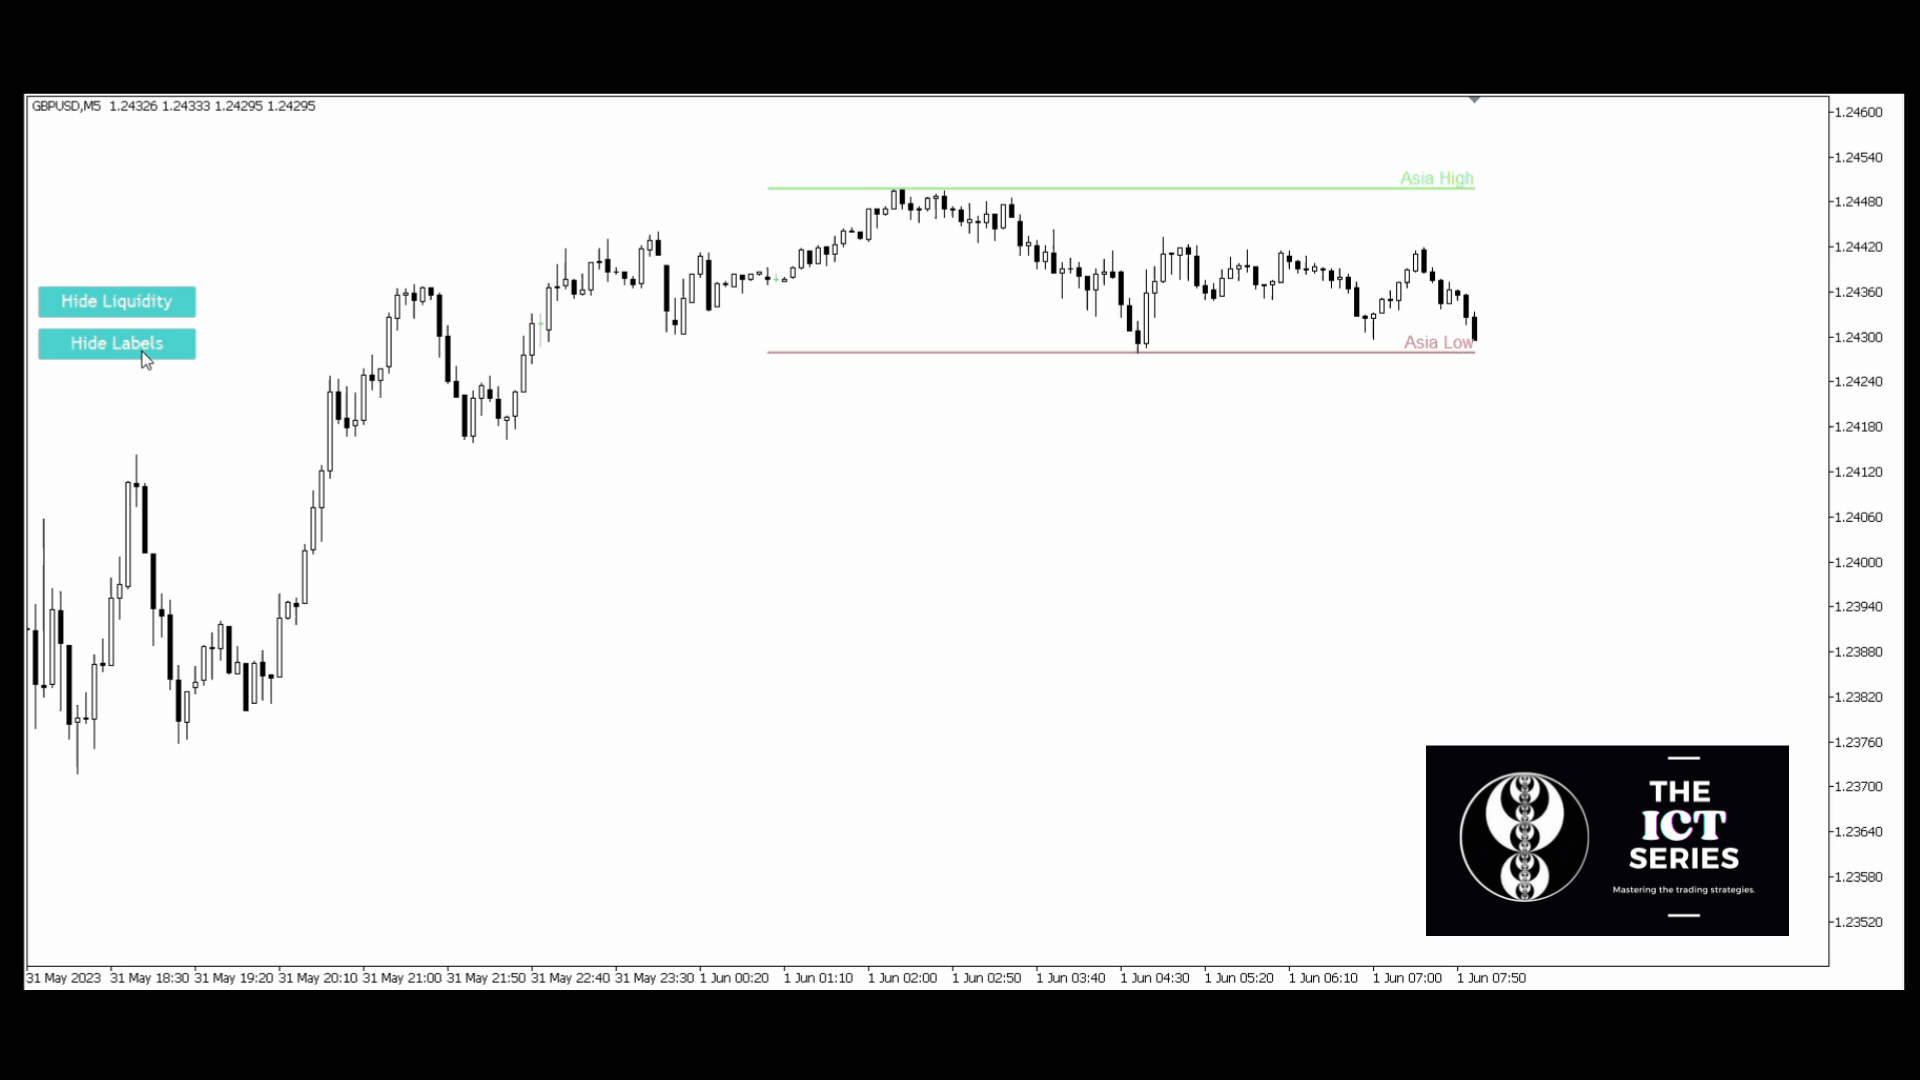
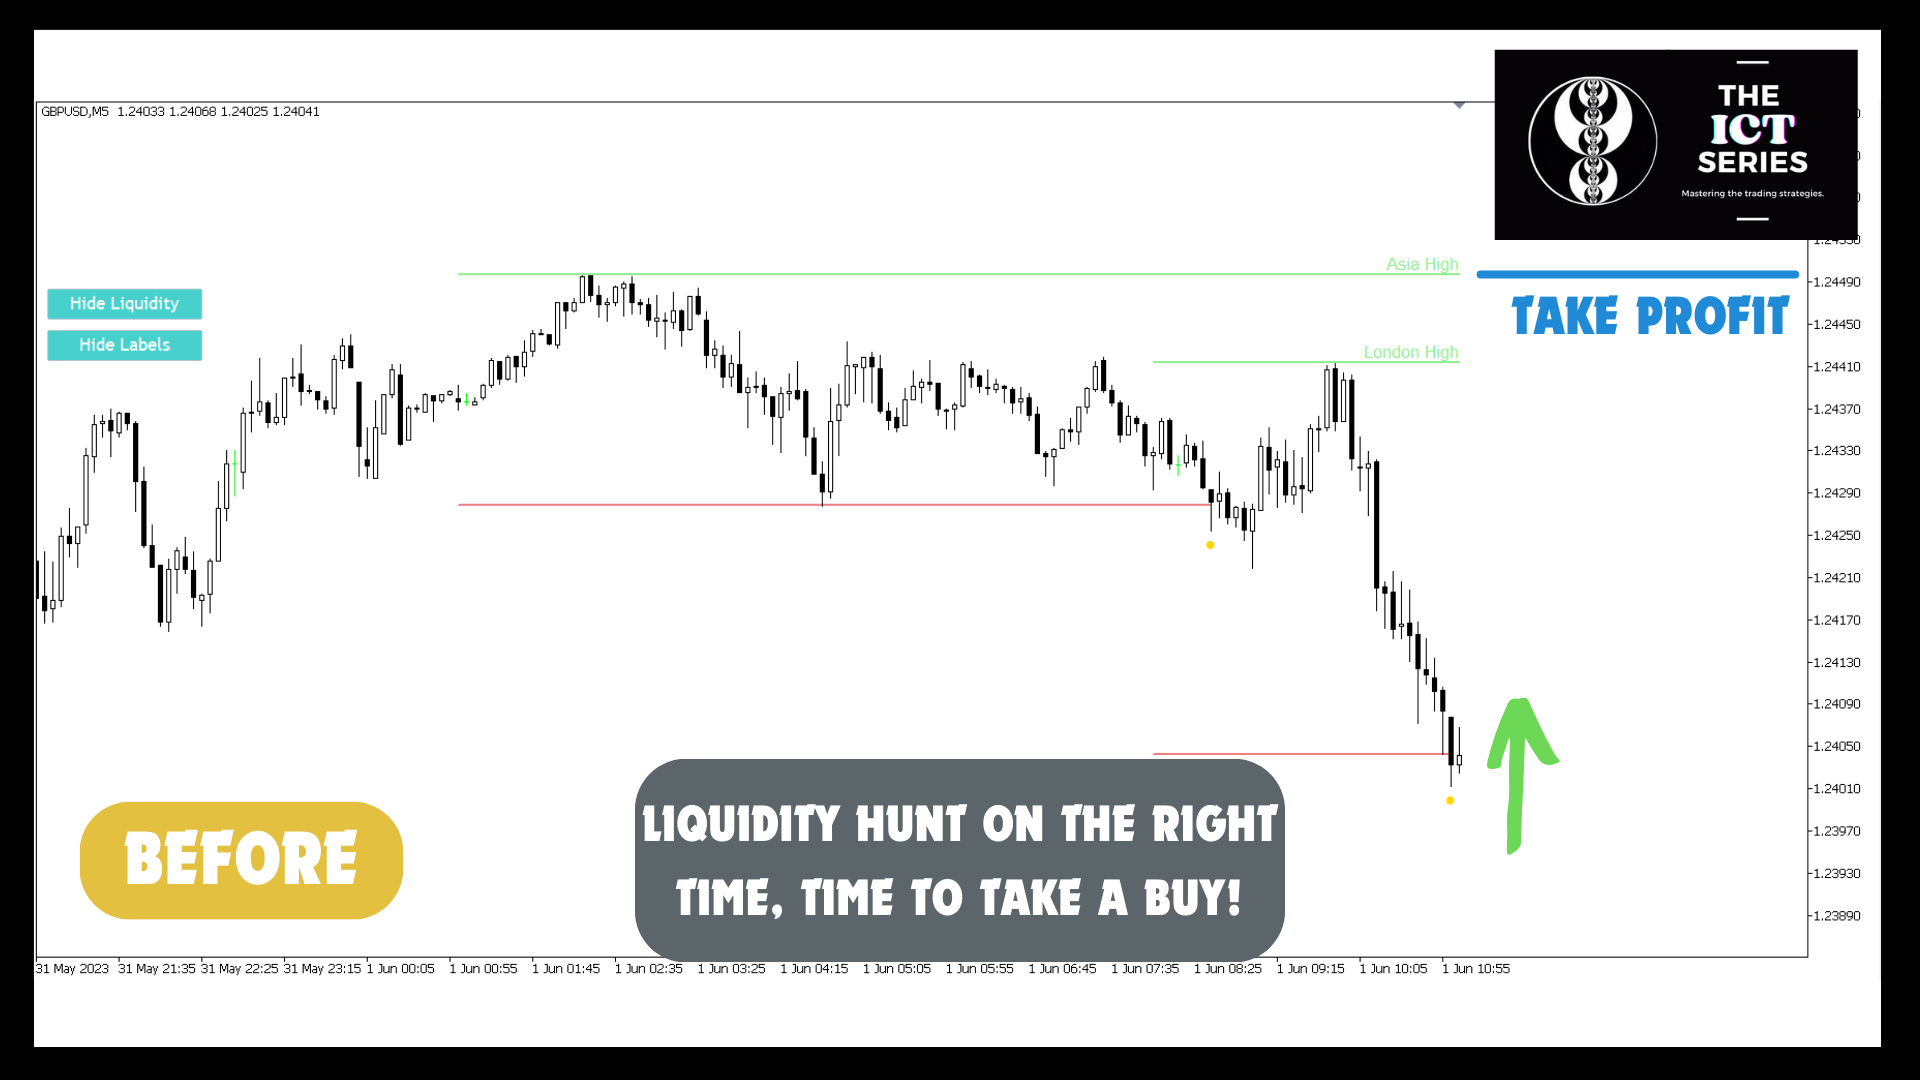
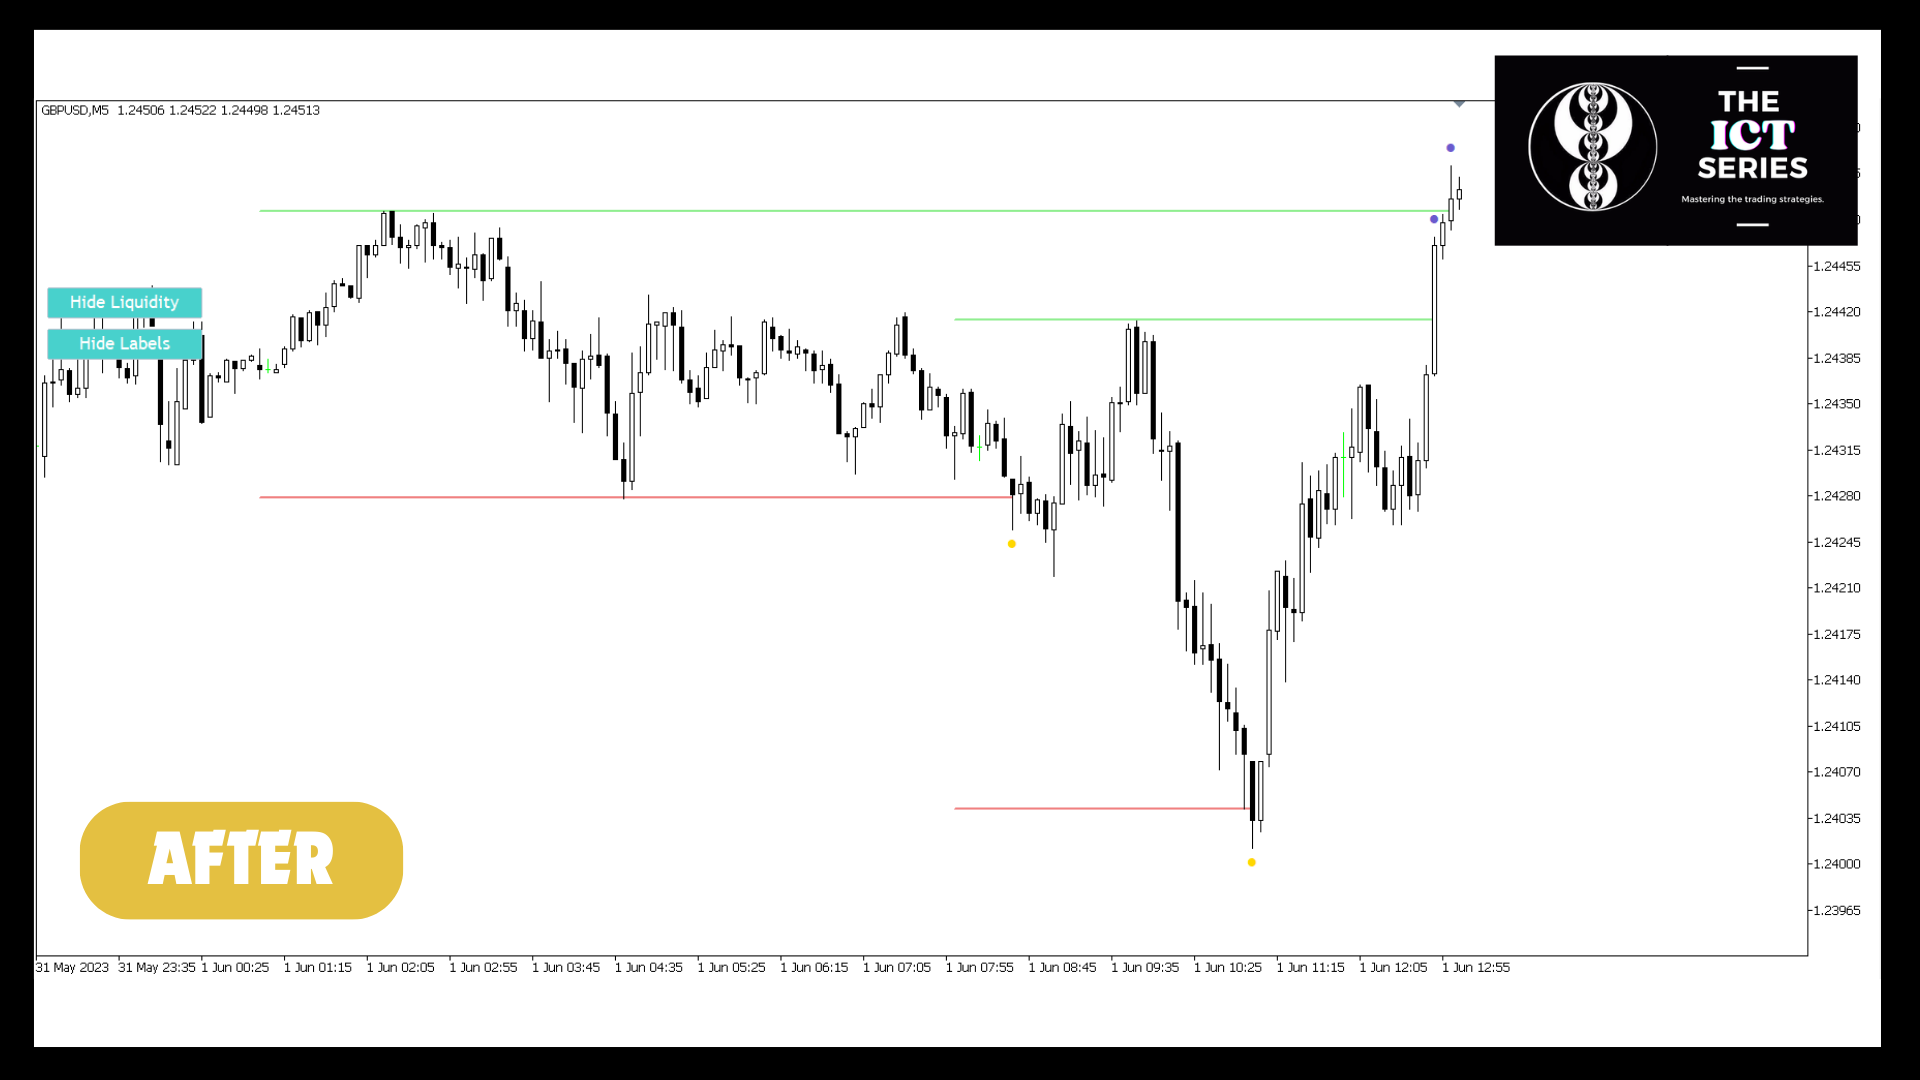
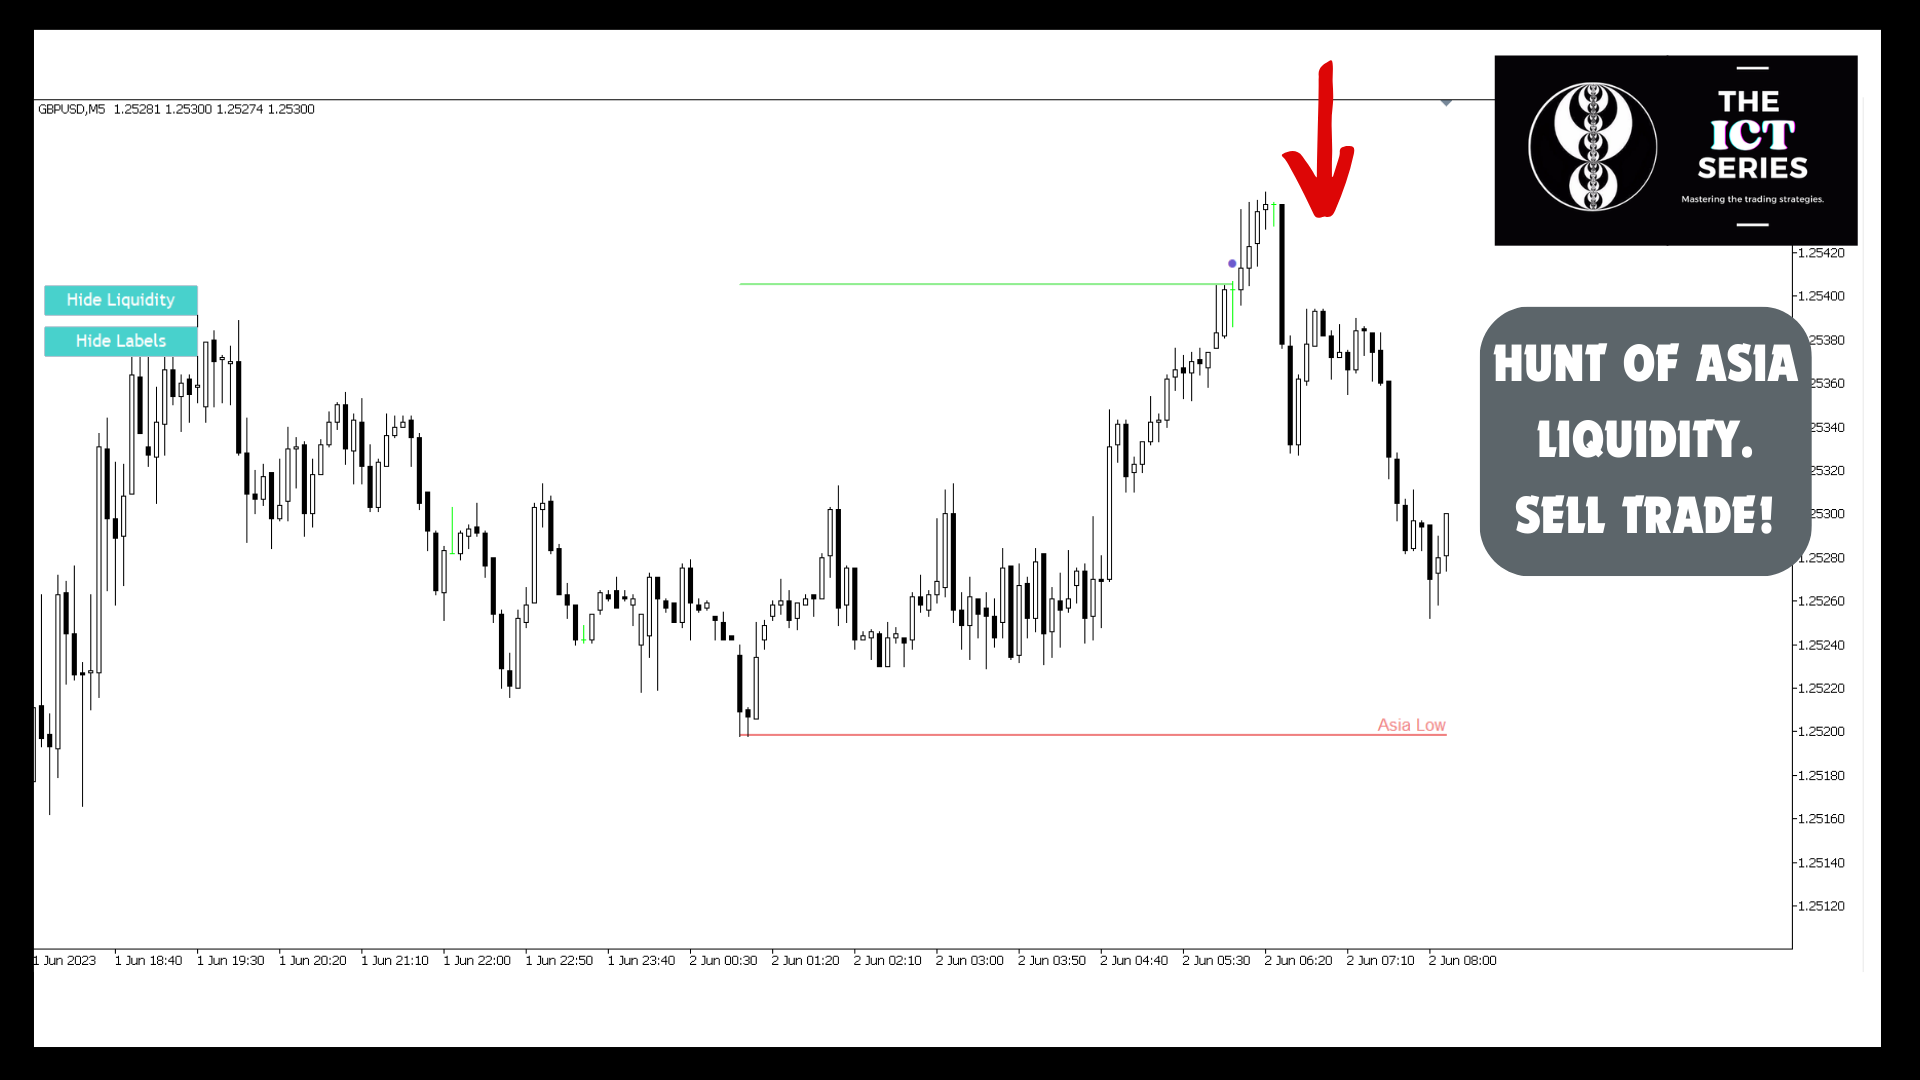
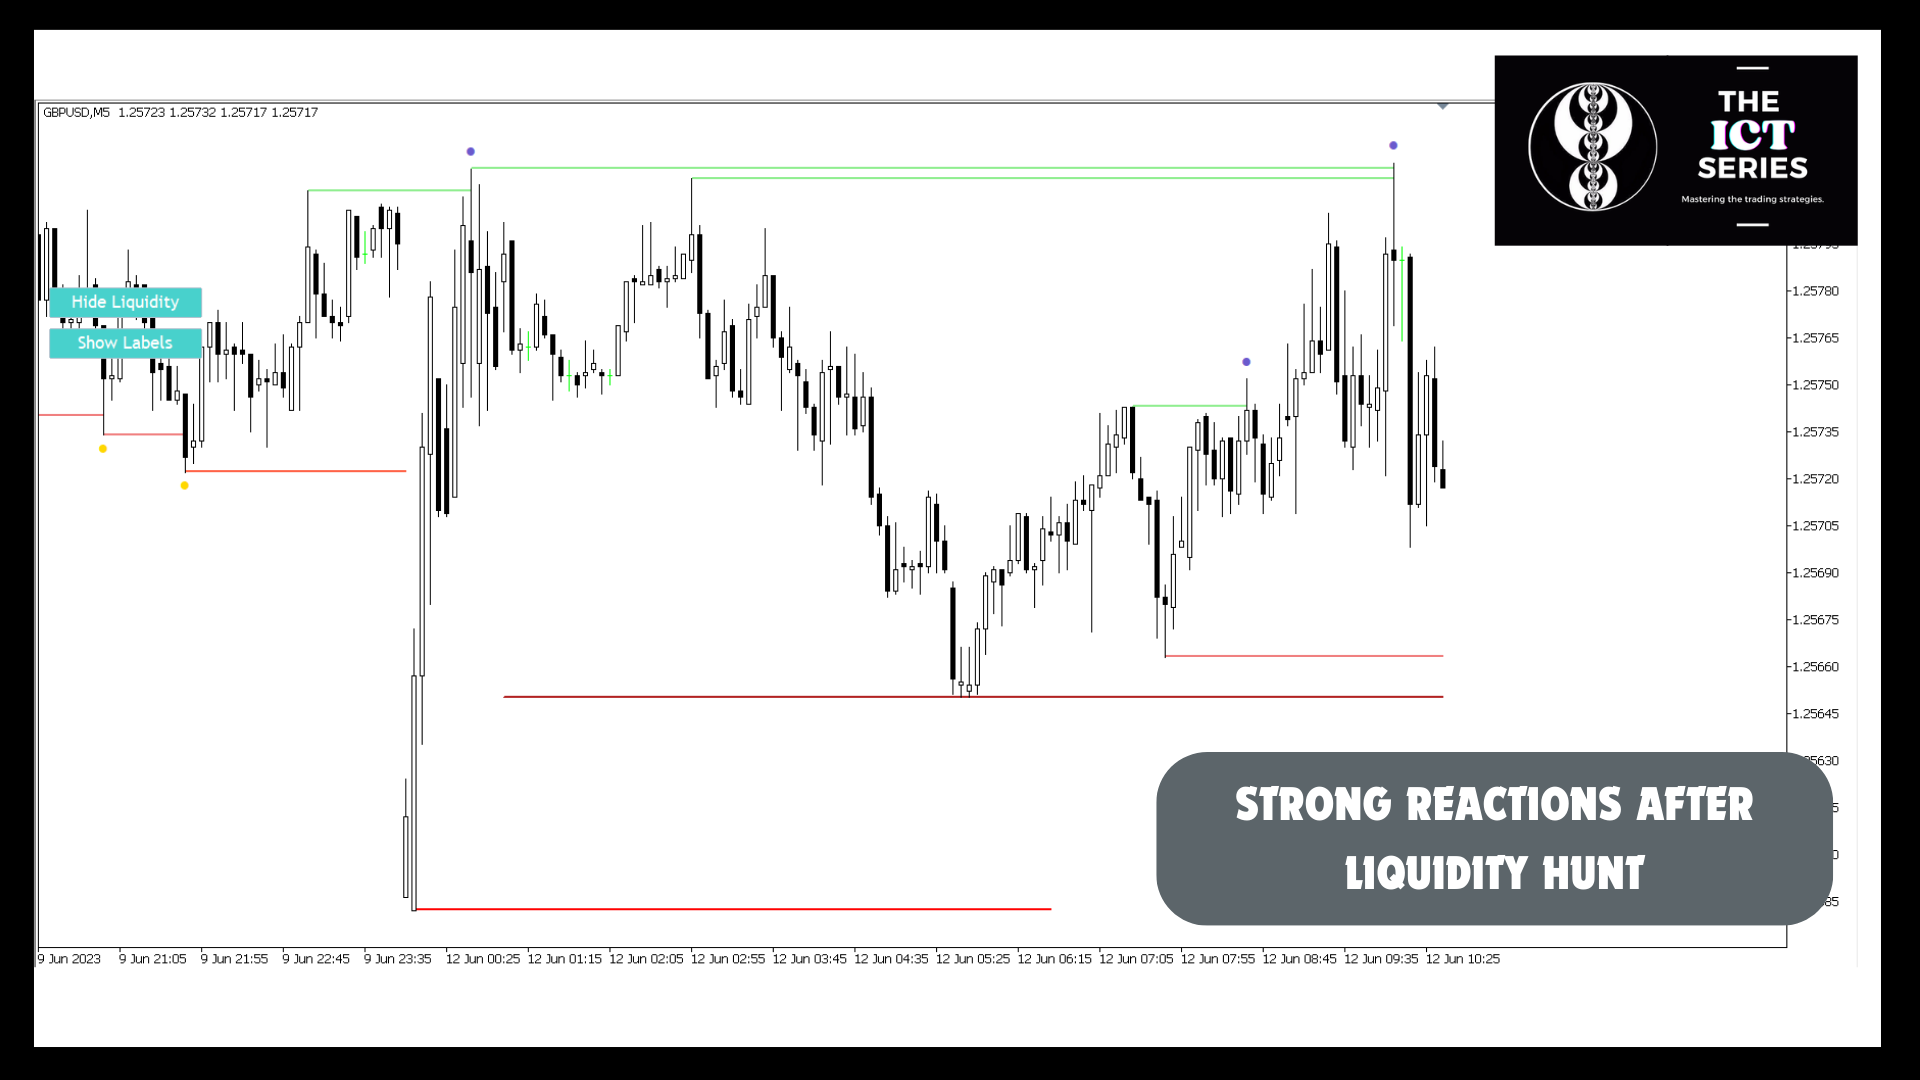
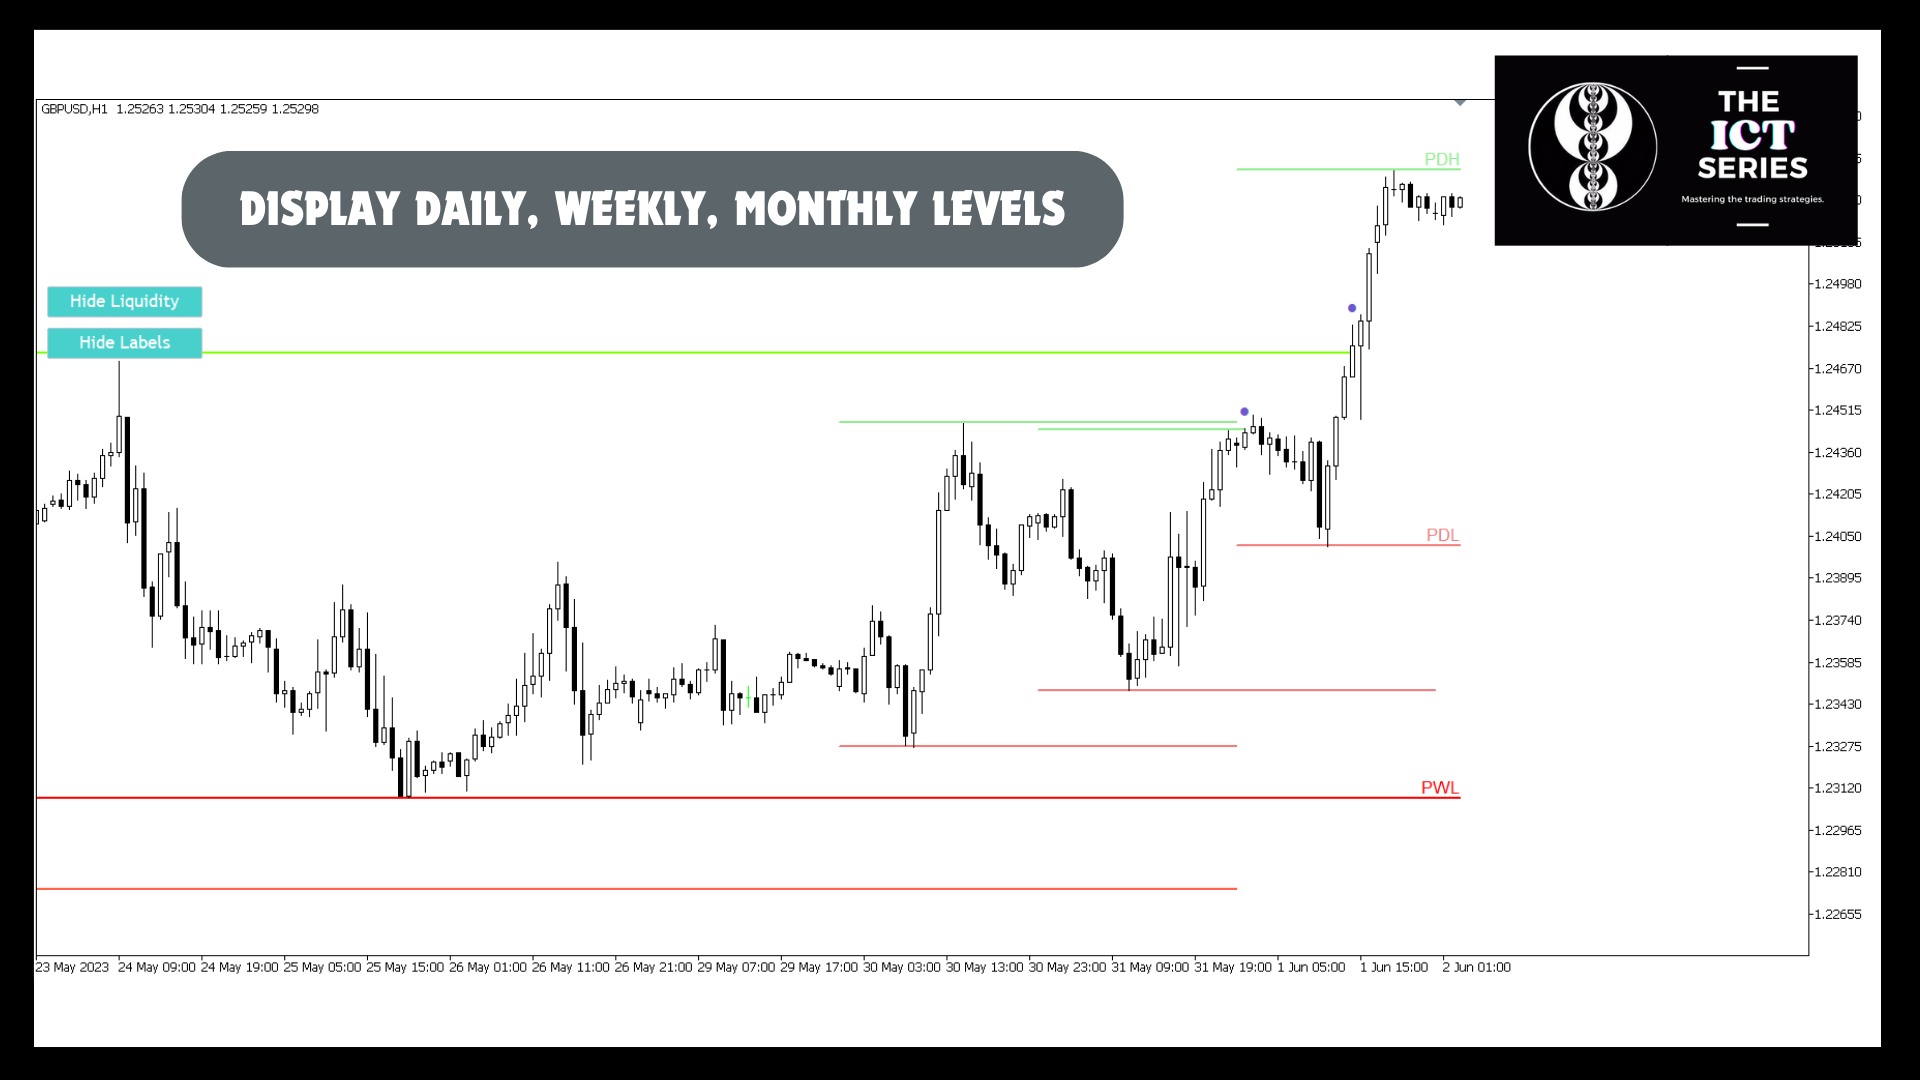
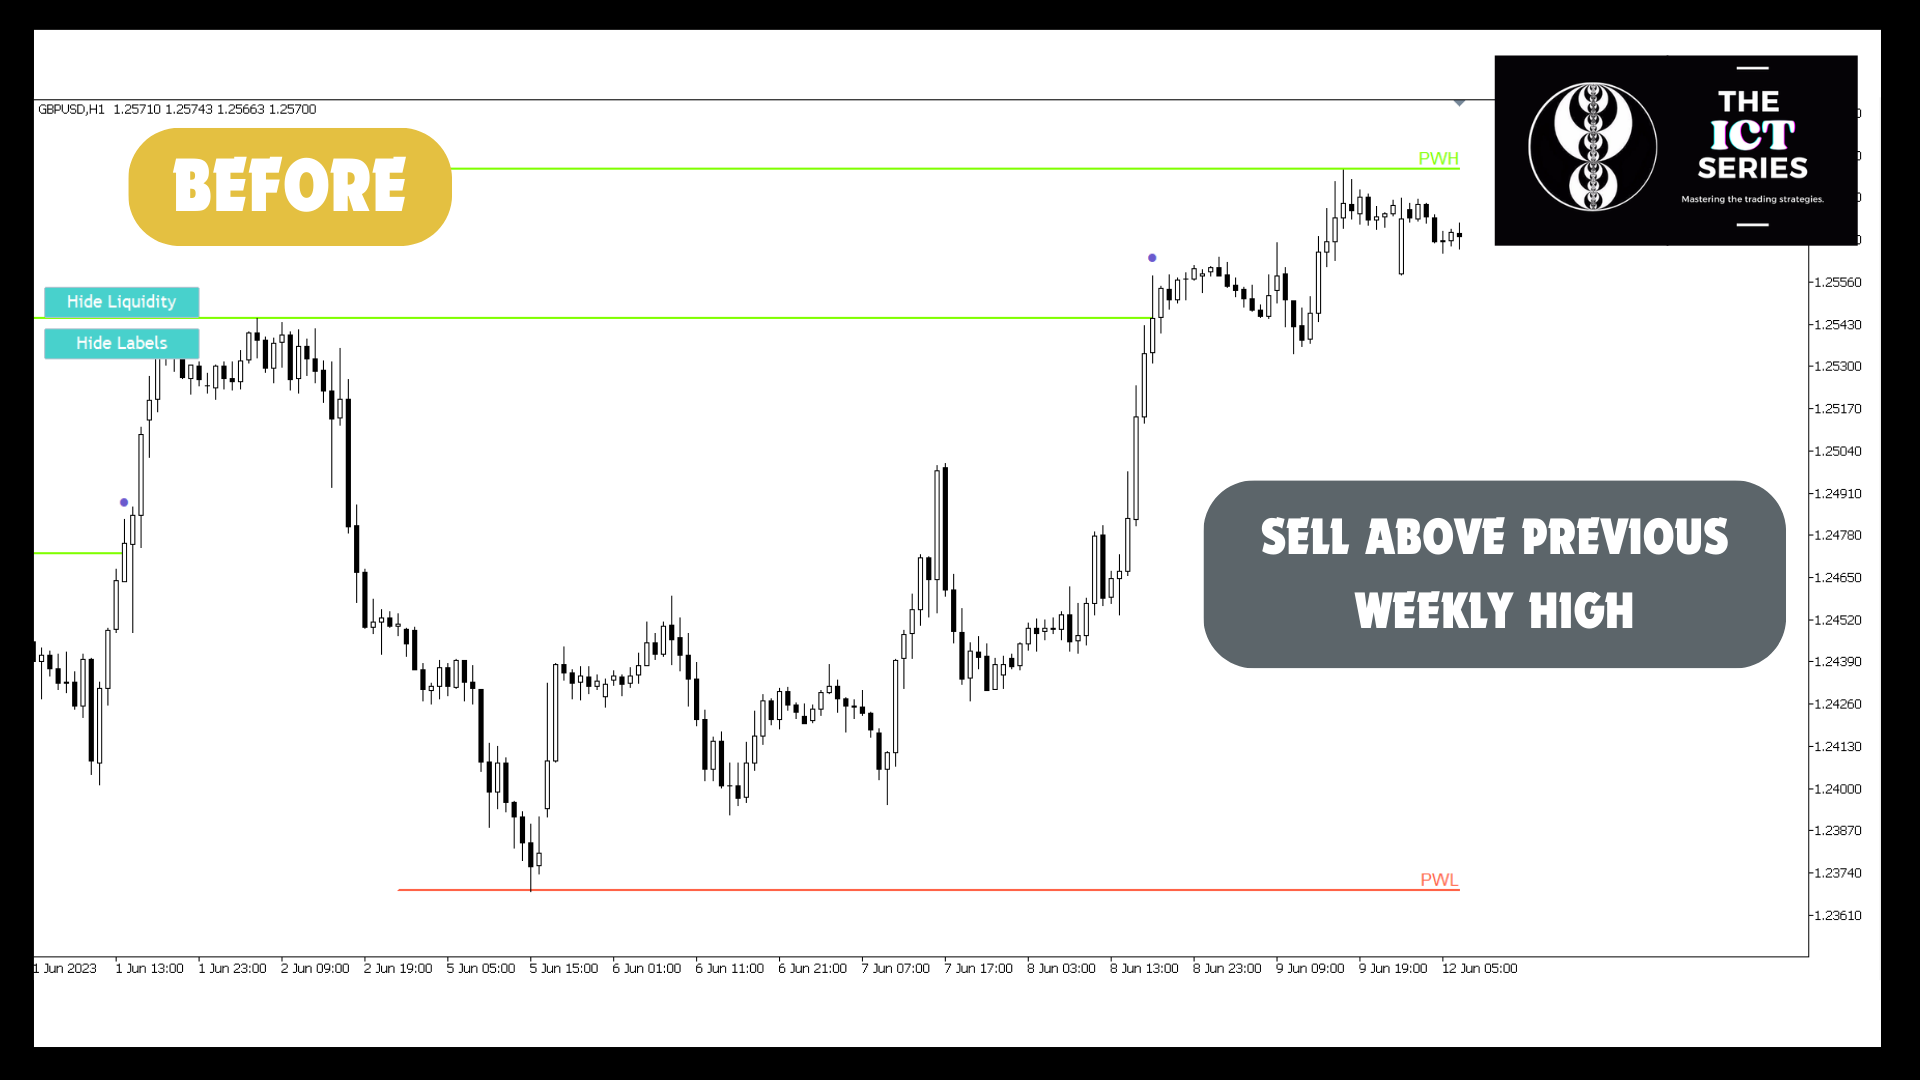
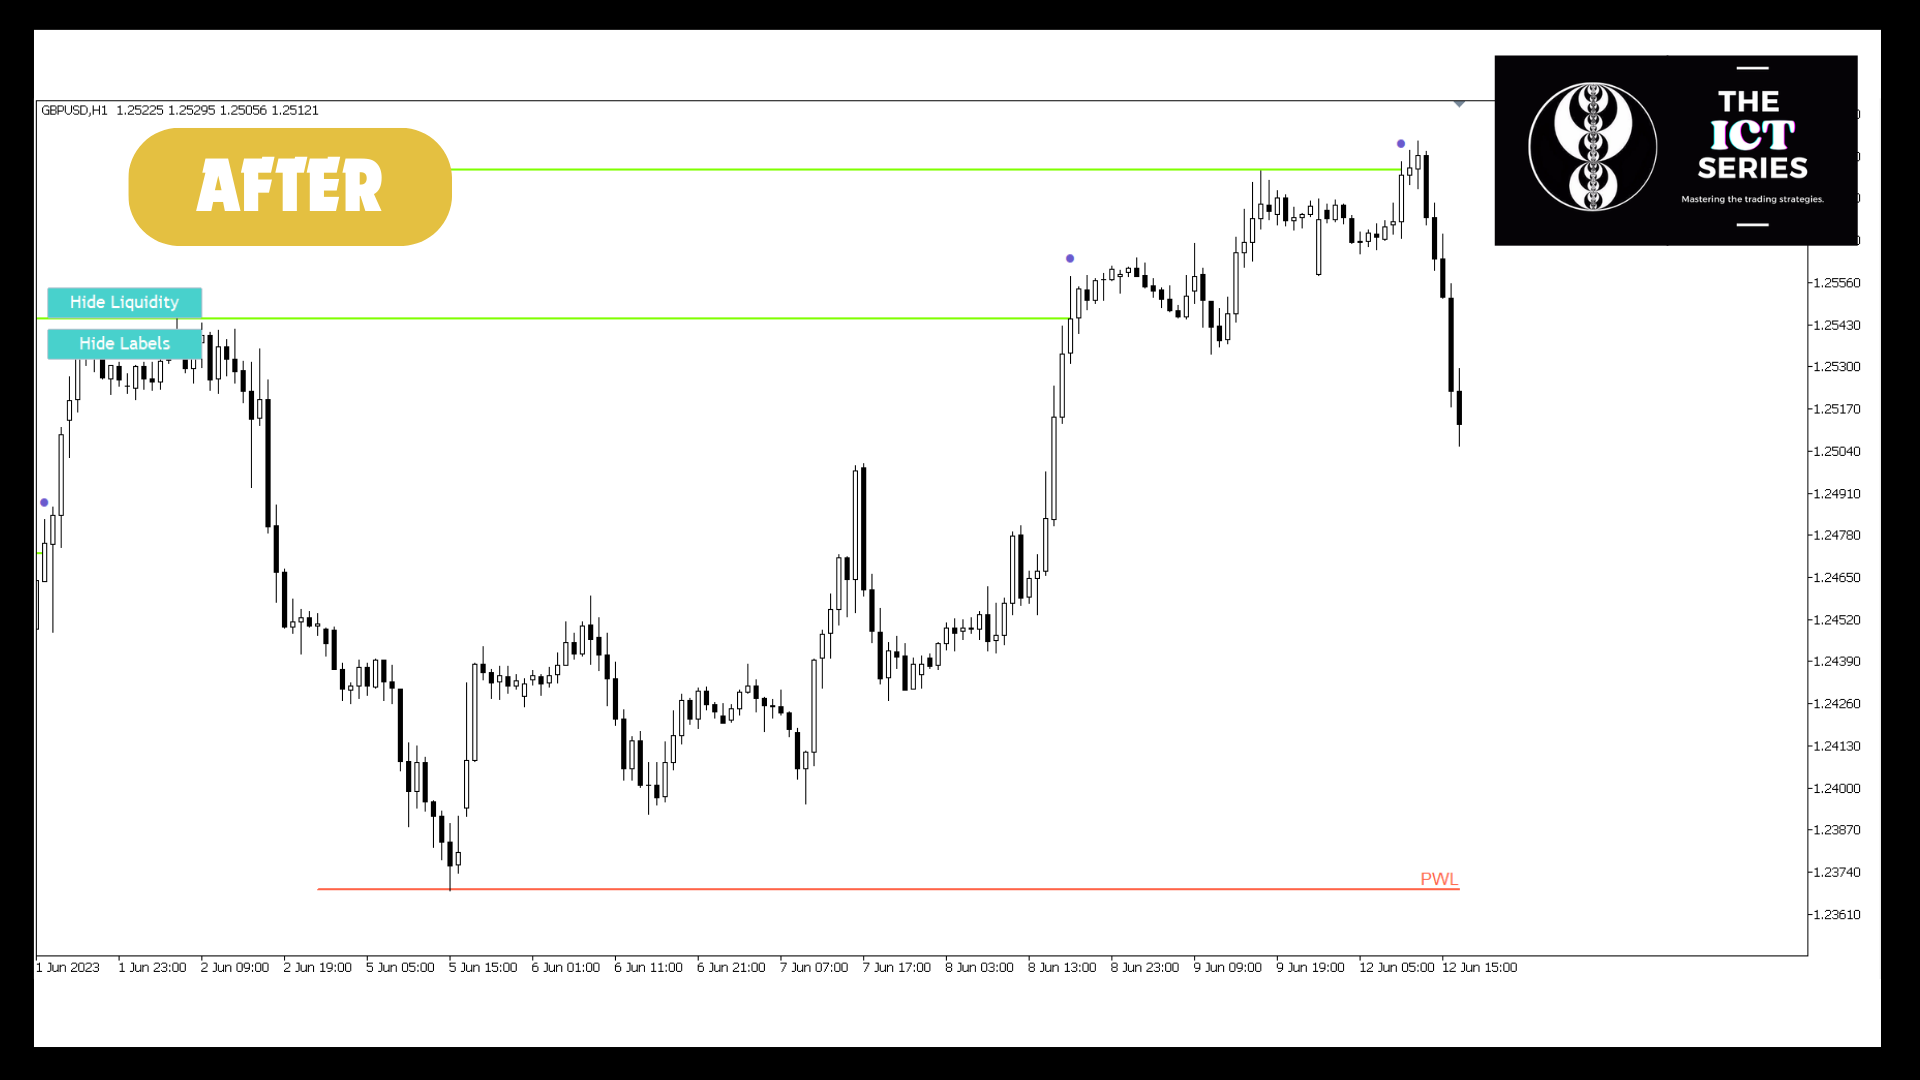
このツールで認識できる流動性プールの中には、セッションの高値や安値、前日、前週、前月のレベルなど、時間ベースの流動性があります。さらに、高度なアルゴリズムがあり、反応を起こす可能性のある最も近い流動性プールを認識し、明確に識別できる異なる重要度でカタログ化し、より強い反応や弱い反応を期待するのに役立ちます。さらに、このインジケーターにはフィルターがあり、どのレベルの重要性 を見たいかをフィルタリングすることができ、より強い流動性プールや弱い流動 性プールを選択することができます。このインジケータを使えば、タートル・スープのような、流動性プールを待って、価格とモメンタムを逆方向に急変させる戦略を取引することができます。
その他の機能
- 流動性ハントのアラートにより、取引に最適なタイミングを通知。
- 最も近い流動性プールのみを表示することで、きれいなチャートを表示。
- 最も可能性の高い反転ゾーンをプロット。
なぜ流動性ICTを使うのか?
このツールは、あなたのトレードを新たなレベルに引き上げるために不可欠です。また、インナーサークルトレーダー(ICT)や他のトレーダーが教える流動性ベースの戦略、スマートマネートレーディングやその他の理論のような最も興味深い概念のいくつかを取引するためにも。 上記の記事では、インジケーターをどのように戦略に使用し、最も効果的な方法でトレードするかについての戦略を紹介しています。このインジケーターを使うことで、市場のダイナミクスを理解し、どのような価格帯で相場が動く可能性が高いか、また、どのような地域が変動しにくいかを知ることができます。また、損切り注文や利食い注文を戦略的に発注する水準を特定するのにも役立 ち、ストップ狩りに巻き込まれるリスクを減らすことができます。さらに、最適なエントリーポイントとエグジットポイントを特定することで、 損失を最小限に抑えながら利益の可能性を最大化することができます。
このインディケータは、ICT SERIESコレクションの一部です。また、ICTシリーズで見たいアイデア、コンセプト、ストラテジーをお持ちの方は、ダイレクトメッセージまたはコメントでお知らせください。シリーズの主な焦点は、インナーサークルトレーダーのコンセプト(ICT )、スマートマネーのコンセプト、機関投資家の取引、流動性のコンセプト、タートルスープ、IPDA、Wyckoffです。コミュニティに参加する