The indicator determines a special pattern of Joe Dinapoli. It gives very high probability buy and sell signals. Indicator does not repaint. Indicator Usage Buy Signal ''B'' Entry : Market buy order at signal bar close Stop : Low of signal bar Take Profit : First swing high Sell Signal ''S'' Entry : Market sell order at signal bar close Stop : High of signal bar Take Profit : First swing low Indicator Parameters Fast EMA : External Parameter (should be kept as default) Slow EMA: External Param
Alerts you on new trends, with ENTRY and EXIT points. INSTRUCTIONS Select asset of choice, activate the indicator on the chart and just follow the signals from the arrows. ITS FREE, GIVE ME A GOOD RATING!
Platform : Metatrader4 Asset : All Currencies, Gold, BTCUSD, NASDAQ PS : F or newbie and pro traders. Used by more 3,000 traders around the world.
Send a mail for further help and information...........
buy sell star indicator has a different algoritms then up down v6 and buy sell histogram indicators. so that i put this a another indicator on market. it is no repaint and all pairs and all time frame indicator. it need minimum 500 bars on charts. when the white x sign on the red histogram that is sell signals. when the white x sign on the blue histogram that is sell signals. this indicator does not guarantie the win.price can make mowement on direction opposite the signals. this is multi tim
The Strong Volume Trend MT4 indicator is a powerful tool designed to help traders identify and capitalize on significant volume trends in the financial markets. With its advanced algorithm, this indicator accurately detects the strength and direction of volume movements, allowing traders to make informed trading decisions. Features: Volume Strength Analysis: The indicator analyzes the volume data and identifies strong volume trends, helping traders spot potential market reversals, breakouts, or
Contact me for instruction, any questions! Introduction Triangle chart patterns are used in technical analysis , which is a trading strategy that involves charts and patterns that help traders identify trends in the market to make predictions about future performance.
Triangle Pattern Scanner Indicator It is usually difficult for a trader to recognize classic patterns on a chart, as well as searching for dozens of charts and time frames will take time, and there is also a possibility of a
Signal Arrows is an indicator that generates trade arrows. It generates trade arrows with its own algorithm. These arrows give buying and selling signals. Can be used in all pairs. Sends a signal to the user with the alert feature. The indicator certainly does not repaint.
Trade rules Enter the signal when the buy signal arrives. In order to exit from the transaction, an opposite signal must be received. It is absolutely necessary to close the operation when an opposite signal is received. Th
Arrows appear after Reversal-Pattern and when the confirmation-candle reaches its value, it won't disappear (no repaint). but with fix settings no additional settings necessary Entry : immediately after arrow Stop loss : a few pips above the high of the arrow - candle / below the low of the arrow - candle Take Profit : at least the next candle / move to break even after candle closed / trail the SL works on : Major Forex-pairs / M15 and higher time-frames The Value of the confirmation-candle =>
Some informations on the chart with the single attachment. RangeBorder Buy Sell (RBBS) Non Repaint Indicator will provide trend line, buy sell arrows,reversal arrows, range channel, order exit area,high average price line and low average price line.All arrows and lines don't repaint and not lagging. Once candle closed it won't repaint. Reading Indicator:
1. Small Stars , Indicates oversold and overbought with certain logic and price may reverse when this small star triggers. Useful to identif
PTW NON REPAINT TRADING SYSTEM + HISTOGRAM Non-Repainting , Non-Redrawing and Non-Lagging Trading System.
Does the following: - Gives Accurate Entry and Exit Points - Scalping, Day and Swing Trading - 95% Accuracy - Targets, where to take profits. - Shows Trends, Support and resistance levels - Works on All Brokers - Works on All Currencies, CFDs and Stocks - It does not place trades for you, it only shows you what trades to place. - It works on All Timeframes - It is for Trend or ra
Icarus Bolli-Band Change Display(TM) Indicator is a simple, but highly effective tool for visually identifying areas where the all-important 'Bollinger Band' values are in a state of expansion, contraction of neither. The traditional Bollinger Bands have been widely applied to trading charts globally since their creation by John Bollinger several decades ago. One of the limitations of the traditional Bollinger Bands is the ability to clearly identify when the bands are in fact expanding or contr
To get access to MT5 version please click here . This is the exact conversion from TradingView:"HIGH AND LOW Optimized Trend TrackerHL OTT" by "kivancozbilgic" This is a light-load processing indicator. It is a non-repaint indicator. Colored Candle and Highlighting options are not available. Buffers are available for processing in EAs. You can message in private chat for further changes you need. Thanks.
Developed methods for trading collected in one indicator. In the form of arrows, it defines entries in the direction of the trend.
It has 2 types of arrows - trend and signal guides, informing about the potential movement in the direction of the trend.
Works without redrawing, ready for use on all symbols/tools.
The most suitable time frames to use are M15, M30, H1, H4.
How to use
The indicator finds the direction of the trend in the form of a signal arrow, a graphic rectangle stretches
HC candlestick pattern is a simple and convenient indicator able to define candle patterns. Candlestick charts are a type of financial chart for tracking the movement of securities. They have their origins in the centuries-old Japanese rice trade and have made their way into modern day price charting. Some investors find them more visually appealing than the standard bar charts and the price action is easier to interpret. Hc candlestick pattern is a special indicator designed to find divergence
Algorithmic Signals indicator is not an indicator but a strategy that generates entry/exit signals. The entry arrows are formed after multiple conditions are met. The indicator is using an Adaptive Algorithm which automatically adjust to the symbol and time frame (see the screenshots below) . Signals can be used for scalping or even trend trading. Main features:- Non repainting signals Entry signals Exit signals Alert for price reaching 1 x ATR(14) (could be utilized for initial take prof
Stronger Trend is an indicator that generates trend signal. It generates trend signal with its own algorithm. These arrows give buying and selling signals. The indicator certainly does not repaint. Can be used in all pairs. Sends a signal to the user with the alert feature.
Trade rules Enter the signal when the buy and sell signal arrives. Processing should only be initiated when signal warnings are received. It is absolutely necessary to close the operation when an opposite signal is received
TRADE EXTRACTOR is the fastest self-learning AI Algorithm, which will learn any market situation with ease.As a Manual trader, I came across the difficulty of finding the right parameter and the right condition to trade. There are infinite combinations of indicators and objects(trendlines, gann grid, fibo levels etc) which as an human, I can’t decide their winning rate or performance. Many claim to have a winning strategy but won’t have enough statistical support to prove their claims. Due to
Introducing the Accumulated RSI, your ultimate tool for precise trend identification and momentum analysis in the world of Forex and financial markets. This cutting-edge MetaTrader 4 (MT4) indicator, designed for traders seeking unparalleled insight and accuracy, empowers you to make well-informed trading decisions like never before. Features Accurate Trend Detection: The Accumulated RSI utilizes the Relative Strength Index (RSI) in an innovative way to pinpoint the prevailing market trends wit
This indicator shows in a subwindow the trend in M1, M5, H1, D1 timeframes based on MA, MACD, Stochastic This way you could see in once in different timeframes what happening. This is my first free indicator. Please follow I will put here some more. Thank you for you attention. . . . . .
lfknglkslksnlgslgnsflgjrpoesv ,msv lkrjpfjésmdg sd.npo4wsmdglknsp4jwpkeégmfs.lkmp Thank you
Global Trend Indicator, shows the signals for entry. Displays both entry points and the trend itself. Shows statistically calculated moments for entering the market with arrows. When using the indicator, the risk factor can be optimally distributed.
Settings:
Uses all one parameter for settings. Choosing a parameter, it is necessary to visually resemble it so that the appropriate graph has a projection of extremes.
Parameters:
Length - the number of bars for calculating the indicator.
A useful scanner/dashboard that shows the RSI values for multiple symbols and time-frames.
It can be easily hidden/displayed with a simple click on the scanner man top left of the dashboard.
You can input upper and lower RSI values and the colours can be set to show when above/below these values. The default values are 70 and 30. There are also input colours for when the RSI is above or below 50 (but not exceeding the upper/lower levels
Symbols and time-frames are input separated by comma
What does this do? It shows you on the chart which stop belongs to which entry. Have you ever had multiple positions or trades open on a single pair and were confused which stop loss goes with what entry? Even worse, the stop loss orders for buy and sells are the same color on the chart. Well, your problem has been solved! This indicator will show you which stop belongs to which entry. It will place a vertical line and an arrow on the chart for each open trade. A yellow line connects the entry
Result look on https://t.me/BonosuProBinary Pair : All Forex Pairs Time Frame : M1 Expaired : 1-2 Minutes Trade Time Once Time a Day Backtester, Alert Avaliable Average Signals Generate 5 - 20 Signals All Pair A Day Broker Time Zone GMT+3 Default Setting [Example Broker GMT+3 : Alpari, FBS, XM] Support Broker : Deriv, IQOption, Alpari, Binomo, Olymtrade, Qoutex, GCoption, etc Support Auto Trading : MT2 Trading, Binary Bot, Intrade Bot, Binomo Bot, Olymptrad Bot, MX2 trading, Price Pro, etc Ind
Result look on https://t.me/BonosuProBinary Pair : All Forex Pairs Time Frame : M1 Expaired : 1-2 Minutes Trade Time Once Time a Day Backtester, Alert Avaliable Average Signals Generate 5 - 20 Signals All Pair A Day Broker Time Zone GMT+3 Default Setting [Example Broker GMT+3 : Alpari, FBS, XM] Support Broker : Deriv, IQOption, Alpari, Binomo, Olymtrade, Qoutex, GCoption, etc Support Auto Trading : MT2 Trading, Binary Bot, Intrade Bot, Binomo Bot, Olymptrad Bot, MX2 trading, Price Pro, etc Ind
" Valiant Strong Trend " - Your Ultimate MT4 Signal Indicator Are you ready to elevate your trading game to new heights? Look no further than the "Valiant Strong Trend" MT4 signal indicator, your indispensable tool for navigating the complex world of financial markets. Key Features: Precise Trend Identification : "Valiant Strong Trend" employs advanced algorithms to accurately identify market trends, whether they are bullish or bearish. Say goodbye to guesswork and hello to informed trading deci
This indicator is the translated version of Anıl ÖZEKŞİ's MOST Indicator, developed on the Matriks Data Terminal, into the MQL4 language. It is a trend-following indicator and quite successful. Its usage will be free and unlimited for a lifetime. You can click on my profile to access the MQL5 version of this indicator. You can also get your programming requests for MQL4 and MQL5 languages done at İpek Bilgisayar with an invoiced service. You can reach İpek Bilgisayar at www.ipekbilgisayar.org .
This indicator is the translated version of Kıvanç ÖZBİLGİÇ's PMAX Indicator, developed on the Matriks Data Terminal, into the MQL4 language. It is a trend-following indicator and quite successful. Its usage will be free and unlimited for a lifetime. You can click on my profile to access the MQL5 version of this indicator. You can also get your programming requests for MQL4 and MQL5 languages done at İpek Bilgisayar with an invoiced service. You can reach İpek Bilgisayar at www.ipekbilgisayar.or
Reversal First Impulse levels (RFI) INSTRUCTIONS RUS - ENG R ecommended to use with an indicator - TREND PRO - Version MT5 A key element in trading is zones or levels from which decisions to buy or sell a trading instrument are made. Despite attempts by major players to conceal their presence in the market, they inevitably leave traces. Our task was to learn how to identify these traces and interpret them correctly. Main functions: Displaying active zones
TPSpro TRENDPRO - is a trend indicator that automatically analyzes the market and provides information about the trend and each of its changes, as well as giving signals for entering trades without redrawing! The indicator uses each candle, analyzing them separately. referring to different impulses - up or down impulse. Exact entry points into transactions for currencies, crypto, metals, stocks, indices! - Version MT5 DETAILED DESCRIPTION R ecommended to use with
An exclusive indicator that utilizes an innovative algorithm to swiftly and accurately determine the market trend. The indicator automatically calculates opening, closing, and profit levels, providing detailed trading statistics. With these features, you can choose the most appropriate trading instrument for the current market conditions. Additionally, you can easily integrate your own arrow indicators into Scalper Inside Pro to quickly evaluate their statistics and profitability. Scalper Inside
note: this indicator is for METATRADER4, if you want the version for METATRADER5 this is the link: https://www.mql5.com/it/market/product/108106 TRENDMAESTRO ver 2.4 TRENDMAESTRO recognizes a new TREND in the bud, he never makes mistakes. The certainty of identifying a new TREND is priceless. DESCRIPTION TRENDMAESTRO identifies a new TREND in the bud, this indicator examines the volatility, volumes and momentum to identify the moment in which there is an explosion of one or more of these data a
ECM Elite Channel is a volatility-based indicator, developed with a specific time algorithm, which consists of finding possible corrections in the market.
This indicator shows two outer lines, an inner line (retracement line) and an arrow sign, where the channel theory is to help identify overbought and oversold conditions in the market.
The market price will generally fall between the boundaries of the channel. If prices touch or move outside the channel, it's a trading opportunity.
The
Indicator : RealValueIndicator Description : RealValueIndicator is a powerful tool designed specifically for trading on the EURUSD pair. This indicator analyzes all EUR and USD pairs, calculates their real currency strength values, and displays them as a single realistic value to give you a head start on price. This indicator will tell you moves before they happen if you use it right. RealValueIndicator allows you to get a quick and accurate overview of the EURUSD currency pair tops and bottoms,
Thise indicator is up down v6 comes with tradingwiev pinescript. purchased people, after installed on terminal ,contact me on mql5 to get BONUS TradingView pinescript.
up-down indicator is no repaint and works all pairs and lower than weekly time frames charts. it is suitable also 1 m charts for all pairs. and hold long way to signal. dont gives too many signals. when red histogram cross trigger line that is up signal.and price probably will down when blue histogram cross trigger line that
Introduction to X3 Chart Pattern Scanner X3 Cherart Pattern Scanner is the non-repainting and non-lagging indicator detecting X3 chart patterns including Harmonic pattern, Elliott Wave pattern, X3 patterns, and Japanese Candlestick patterns. Historical patterns match with signal patterns. Hence, you can readily develop the solid trading strategy in your chart. More importantly, this superb pattern scanner can detect the optimal pattern of its kind. In addition, you can switch on and off individu
Step into the realm of Forex trading with confidence and precision using XQ, a cutting-edge Forex indicator designed to elevate your trading game to unprecedented heights. Whether you're a seasoned trader or just stepping into the world of currency exchange, XQ Forex Indicator empowers you with the insights and signals needed to make informed trading decisions. The signal conditions are a combination of three indicators, and XQ Forex Indicator only display medium and long-term trends . The
Gold Channel is a volatility-based indicator, developed with a specific timing algorithm for the XAUUSD pair, which consists of finding possible corrections in the market.
This indicator shows two outer lines, an inner line (retracement line) and an arrow sign, where the theory of the channel is to help identify overbought and oversold conditions in the market.
The market price will generally fall between the boundaries of the channel. If prices touch or move outside the channel it is a tra
Please send me Direct message on MQL5 CHAT after purchasing the Indicator for Training and Installation Support There are some additional files that is important to use with the Indicator . So be sure to contact me after purchasing the Indicator So that I can add you for training and support .
If you find any difficulty with installation then send me Direct message here So that I can connect with you via Anydesk or Teamview for the product installation. " Smart Order Block Indicator " to find
SNR LEVEL INDICATOR Accurate Snr level indicator will only display Fresh Levels that are close to the Current Market Price. This indicator is very accurate in mapping Support & resistance levels. there is an alert feature when the price TOUCHES the SNR LEVEL, WHEN CLOSE CANDLE BREAK/REJECT SNR LEVEL.
INDICATOR MARKING ::
- SUPPORT LEVEL == V SHAPE - RESISTANCE LEVEL == APEX LEVEL - GAP RESISTANCE & GAP SUPPORT == OPEN CLOSE CANDLE - SUPPORT BECAME RESISTANCE & RESISTANCE BECAME SUPPORT INDIC
The Reversal Master is an indicator for determining the current direction of price movement and reversal points. The indicator will be useful for those who want to see the current market situation better. The indicator can be used as an add-on for ready-made trading systems, or as an independent tool, or to develop your own trading systems. The Reversal Master indicator, to determine the reversal points, analyzes a lot of conditions since the combined analysis gives a more accurate picture of t
The All-in-One Trade Indicator (AOTI) determines daily targets for EURUSD, EURJPY, GBPUSD, USDCHF, EURGBP, EURCAD, EURAUD, AUDJPY, GBPAUD, GBPCAD, GBPCHF, GBPJPY, AUDUSD, and USDJPY. All other modules work with any trading instruments. The indicator includes various features, such as Double Channel trend direction, Price channel, MA Bands, Fibo levels, Climax Bar detection, and others. The AOTI indicator is based on several trading strategies, and created to simplify market analysis. All-in-One
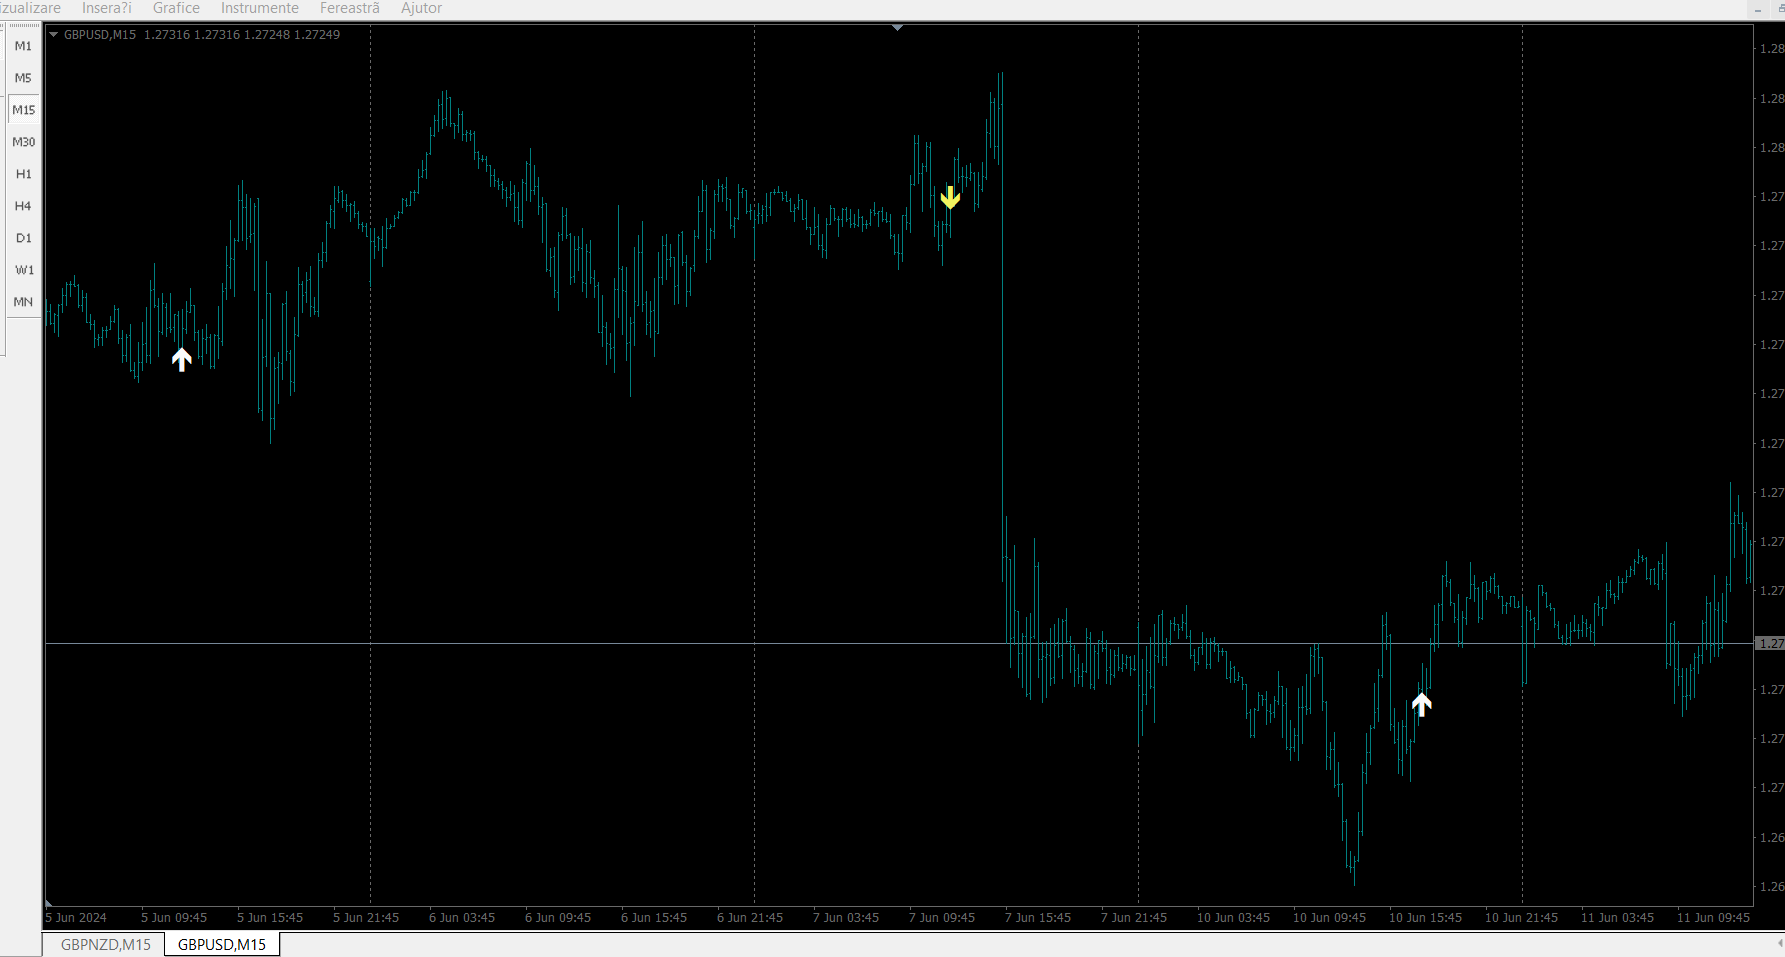
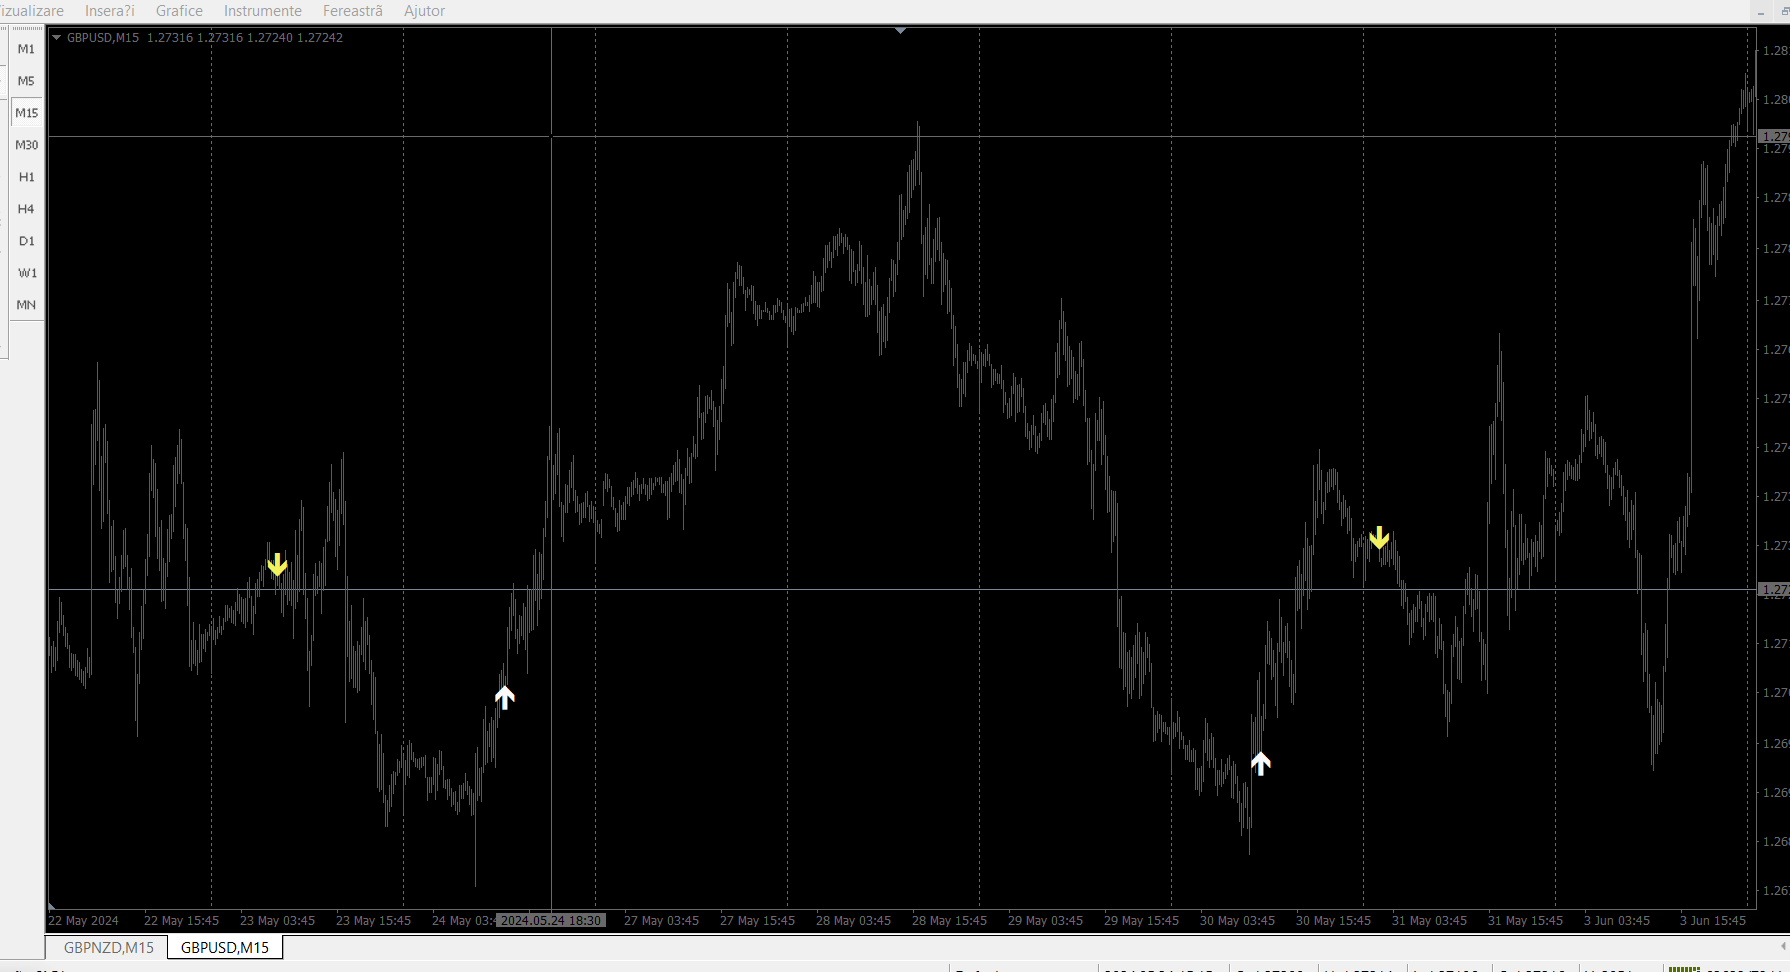
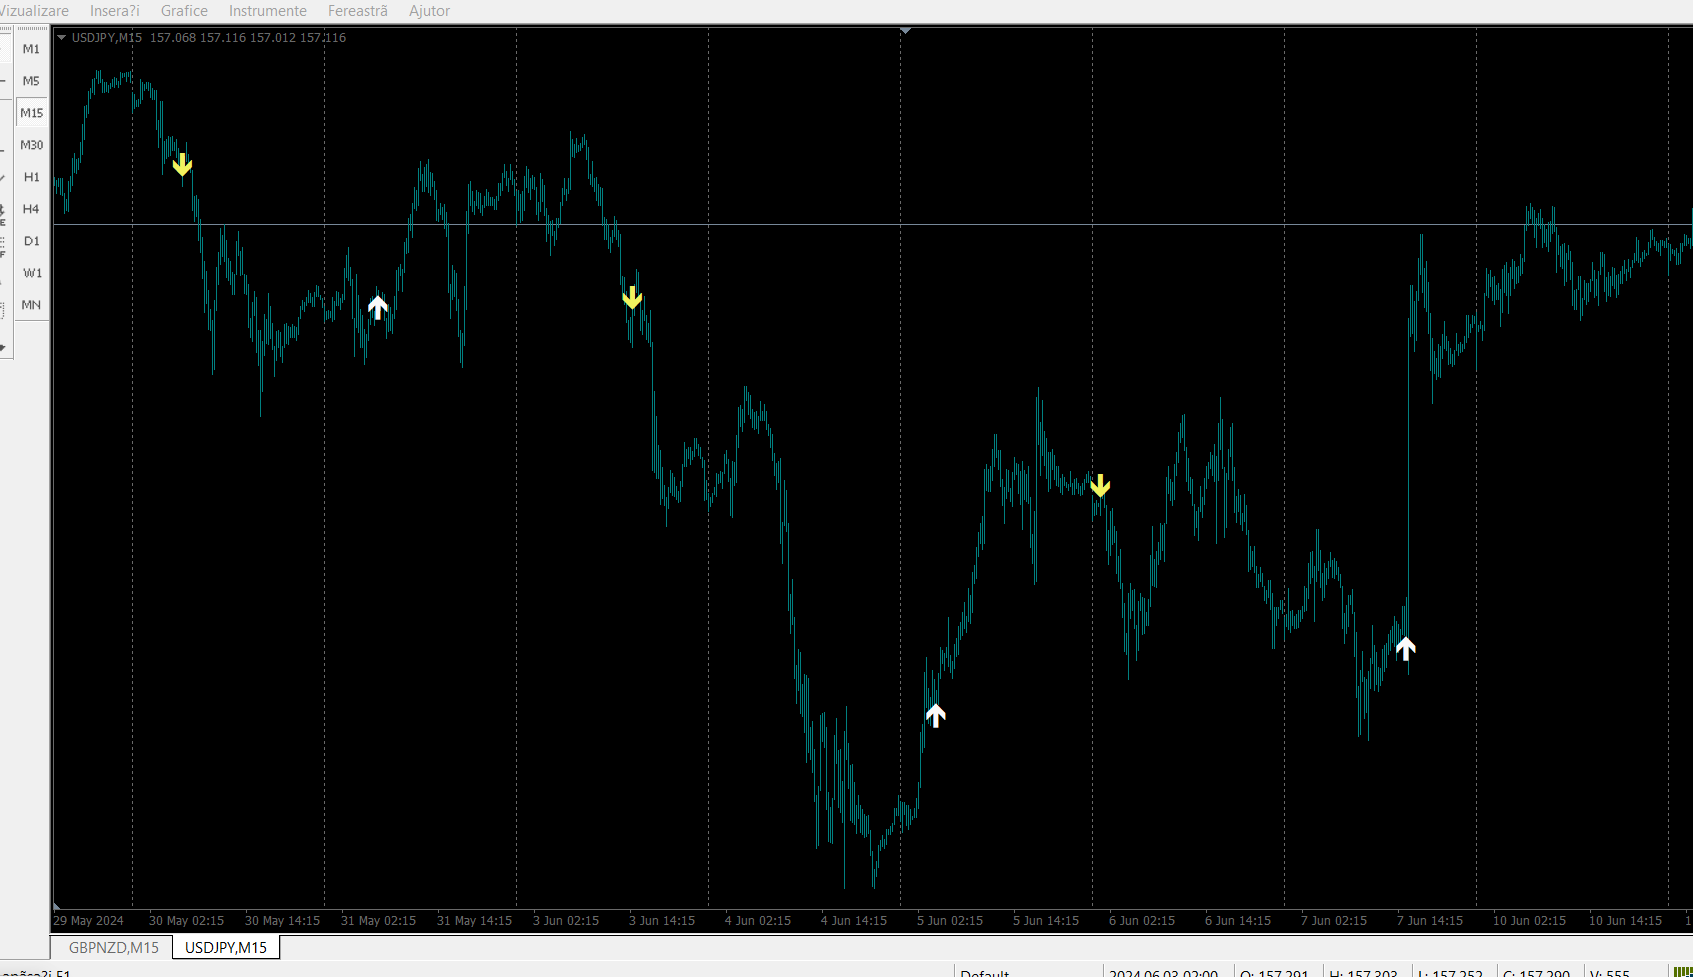
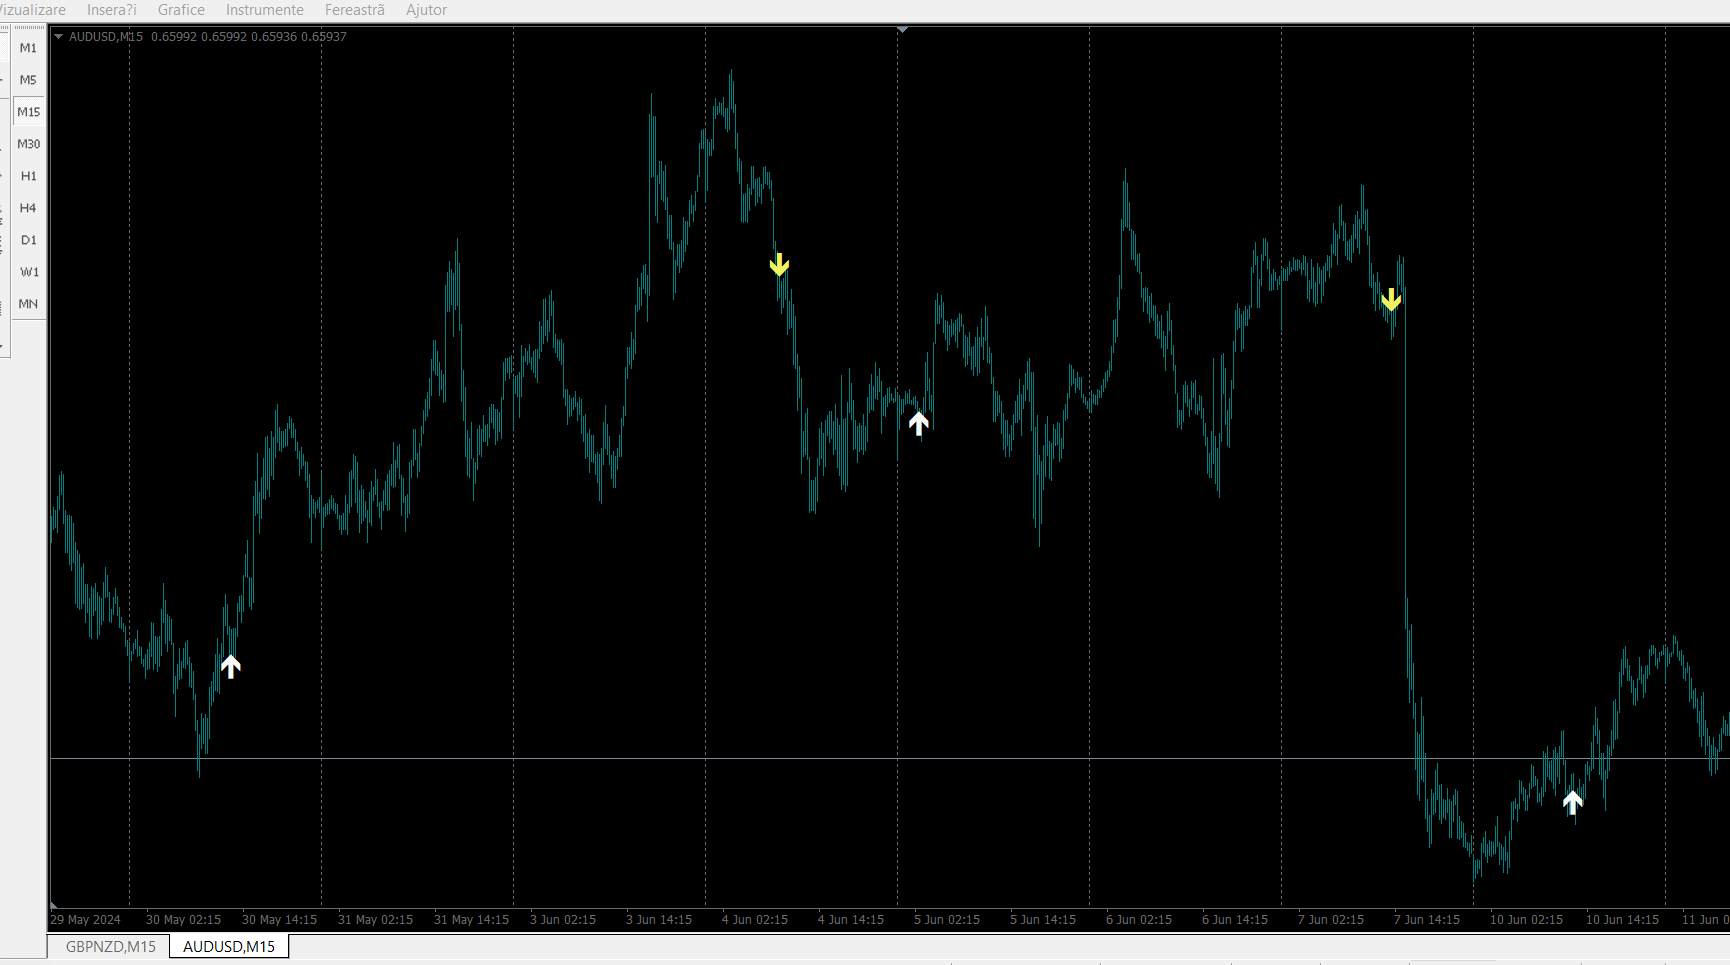
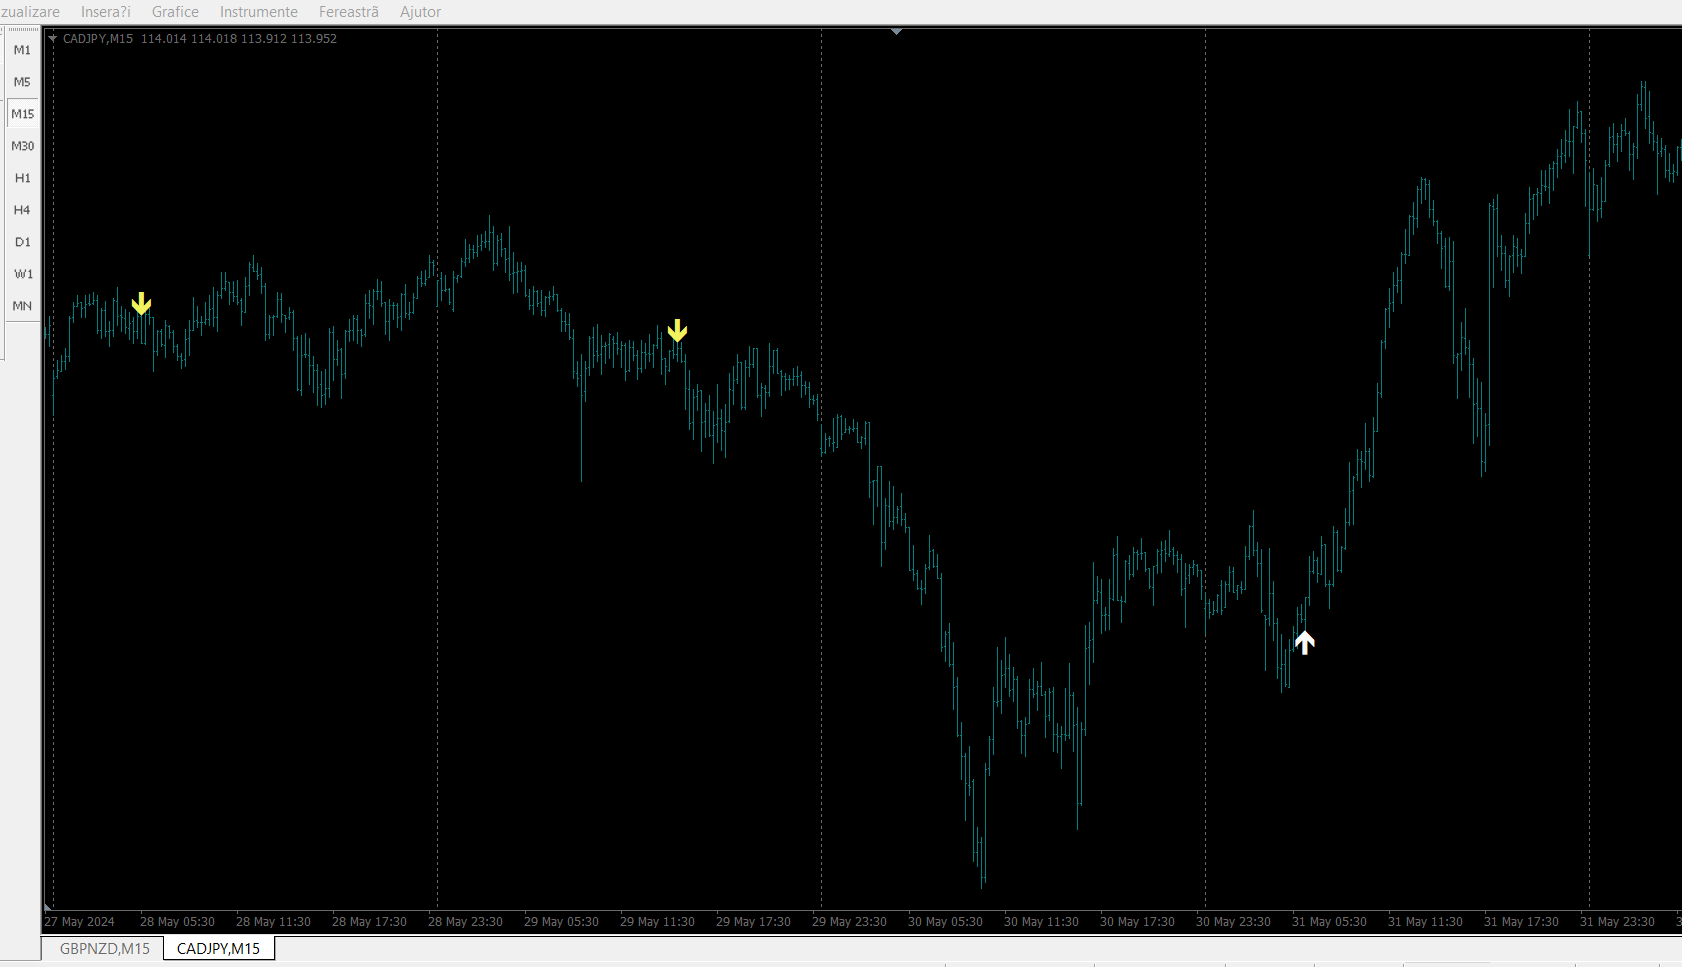
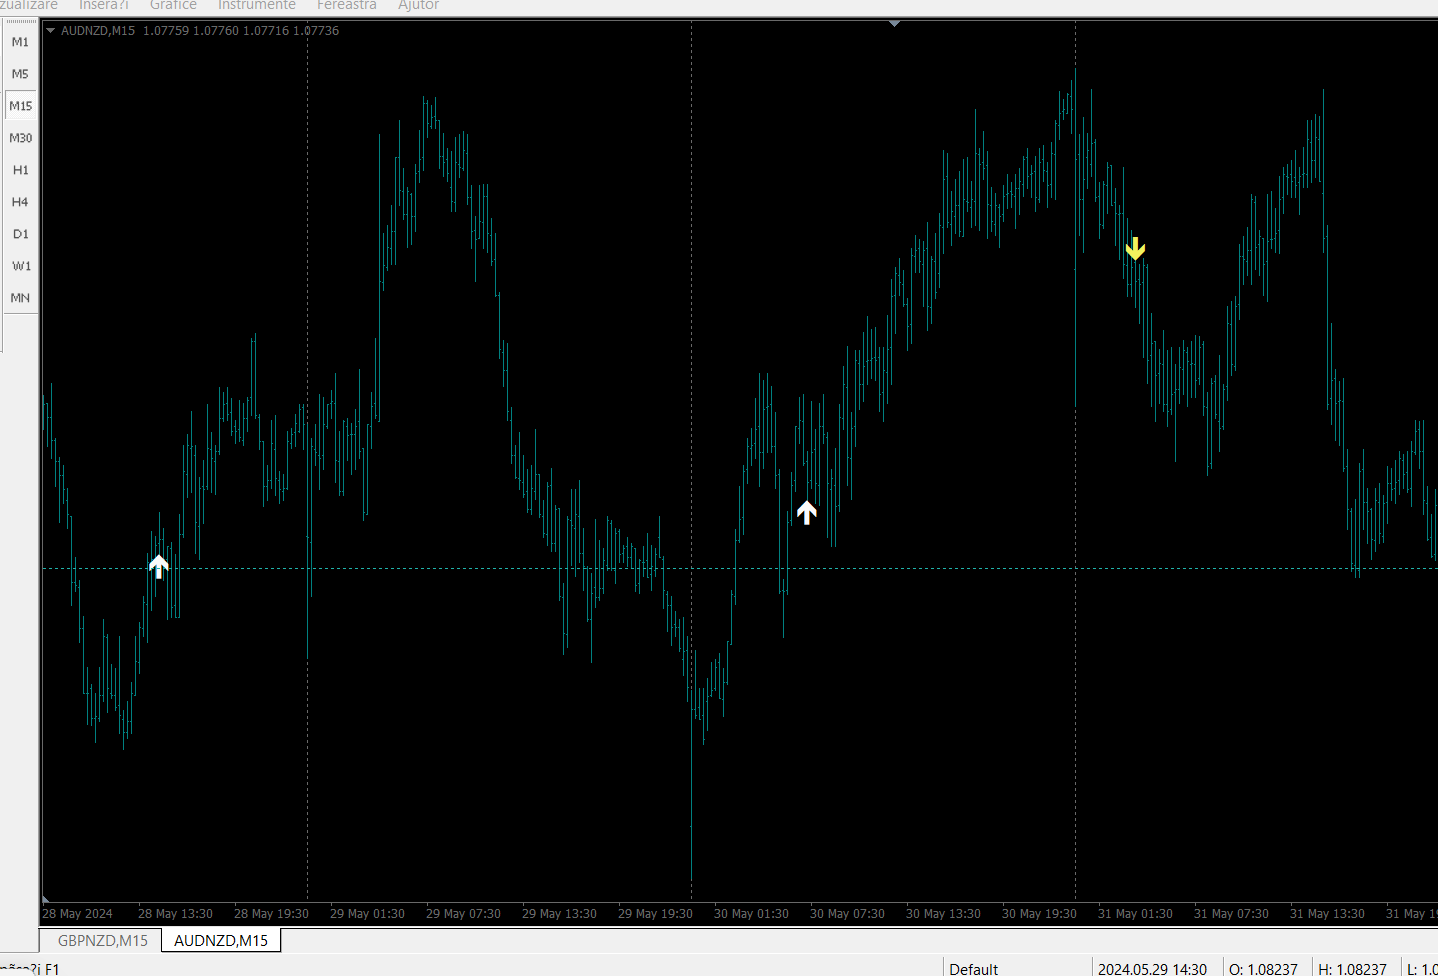
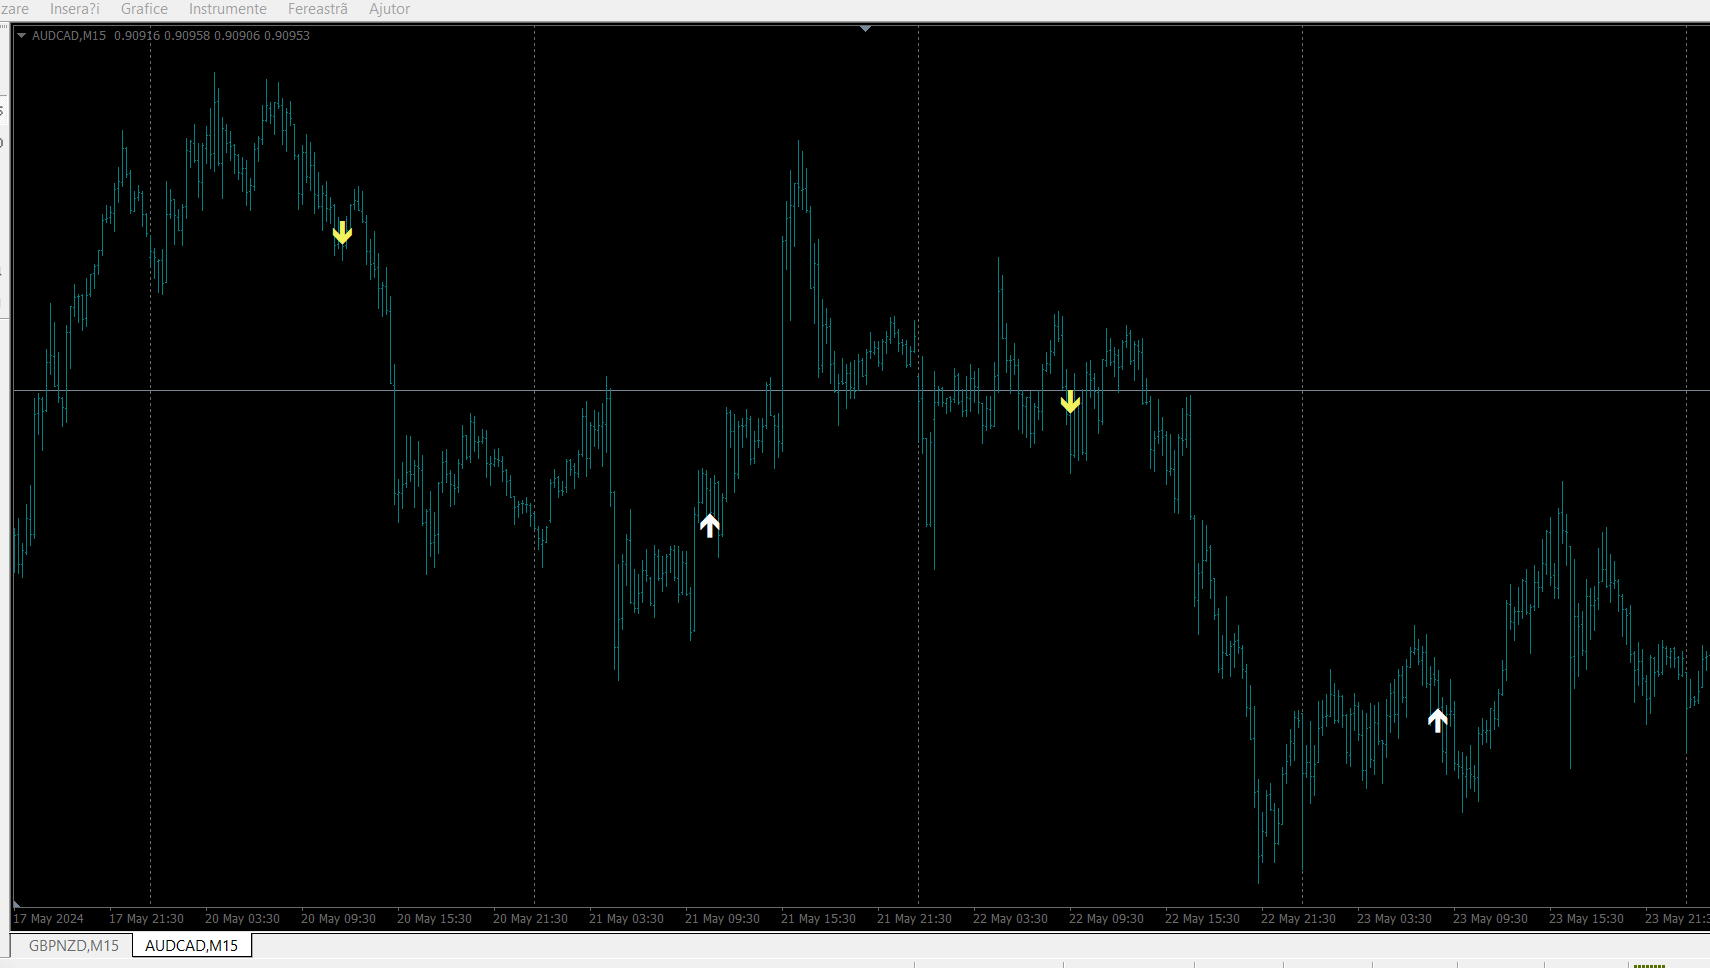
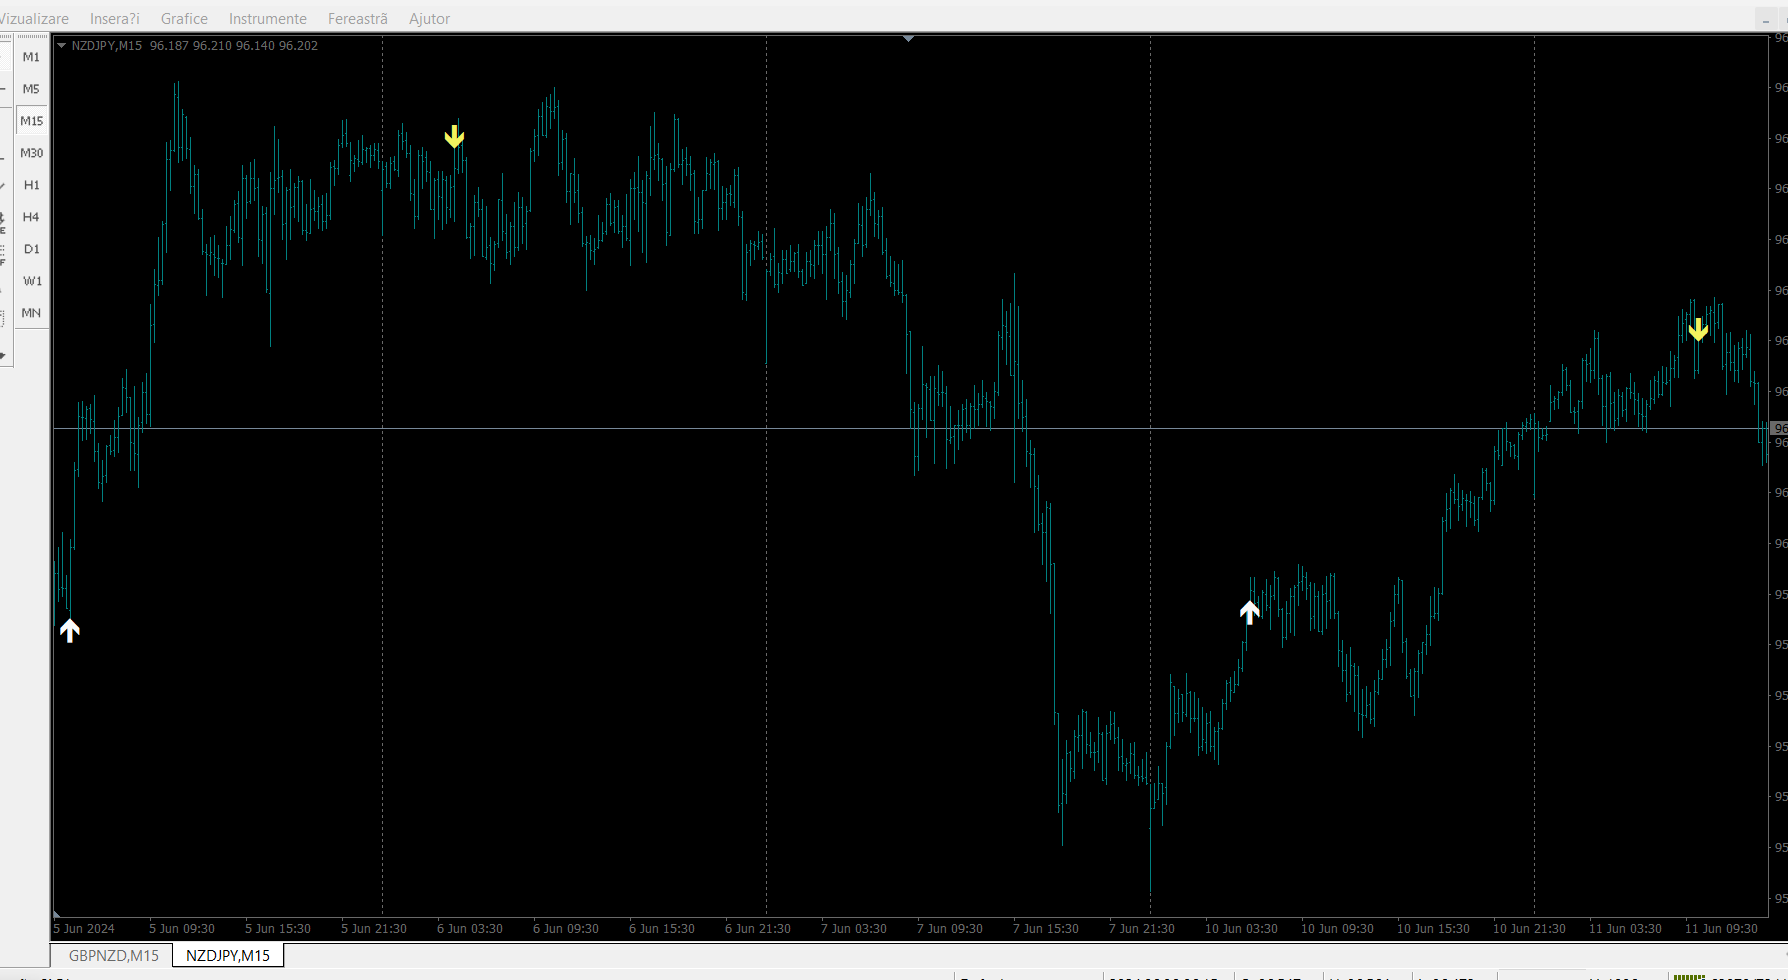
Indicatorul MOTANO
Bună ziua!
24 hours - PRICE REDUCTION! Profita!
Tocmai am terminat indicatorul MOTANO după multă muncă.
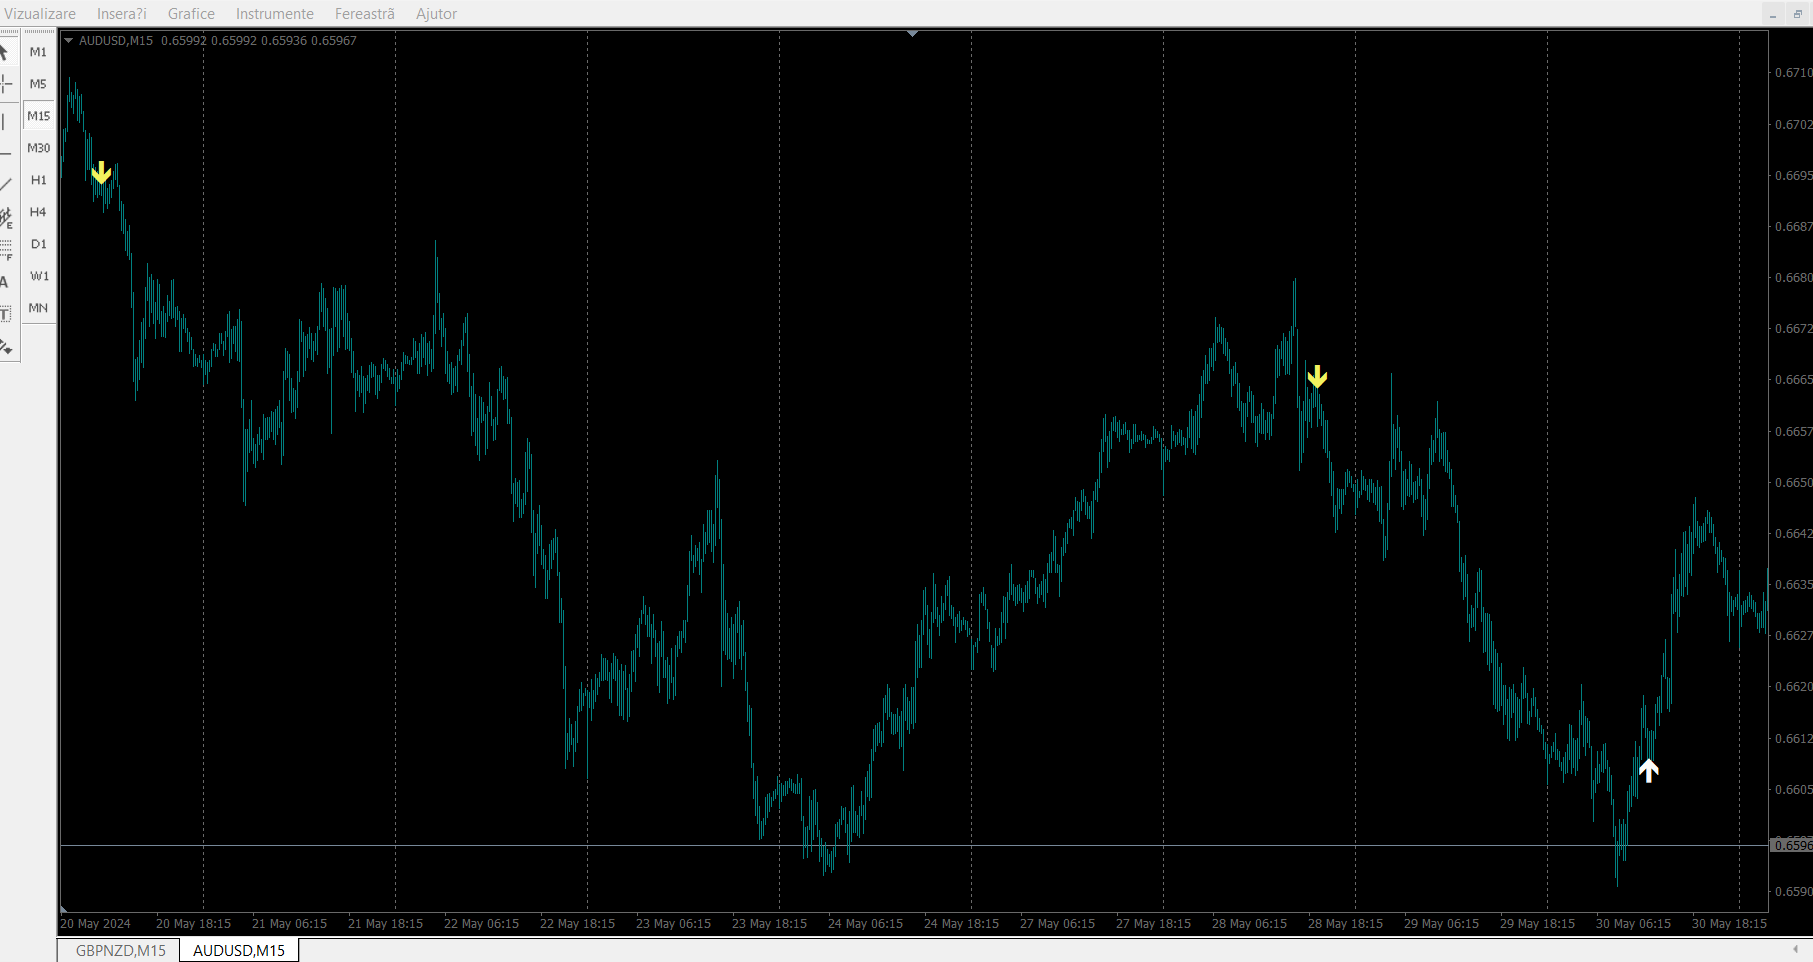
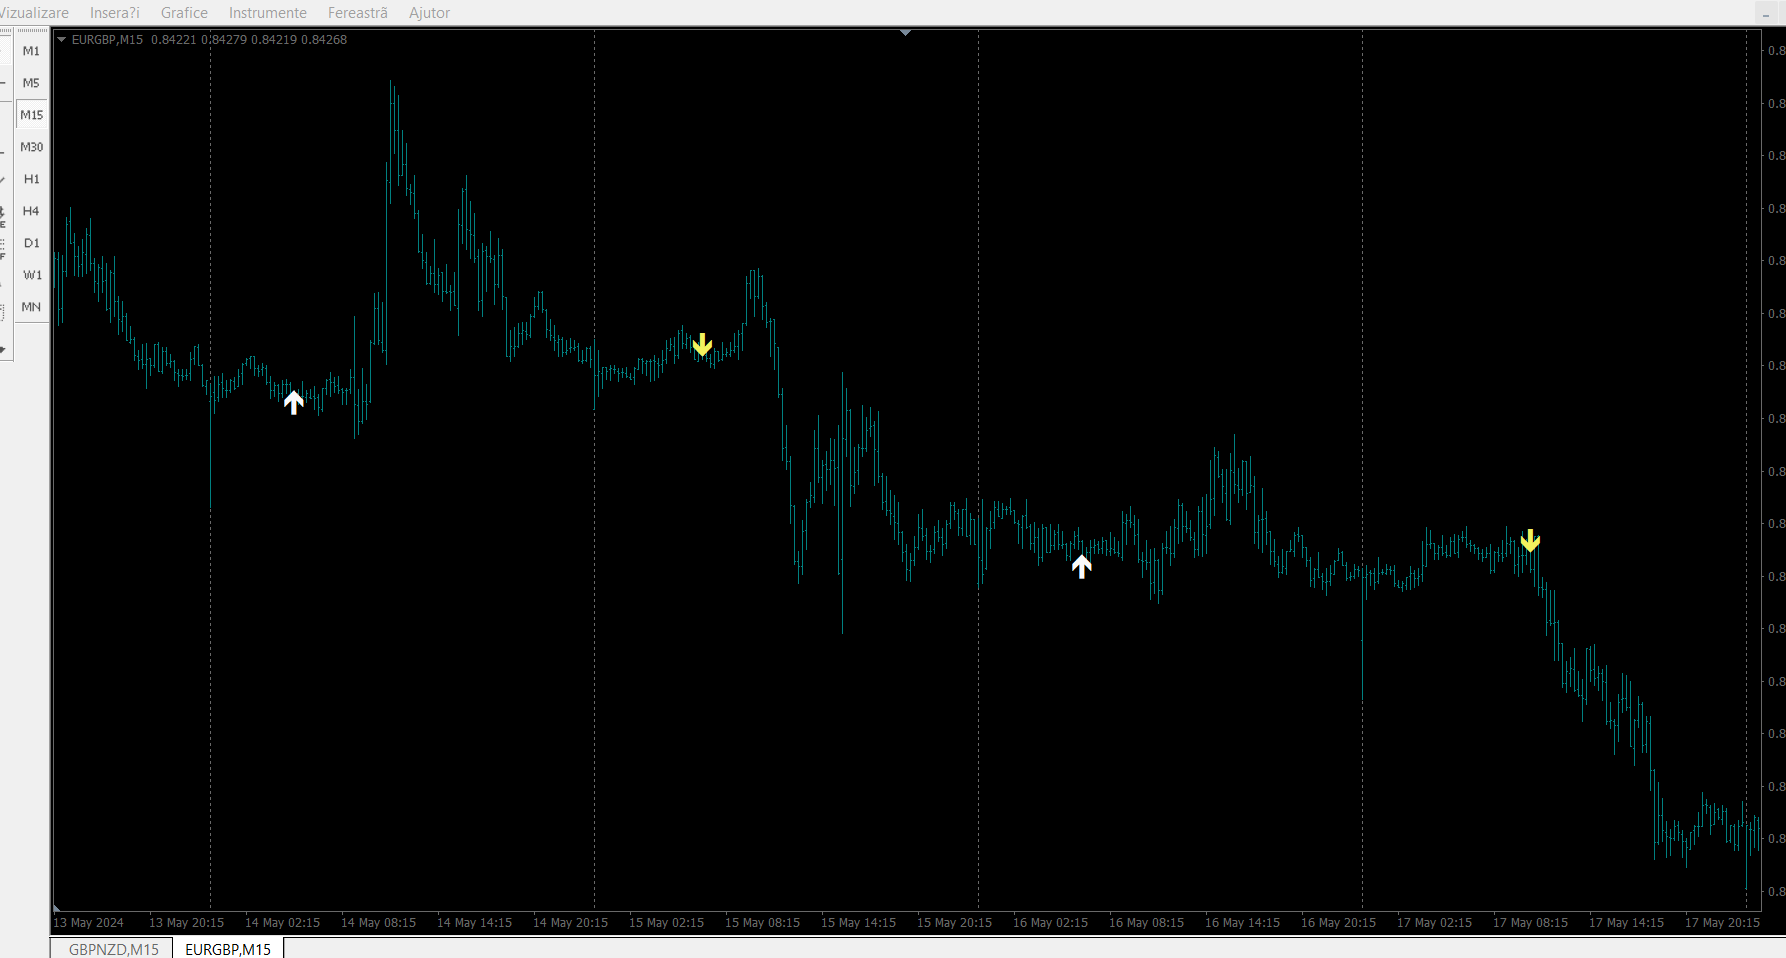
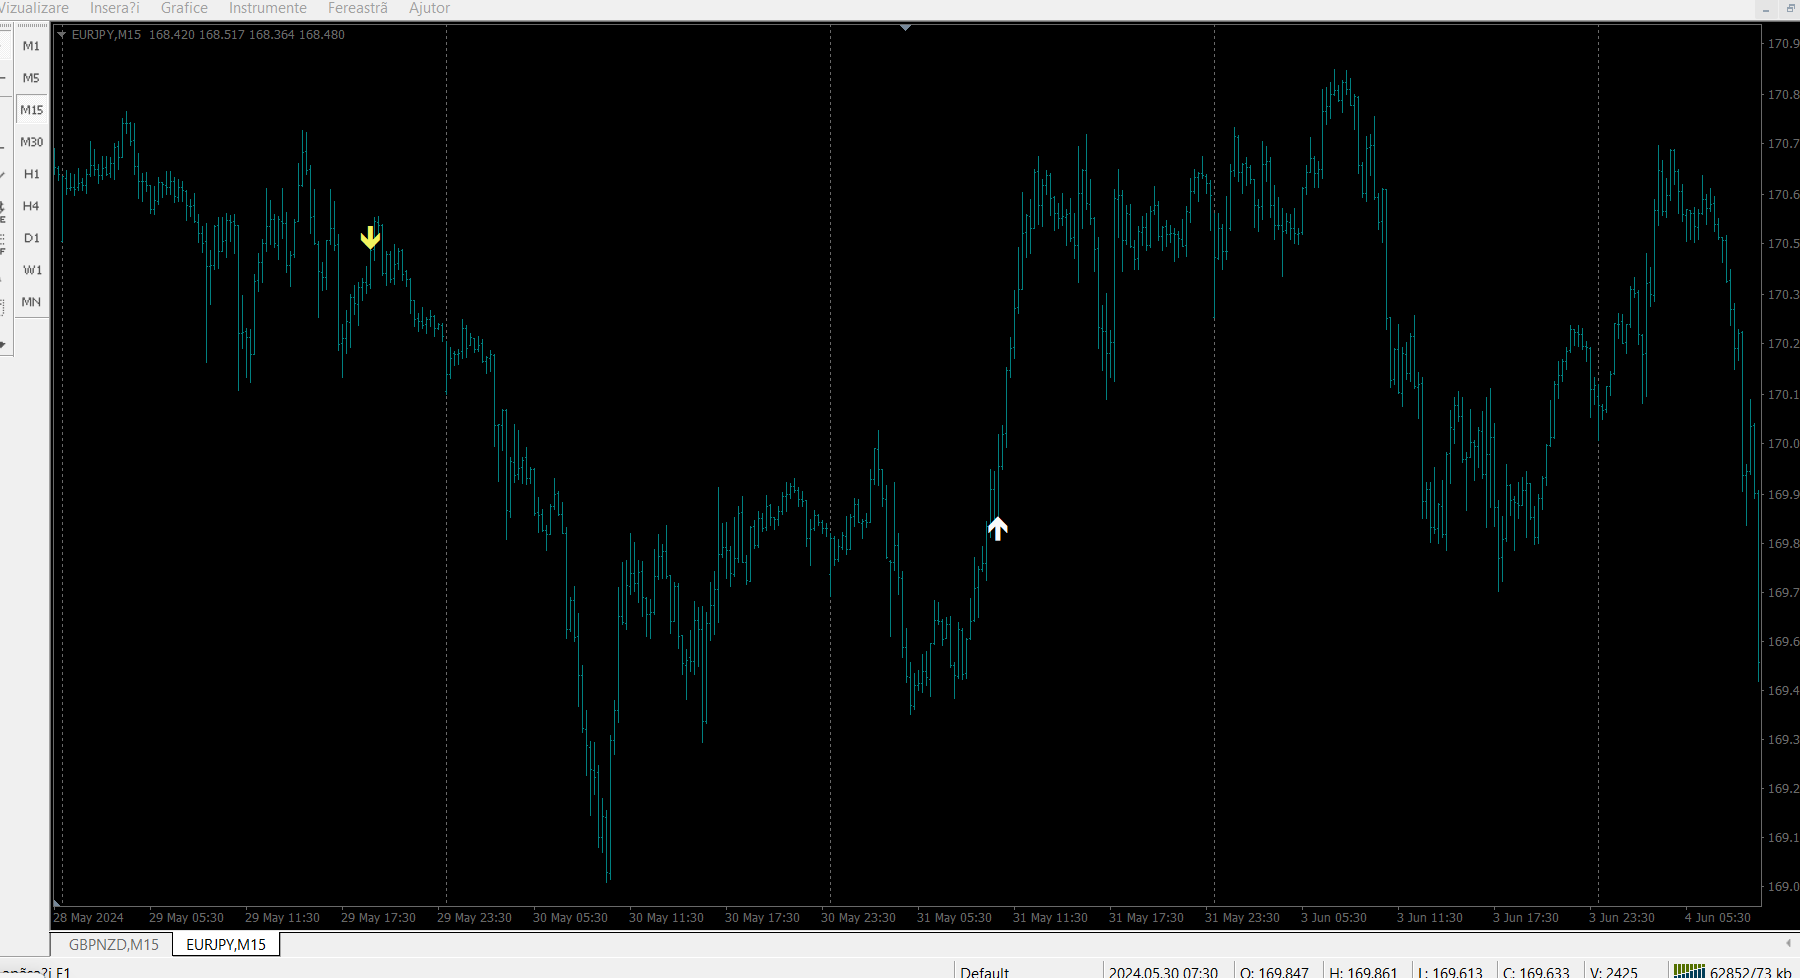
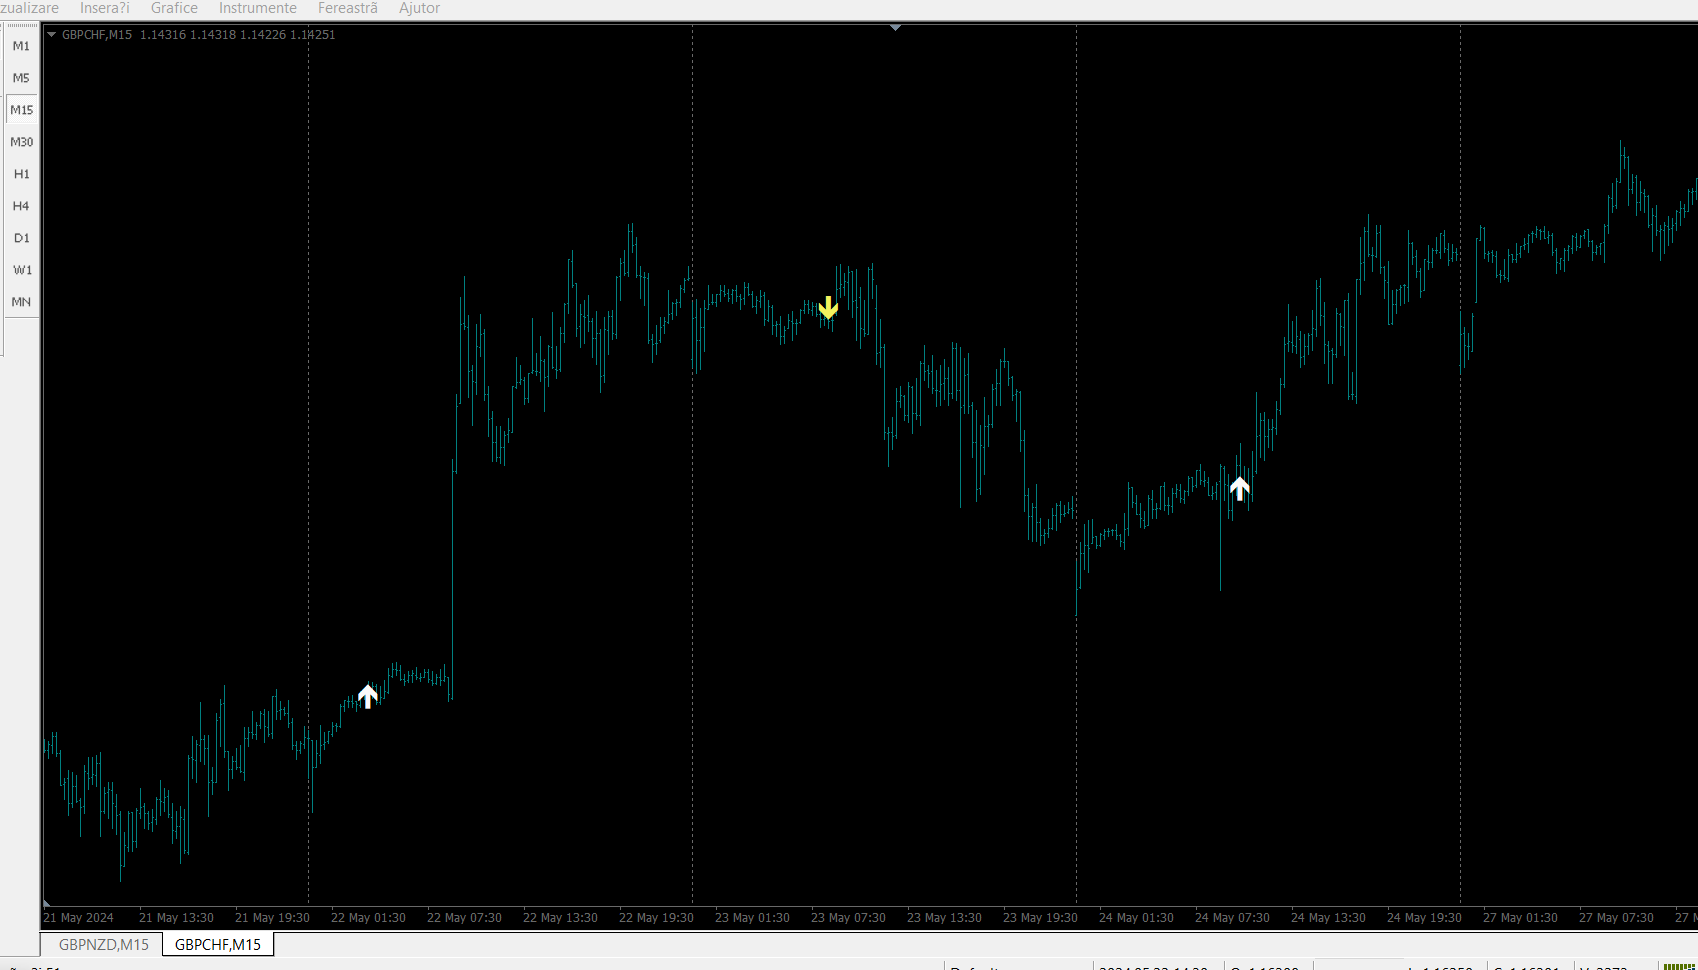
Este un indicator de săgeată.
Merge perfect pe M15, aproape orice pereche.
Săgețile indică intrările de cumpărare și vânzare, iar o țintă de profit de 5,10 sâmburi asigură un profit sigur.
Un profit și mai mare poate fi stabilit, în funcție de situație.
Dar cuvintele sunt de prisos.
Testați-l și trageți propriile concluzii.
Indicatorul MOTANO nu revopseș
BRICS HISTOGRAMĂ Bun venit ! 24 hours - PRICE REDUCTION! Profita!
Cumpăra din bara albă a histogramei. Vindeți la bara galbenă a histogramei. Acest indicator este indicatorul săgeților BRICS transformat într-un indicator histogramă. Pe AUDCHF, GBPUSD, AUDJPY, NZDUSD, USDJPY funcționează foarte bine. Eu recomand – GBPUSD, M15, SL = 0 sâmburi, TP = 10 sâmburi minim. El funcționează în mod constant cu rezultate foarte bune. Alt Perechile pot da semnale mai rare sau pot avea unele pier
Histogramă PERFECTĂ Acest indicator este indicatorul săgeților PERFECT transformat într-un indicator histogramă. Faceți cumpărături la cercul albastru. Vindeți cercului roșu. Acest indicator este de câteva ori mai bun decât BRICS indicator. Și asta este foarte bine. În primul rând pentru că dă semnale mai des. Se poate tranzacționa de mai multe ori pe zi folosind mai multe valute Perechi. În al doilea rând, tranzacțiile sunt, în general, mai lungi. Profitul țintă poate depăși 10 sâmbur
Muon g-2
Bună ziua! Indicatorul Muon g-2 funcționează cel mai bine pe H1, M30 și H4 și pe toate perechile valutare.
Se poate tranzacționa de mai multe ori pe zi folosind mai multe perechi valutare.
Acest indicator pare să depășească indicatorul PERFECT.
Semnalele de cumpărare-vânzare sunt sub formă de săgeți.
Vă doresc succes!
IMPORTANT! Verificați mai întâi indicatorul sau expertul pe un cont DEMO, înainte de a-l cumpăra!
Analizați-l bine! Vorbeste cu vanzatorul! Închiriați-l pen
Indicatorul ANDROMEDA
24 de ore - REDUCERE PREȚ! Profita!
Bun venit!
Indicatorul Andromeda este o creație nouă.
Acest indicator funcționează foarte bine pe H1.
Fiecare semnal asigură un profit cuantificat minim de 5, 10 sâmburi. Pentru profituri mai mari, se folosesc linii de rezistență, benzi TMA, Bollinger etc.
Singura problemă sunt știrile. Remediul pentru aceasta este Stop Loss.
Notă Este posibil ca acești indicatori pe care îi punem în vânzare să nu funcționeze pe anumite p
Lyre Histogram
Greetings!
The Lyre Histogram indicator is created for the M15 and M5 intervals.
Note Este posibil ca acești indicatori pe care îi punem în vânzare să nu funcționeze pe anumite platforme. De câțiva ani, unele platforme cu noi versiuni MT4 nu afișează toți indicatorii personalizați.
O soluție la această problemă este să descărcați acești indicatori pe o altă platformă de la un alt broker sau să reveniți la o versiune mai veche a MT4.
Am avut această problemă cu indicat
Indicatorul Multivers
Bun venit!
Observați rezultatele foarte bune pe M15.
Dar funcționează bine și în celelalte intervale de timp. Trebuie doar să reglați TP, SL, Lot etc.
Noroc!
Notă Este posibil ca acești indicatori pe care îi punem în vânzare să nu funcționeze pe anumite platforme. De câțiva ani, unele platforme cu noi versiuni MT4 nu afișează toți indicatorii personalizați.
O soluție la această problemă este să descărcați acești indicatori pe o altă platformă de la un alt broke
Indicatorul Delphinus
24 hours - PRICE REDUCTION! Profita! Bun venit!
Studiați și experimentați indicatorul Delphinus!
Observați rezultatele foarte bune prezentate în imagini. Funcționează pe toate intervalele de timp și pe toate perechile, cu diferențe de rigoare. Succes!
Notă Este posibil ca acești indicatori și experți pe care i-am scos la vânzare să nu funcționeze pe anumite platforme. De câțiva ani, unele platforme cu noi versiuni MT4 nu afișează toți indicatorii personalizați.
O