Fair Value
- インディケータ
- Ivan Stefanov
- バージョン: 1.1
- アップデート済み: 6 6月 2024
- アクティベーション: 10
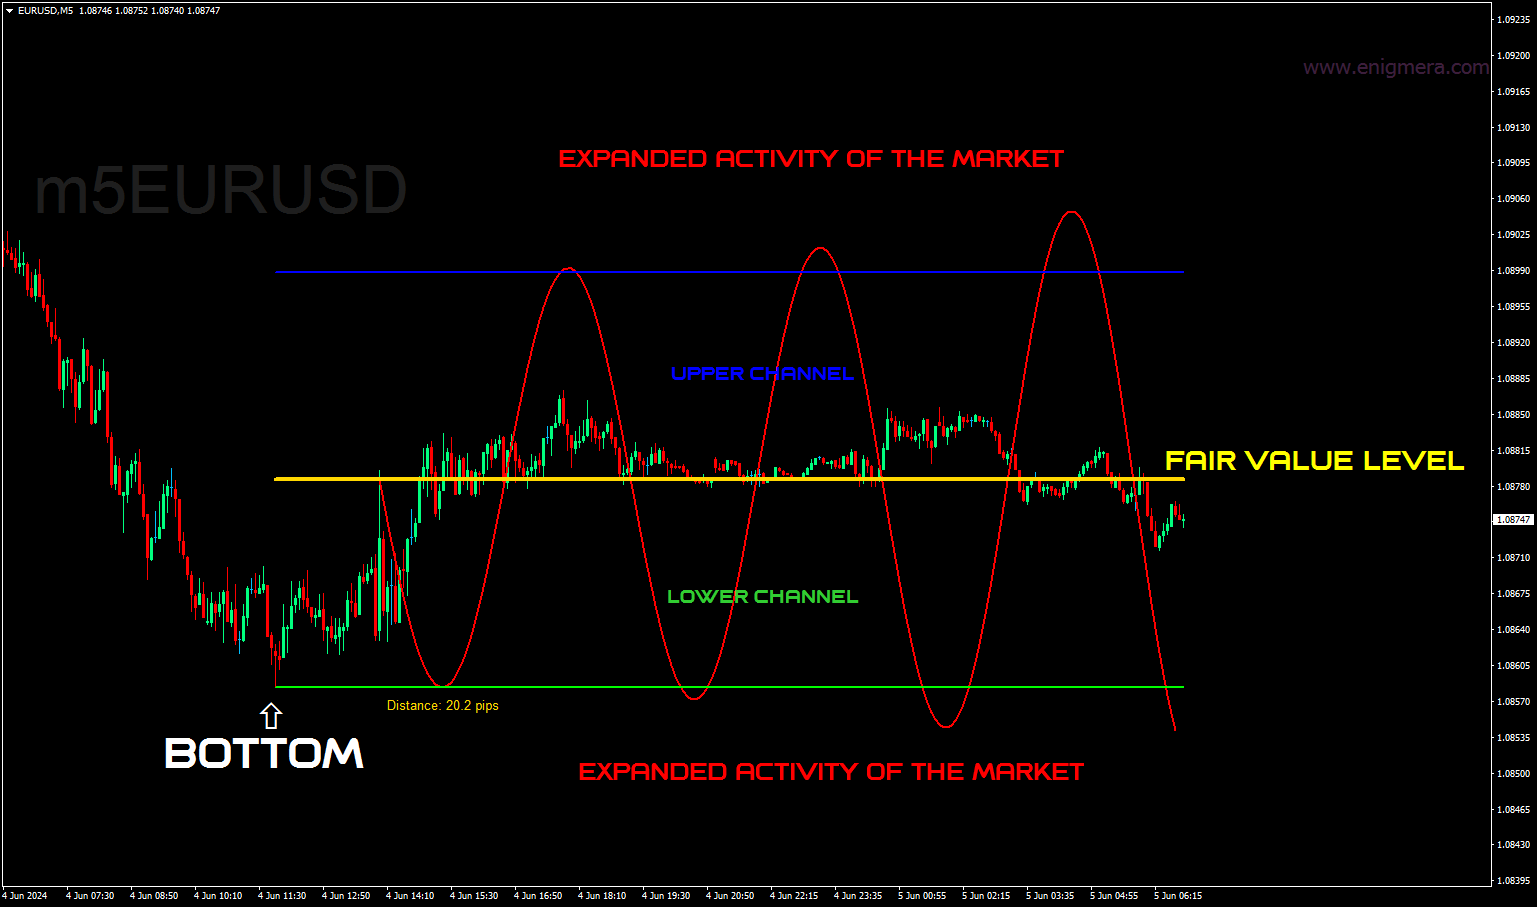
市場が重要な天井または底をつけた後、それは修正に入り、公正な価値を見つける。
インジケータは自動的に計算します:
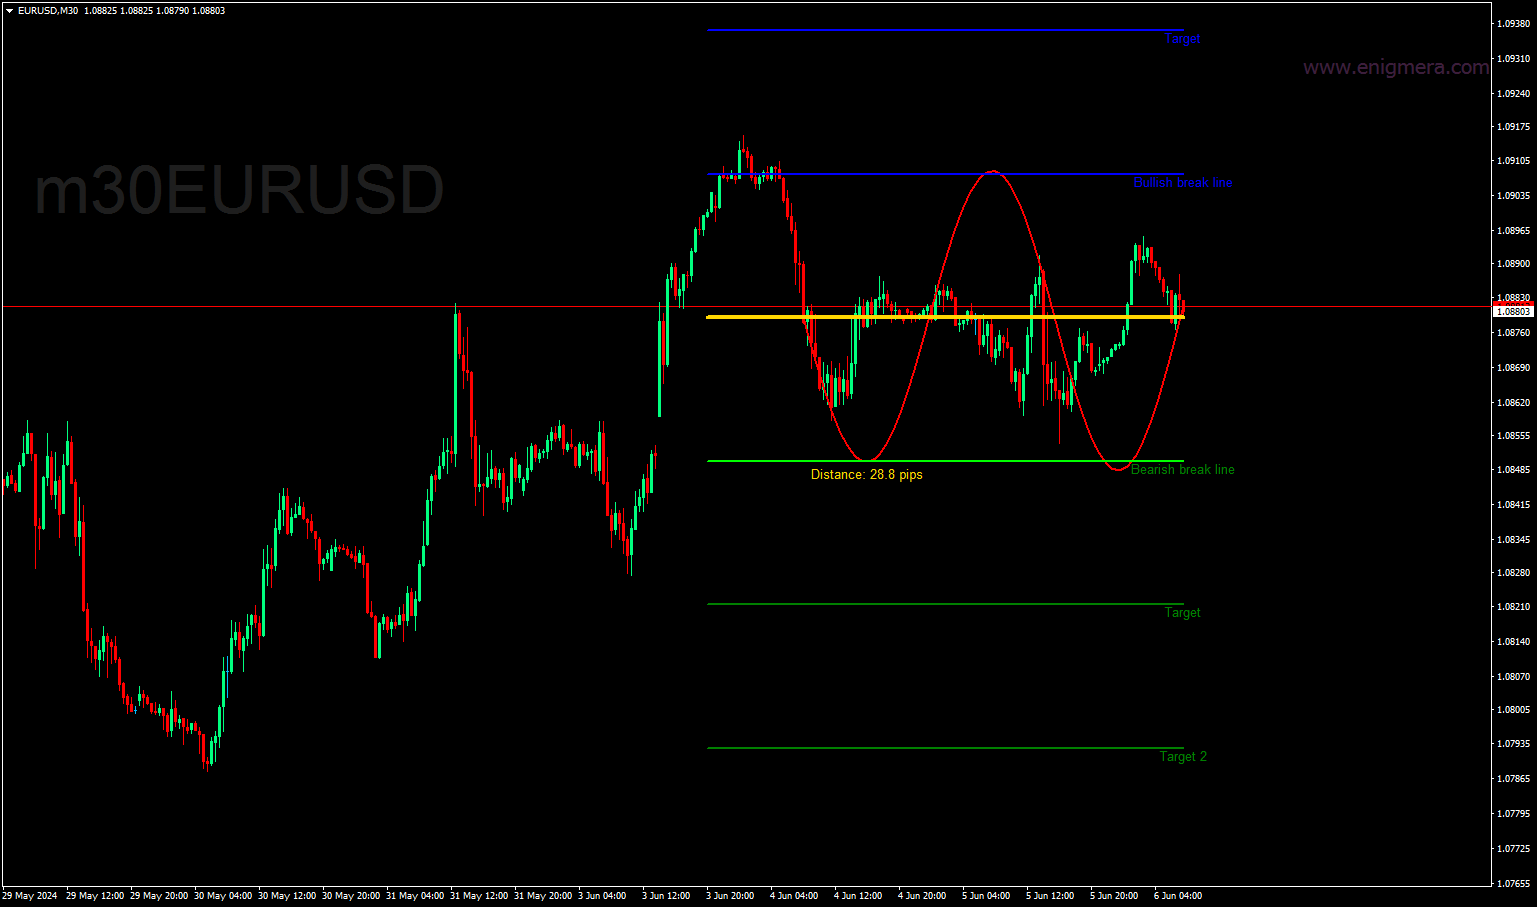
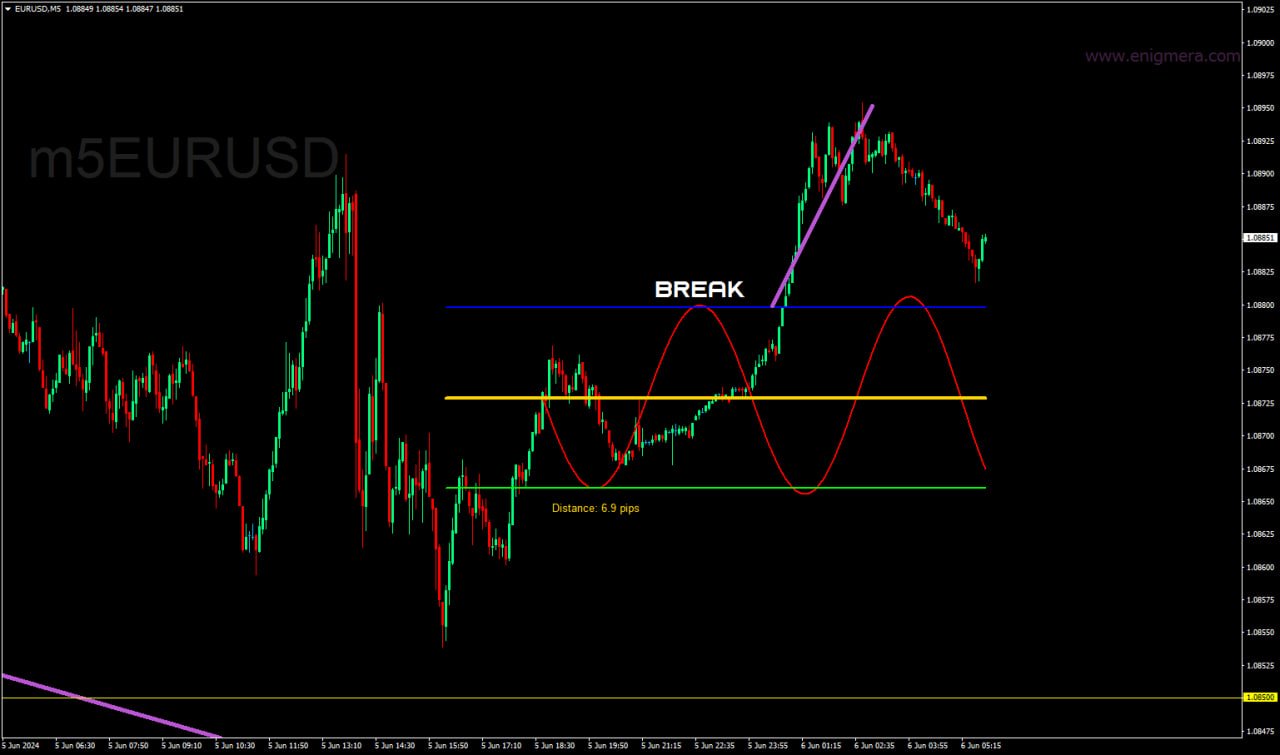
公正価値レベル
修正チャネル
フェアバリューから修正チャネルの境界までのpips単位での距離。
正弦波 最初の公正価値レベルのローソク足から始まり、時間とともに拡大する正弦波 は、ブレイクアウト前に予想される調整拡大の最大レベルを示します。
正弦波がブレイクすると方向転換。ブ レ ー ク ア ウ ト が な い 場 合 、こ れ は サ ポ ー ト / レ ジ ス タ ン ス と 見 な す こ と が で き ま す 。インジケータには、調整前の高値または安値の日時を入力する必要があります。また、直近120本のローソク足を自動的に追跡するオプションもあります。この数値は自由に変更できます。正弦を変更するオプションもあります:
ステップ
拡張
ポイント
サイズ
タイムシフト
勾配
このインディケータはタイムフレームに依存しないと考えることができます。
直感的でありながらユーザー依存
このインディケータの有効性は、正しいユーザー設定に依存しています。不正確な設定は、分析の精度に影響を与えます。このインジケータのパフォーマンスを最大化するには、市場の調整局面を十分に理解することが不可欠です。この理解が効果的な行動につながる。
魅力的なプロツール。