Async Charts MT5
- インディケータ
- Ismail Hakki Delibas
- バージョン: 1.0
- アクティベーション: 10
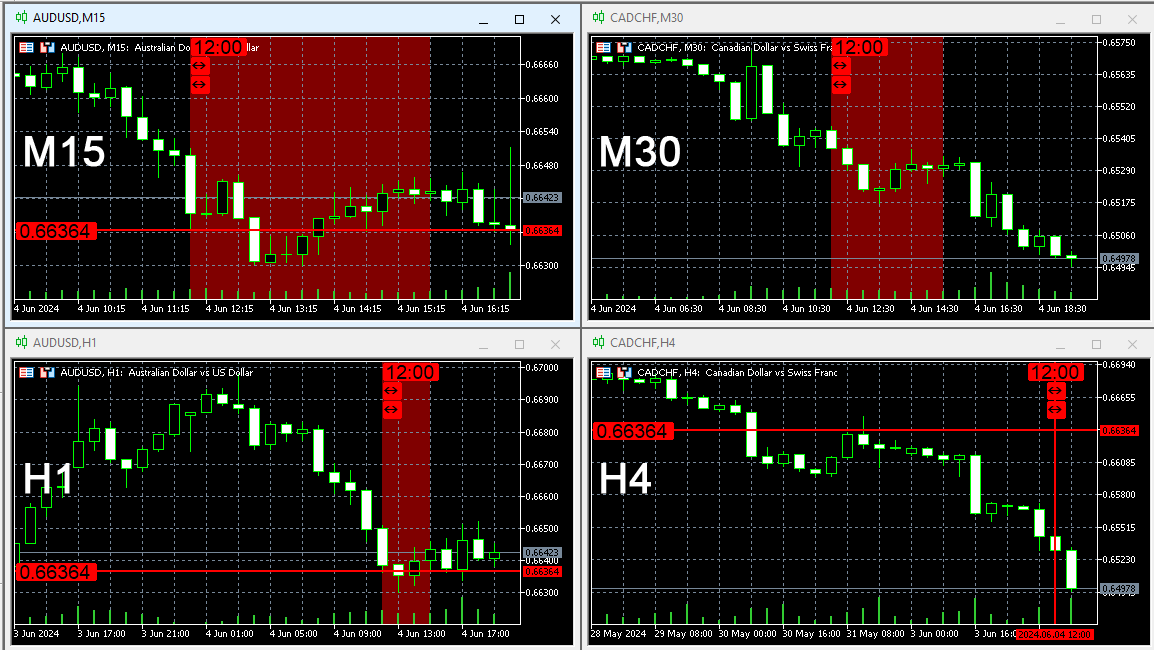
Async Charts is an indicator to synchronize charts and display a customized crosshair (cursor) on all selected charts. This is a useful utility for traders using multiple timeframes of analyzing multiple symbols for trade entry or exit.
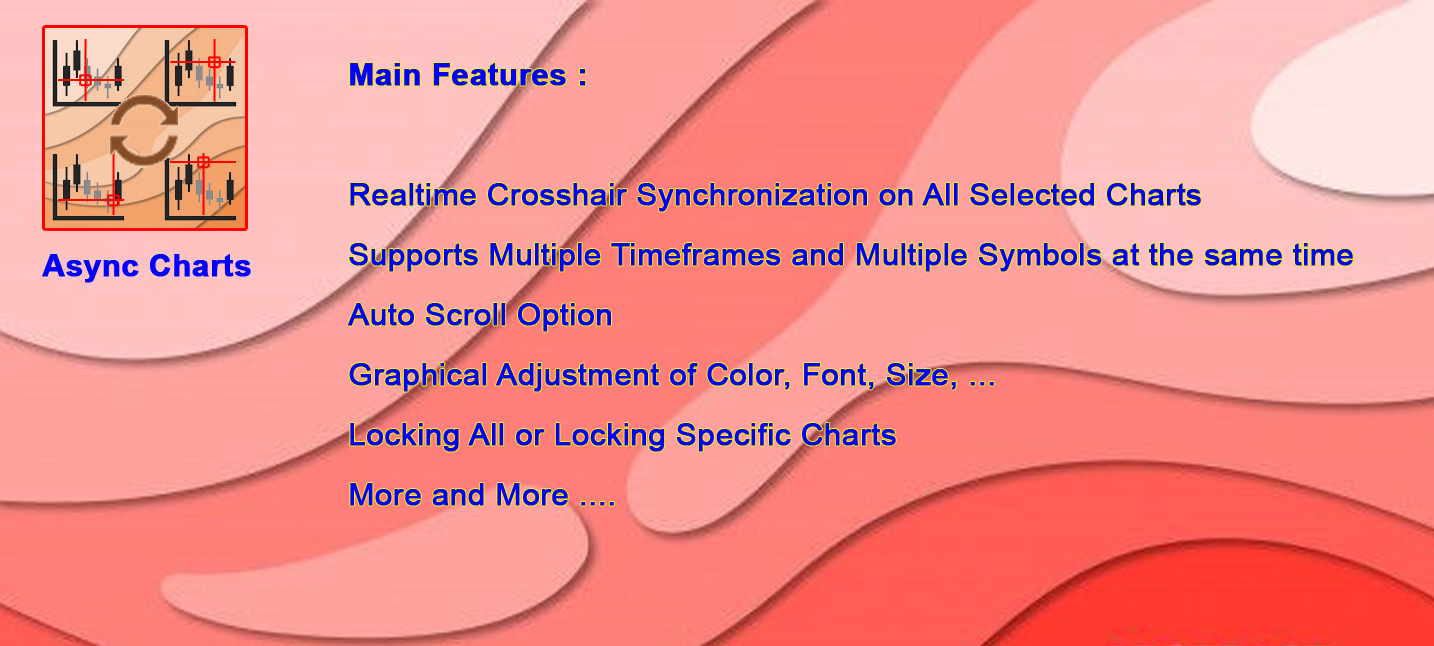
Main Features :
Real time Crosshair Synchronization on All Selected Charts
Supports Multiple Timeframes and Multiple Symbols at the same time
Auto Scroll Option
Graphical Adjustment of Color, Font, Size, ...
Locking All or Locking Specific Charts
More and More ....
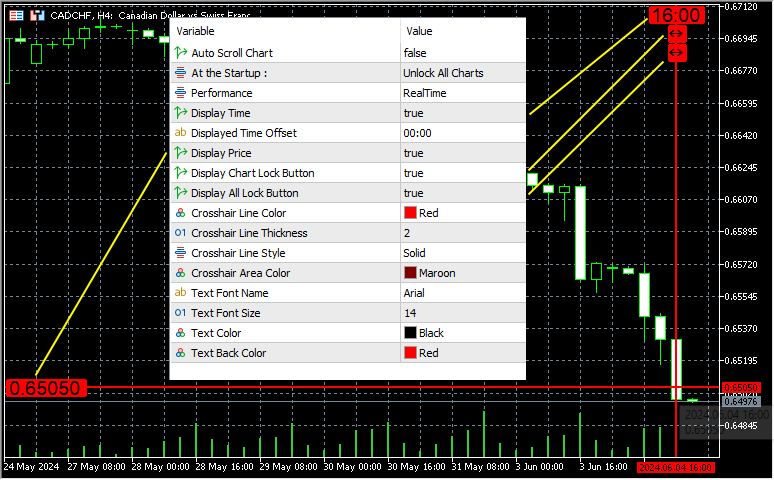
Input parameters :
- Auto Scroll Chart : Automatically scrolls chart to retain the crosshair at the center of chart
- At the Startup : You can select to unlock crosshair at the indicator startup
- Performance : Real time of Light Weight options are available. This can affect the speed of crosshair updating.
- Display Time : Show time of crosshair at the top
- Displayed Time Offset : You can apply a time offset to match the displayed time with your desired time zone.
- Display Price : Show price of crosshair at the left
- Display Chart Lock Button : Display Lock/Unlock button on the crosshair.
- Display All Lock Button : Display Lock/Unlock All Charts button on the crosshair.
- Crosshair Line Color : Color of crosshair
- Crosshair Line Thickness : Thickness of crosshair
- Crosshair Line Style : Style of crosshair
- Crosshair Area Color : If synchronized crosshair of a higher timeframe, the crosshair will be displayed as a filled area. You can adjust the color here.
- Text Font Name : Font name of displayed time/price/buttons on chart
- Text Font Size : Font size of displayed time/price/buttons on chart
- Text Color : Color of displayed time/price/buttons on chart
- Text Back Color : Background color of displayed time/price/buttons on chart
Using the indicator :
Using this indicator is so simple. It is just a Plug-n-Play. But if any questions or any help needed you are welcome to contact me on the comments page of this product or on PV messaging.
It works as promised !