Cycle Extraction
- インディケータ
- Manuel Espinosa
- バージョン: 1.0
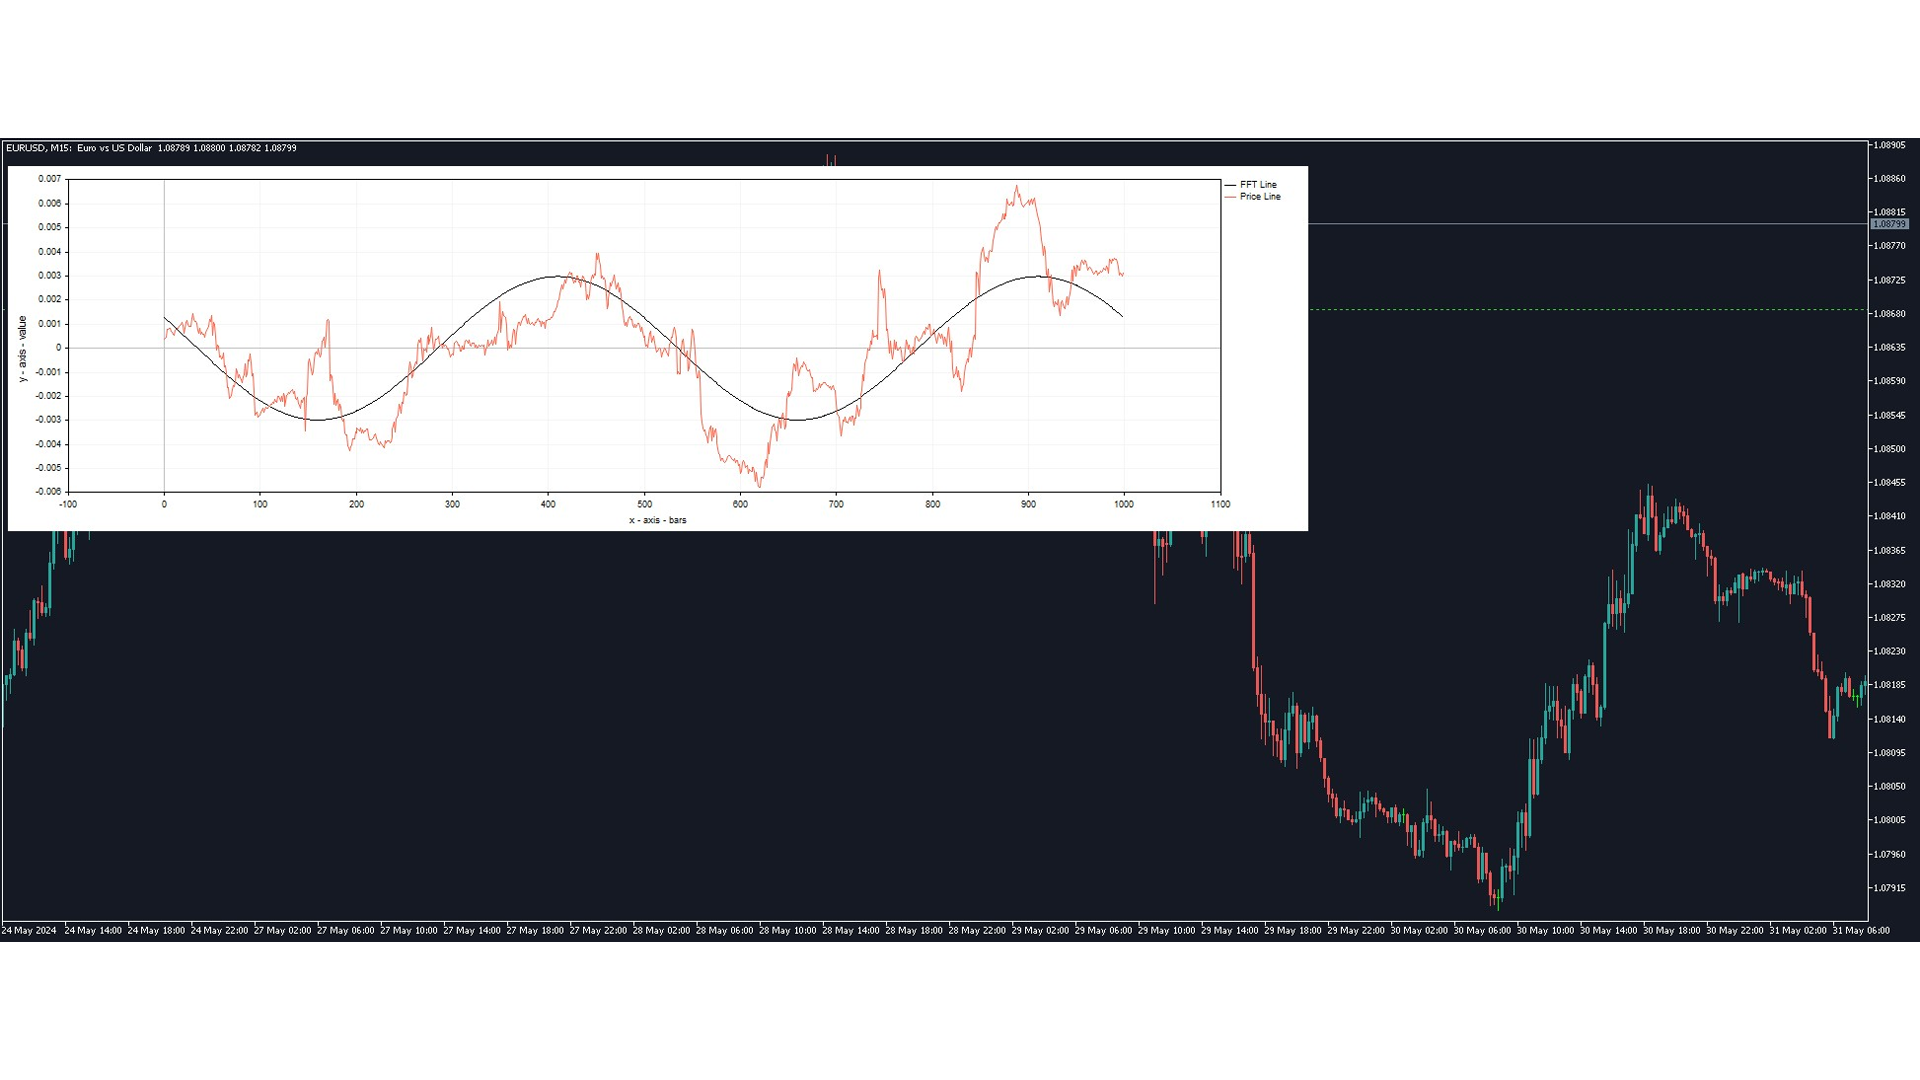
The "Cycle Extraction" indicator for MetaTrader 5 uses the Fast Fourier Transform (FFT) to discern cycles in financial time series. It facilitates the configuration of parameters such as the maximum number of bars, moving average settings, and specification of frequency thresholds, optimizing the analysis of repetitive market phenomena.
Instructions
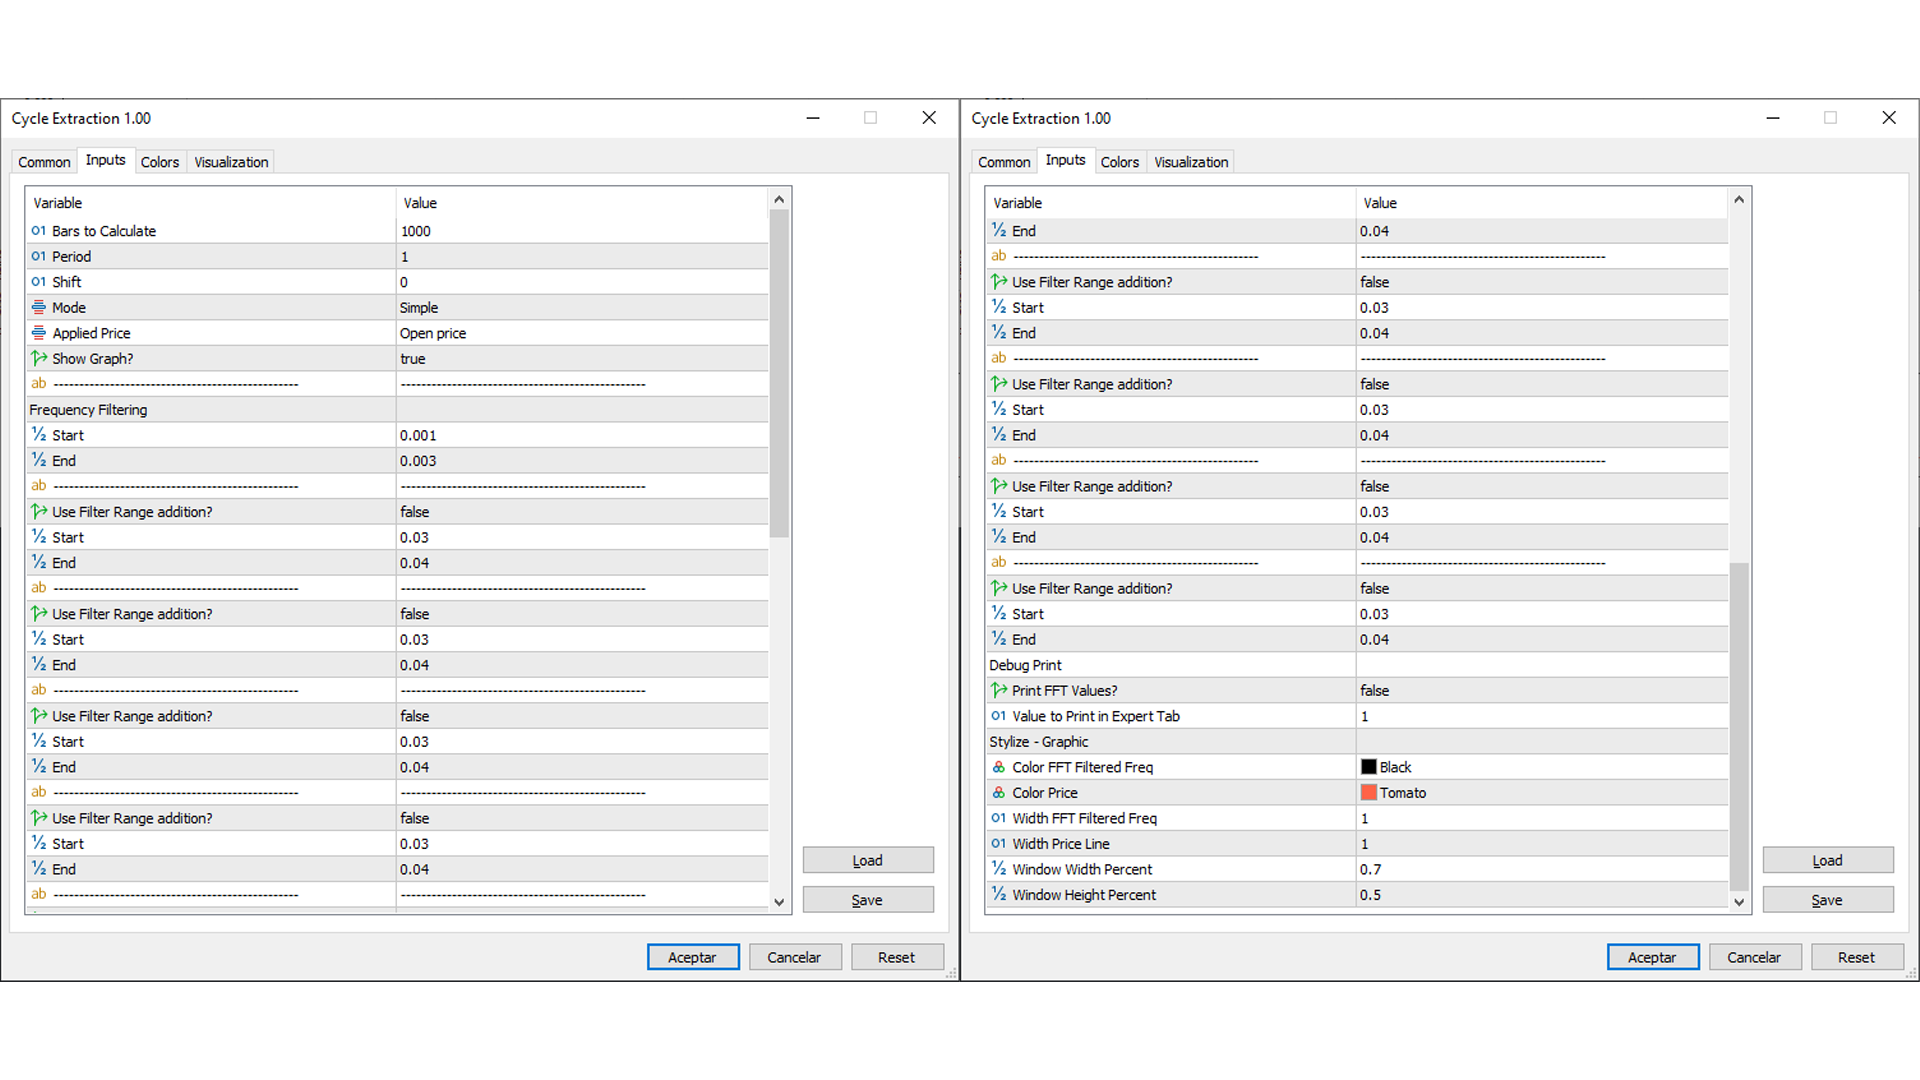
- Input Settings: Adjust variables such as Bar Count, Period, Method, and Applied to Price to customize the analysis to the user's needs.
- Data Visualization: Activate ShowGraph to generate graphical representations of identified cycles, enhancing visual interpretation directly on the trading platform.
- Performance Evaluation: Analyze processed data to inform strategic trading decisions based on market cycles.
Details
-
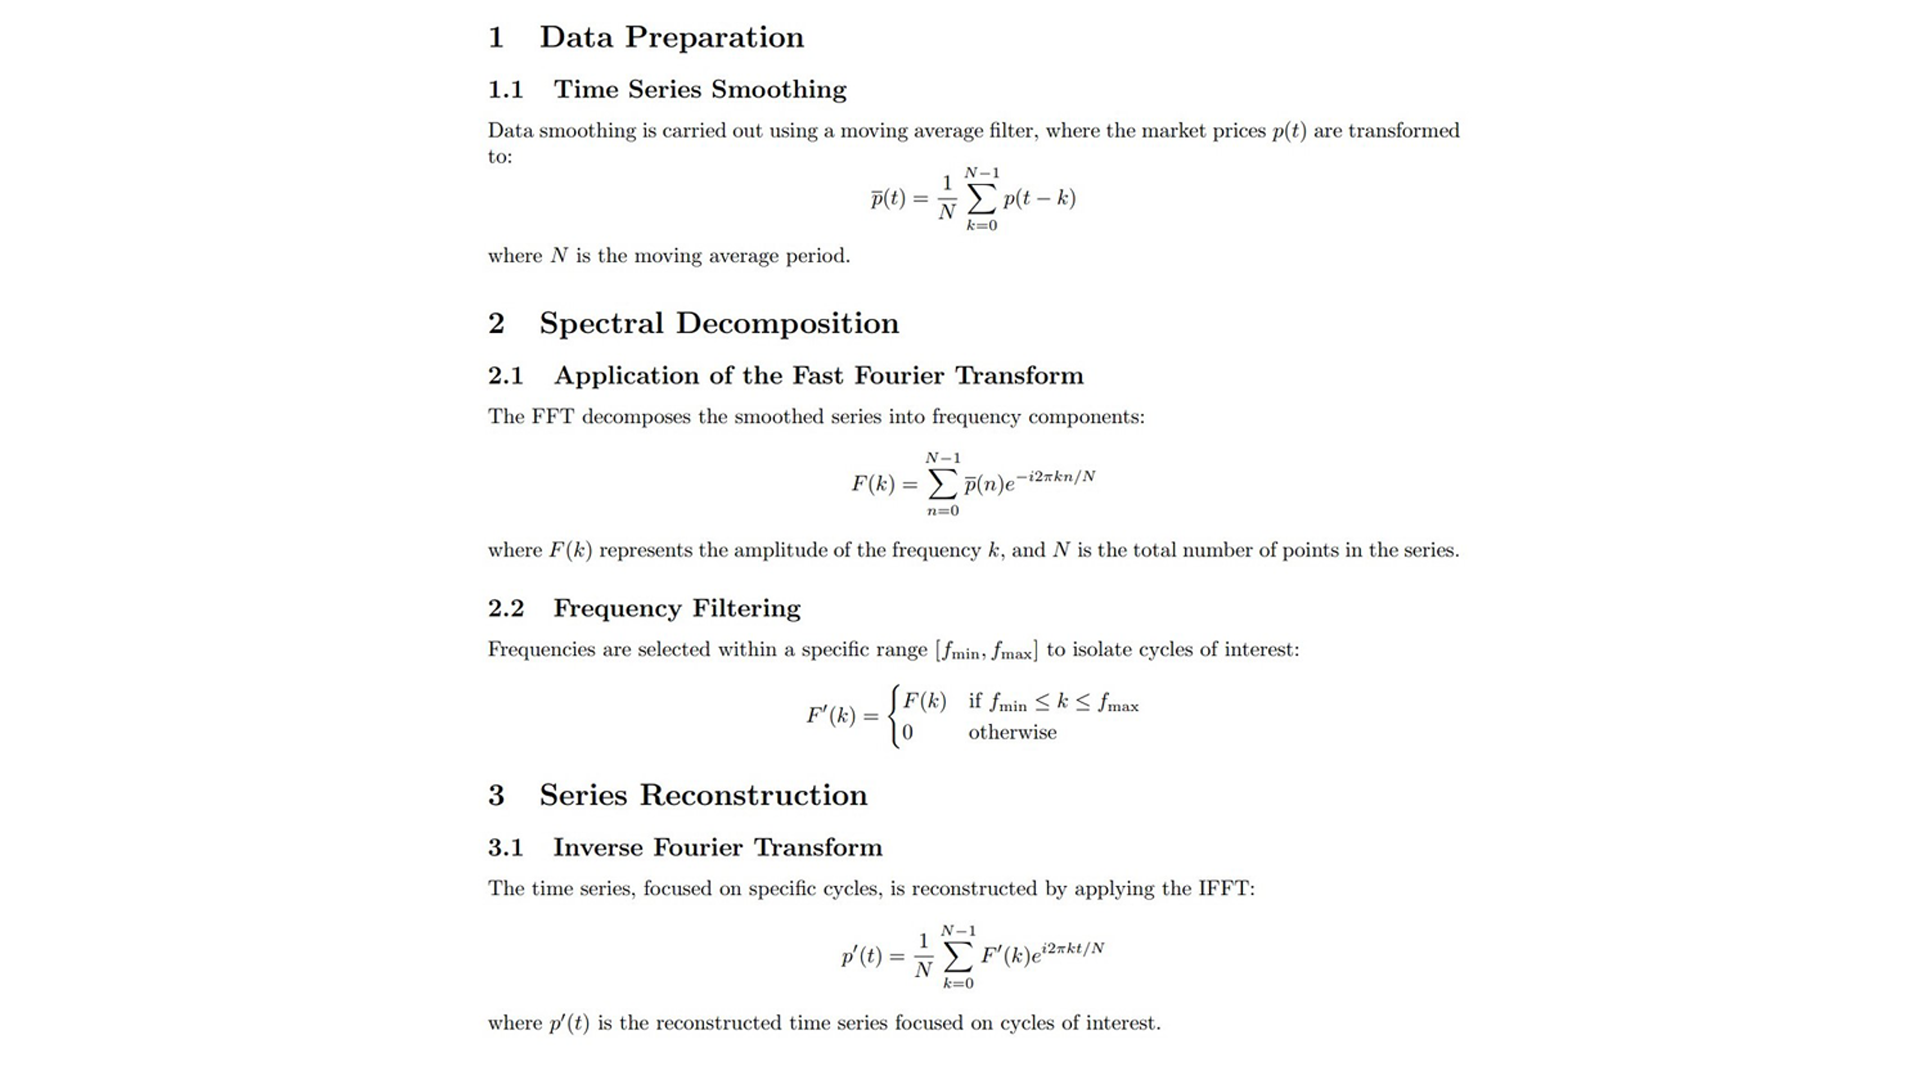
Data Preparation:
- Signal Smoothing: Reducing variability using moving average to refine FFT entry.
- Frequency Selection: Setting thresholds to focus the analysis on specific cycles.
-
Spectral Analysis:
- FFT Application: Transformation of the filtered time series to extract its main frequency components.
- Frequency Filtering: Isolation of cyclic components based on predetermined thresholds.
-
Data Reconstruction:
- Implementation of IFFT: Reconstruction of the time series, focusing on selected cycles.
- Export for Automation: Integration of data buffers with automated trading systems, allowing the automation of trades based on detected cyclical patterns.


good work