Fractals Dynamic
- インディケータ
- Ivan Butko
- バージョン: 1.0
Fractals Dynamic
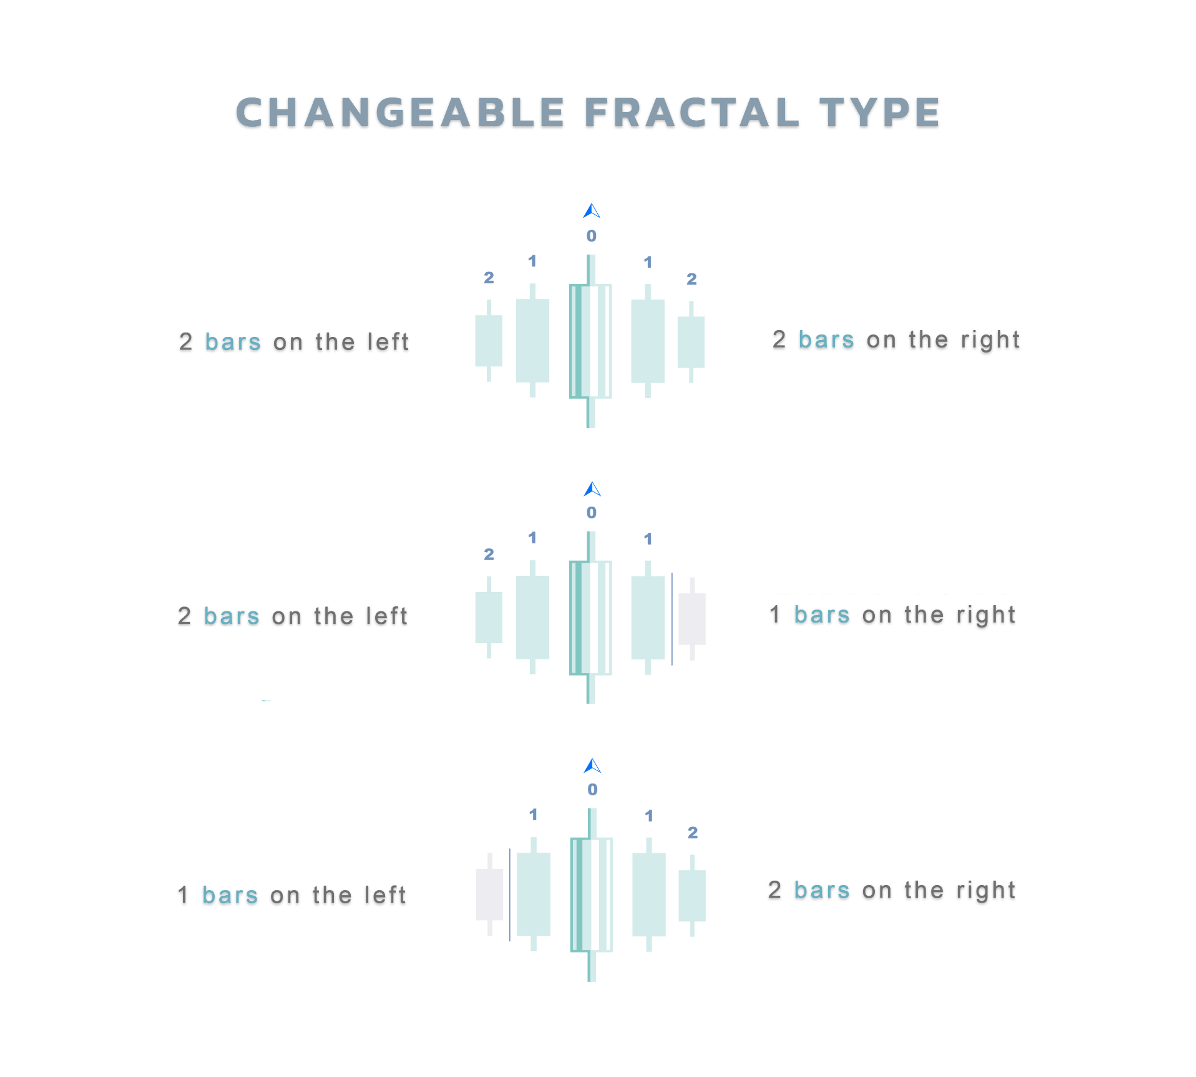
Fractals Dynamic – これで、フラクタルダイナミックインジケーターに基づく、またはそれに基づくすべての取引戦略に追加のシグナルが表示されます。
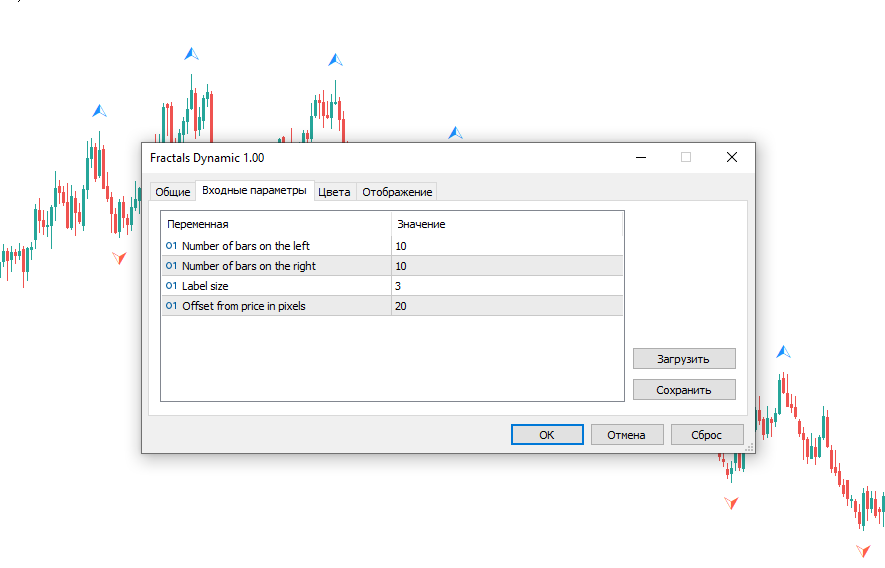
さらに、フラクタルはサポートレベルと抵抗レベルとして機能することができます。 そして、いくつかの取引戦略では、流動性レベルを示しています。 この目的のために、このバージョンのマルチフラクタルおよびマルチフレームインジケータMultiFractal Levelsでレベルが導入されました。 あなたは、この指標は、より有益な視覚的かつ任意の価格チャート上のあなたの取引のアシスタントとして有用であることがわかります。
あなたの取引システムへの追加として Fractals Dynamic 指標を使用してください
また、市場で私の他の製品を試してみてくださいhttps://www.mql5.com/ru/users/capitalplus/seller
取引であなたのための大きな利益!
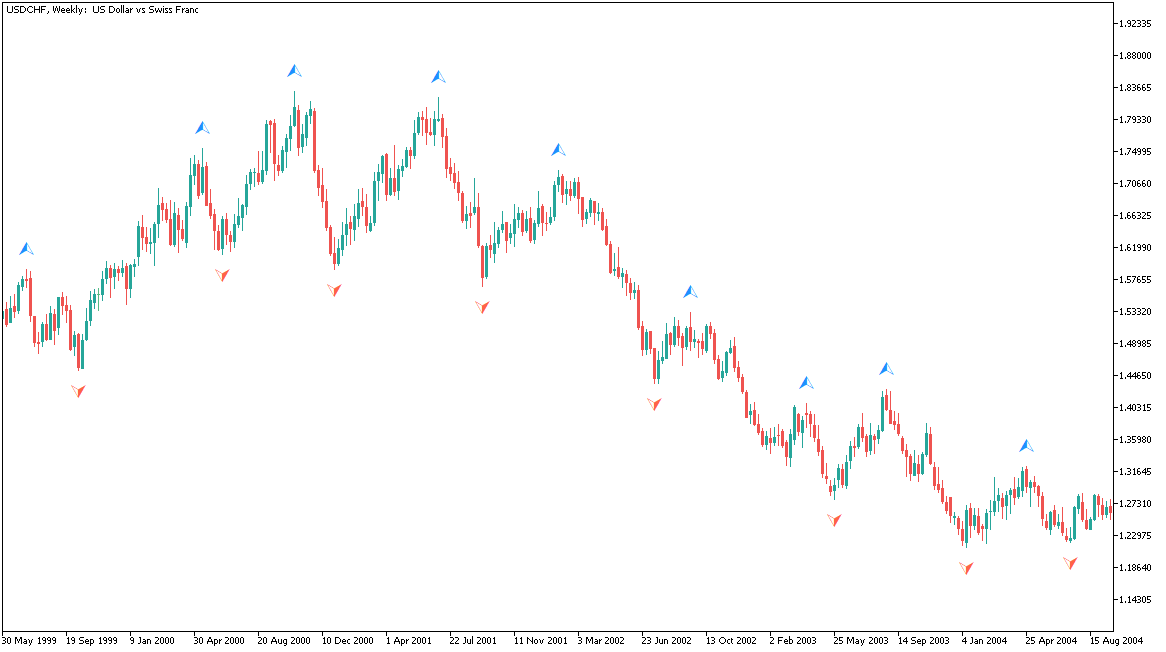


Nice way to see the fractals.