Levelss
- インディケータ
- Ivan Stefanov
- バージョン: 1.1
- アップデート済み: 11 6月 2024
- アクティベーション: 10
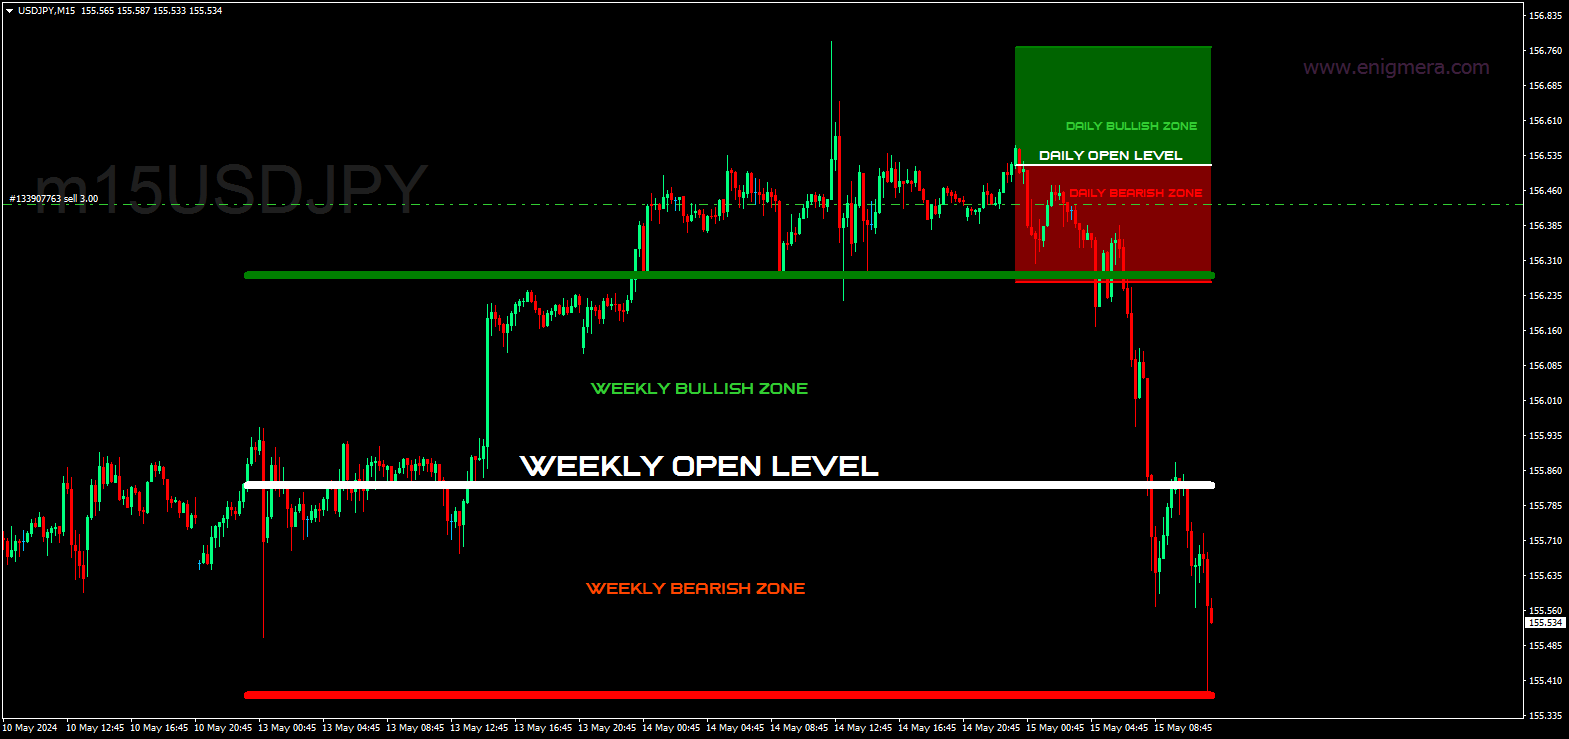
LEVELSSインディケータが示す:
- 日足の強気ゾーンと弱気ゾーン。毎日00:00から23:59まで表示。
- 週足の強気・弱気ゾーン。毎週月曜日0:00から金曜日23:59まで表示されます。
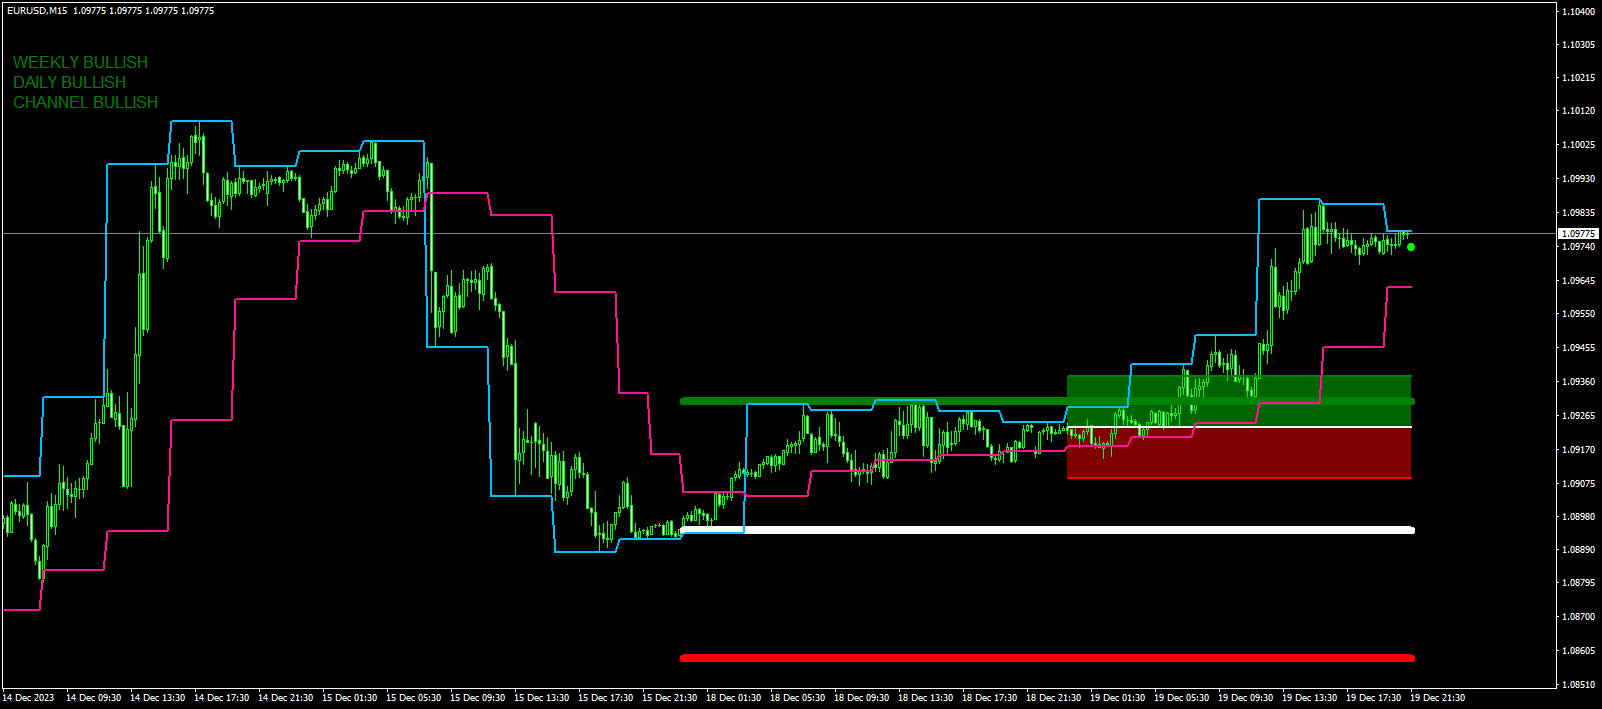
- 特定のタイムフレームから特別に計算されたチャネルで、他のすべてのタイムフレームに表示されます。デフォルトでは、これは4時間のタイムフレームで、取引したい他のタイムフレームに変更することができます。これはノンストップで計算されます。
画面の左上には、ゾーンとチャネルが強気、弱気、中立のいずれであるかが表示されています。この3つすべてが強気の場合、現在のローソク足に緑の点が表示されます。3つとも弱気の場合、ピンクの点が表示されます。
このインディケータに制限はありません。