Atr meter all TimeFrame
- インディケータ
- SERGEI NAIDENOV
- バージョン: 1.3
- アップデート済み: 22 5月 2024
- アクティベーション: 5
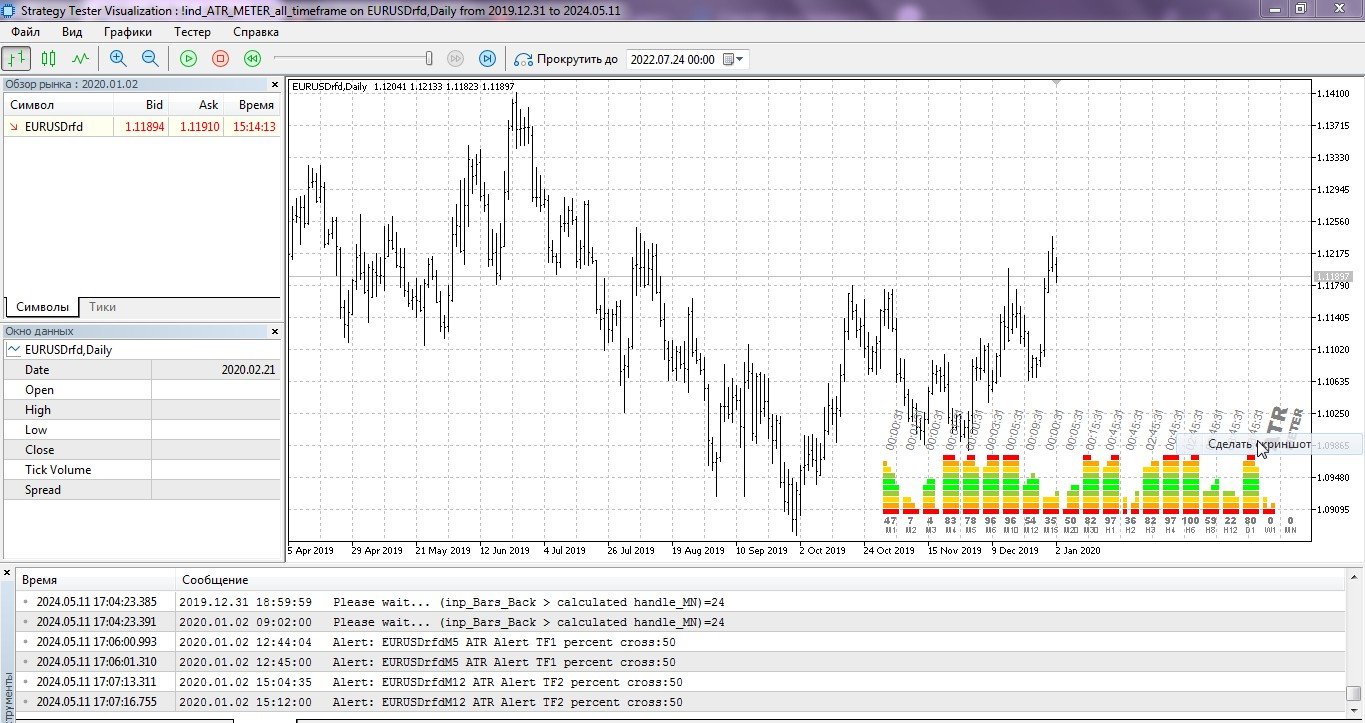
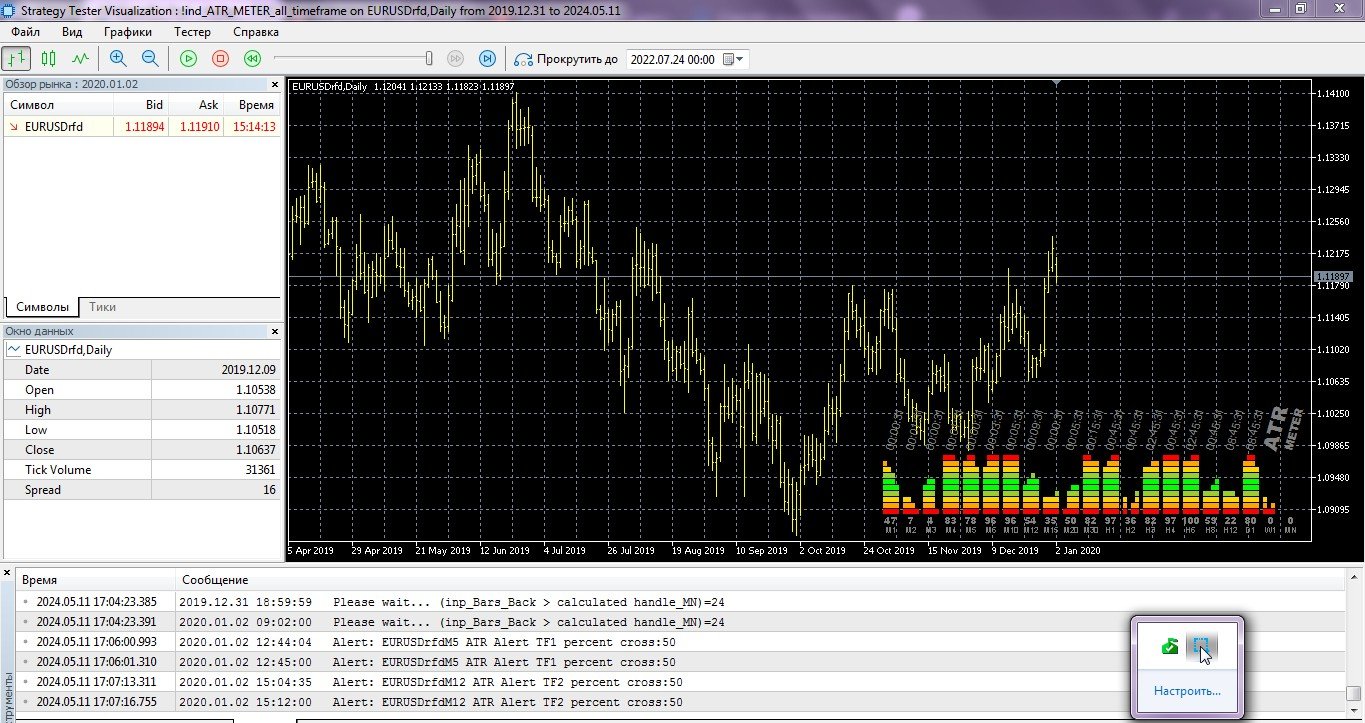
この指標は、商品のボラティリティをすばやく決定するように設計されています。 チャートを変更して、どの商品や期間に活発な取引があり、どこに小康状態があるかをすぐに理解することは非常に便利です。 指標は、パーセンテージに変換されたATR指標のデータを使用します。 チャートにATRを配置すると、画面に約100~300バーが表示されます。この値を平均化し、デフォルトで150を設定します(あなたの裁量で設定で変更することができます)。 動作原理:私たちは150のATR値を取り、最大値と最小値を見つけ、それらの間の距離は100%であり、これに基づいて現在の位置をパーセンテージとして計算します。 指標の各列はそれ自身の期間に対応し、4つのセグメントに分割されます(3、2、1、0は現在のバーです)。 これは、ATRインジケーターの動作を説明するために行われます。
設定:
1)"信号"のグループなら警告して下さい
アラートのクロスパーセント=50;インジケーターが50%を超えると、限月と期間の説明を含むウィンドウが表示されます。
use Alert1TF if signal-シグナル通知を使用するかどうか
信号の時間枠1-信号検索のための時間期間
これまでのところ、それは5つの期間のために行われています。.. (必要に応じて追加できます)
2)ATRの設定
ATR期間=14-デフォルト
履歴バーバック-100%パーセントを計算するために使用するバーの数
3)表示および警告システム情報-表示器の操作についてのシステム情報を表示します
使用のための推薦:
指標を最適かつ迅速に操作するには、チャートに表示されるバーの数を減らす必要があります:
MetaTrader5のメニューで->ツール->設定->チャート->最大。 ウィンドウ内のバー(値が低いほど、使用されるメモリが少なくなり、より高速に動作します)。
このため、最初の起動には時間がかかる場合があります(コンピュータとインターネット接続の速度によって異なります)