AlphaTrend AM
- インディケータ
- Andriy Matviyevs'kyy
- バージョン: 26.30
- アップデート済み: 6 6月 2024
- アクティベーション: 5
AlphaTrend AM is an indicator that allows you to open a position at the very beginning of a significant price movement.
The second most important quality of the indicator is the ability to follow the trend as long as possible in order to obtain all potential profits while minimizing potential losses.
The indicator determines the trend and points to possible entry points formed by local highs/lows.
The indicator allows you to notify the user about your signals by sending messages to the terminal and e-mail.
This indicator does not repaint or not recalculate.
The indicator is a synthesis of two indicators with a similar operating principle - EaseTrend 2 AM / SuperTrend 2 AM.
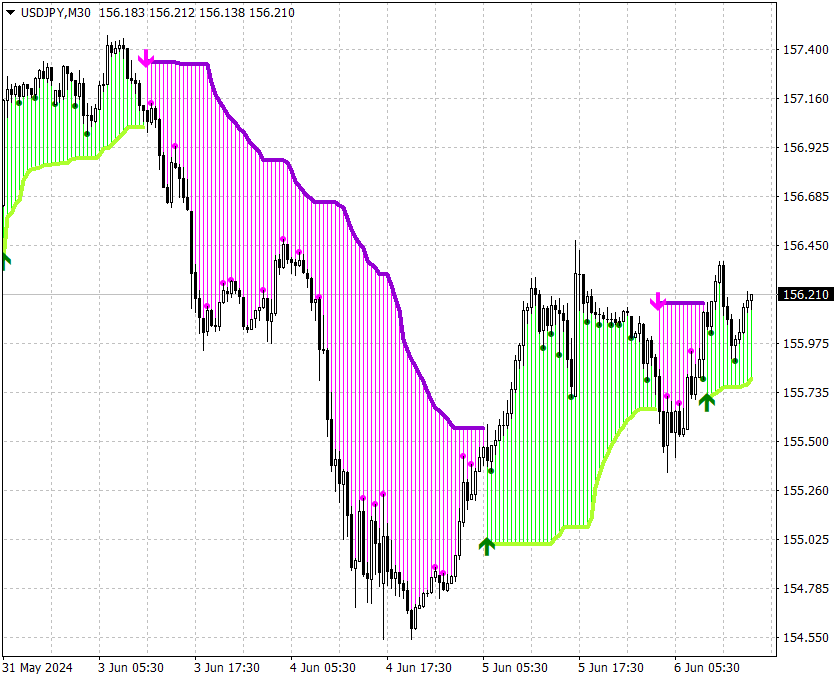
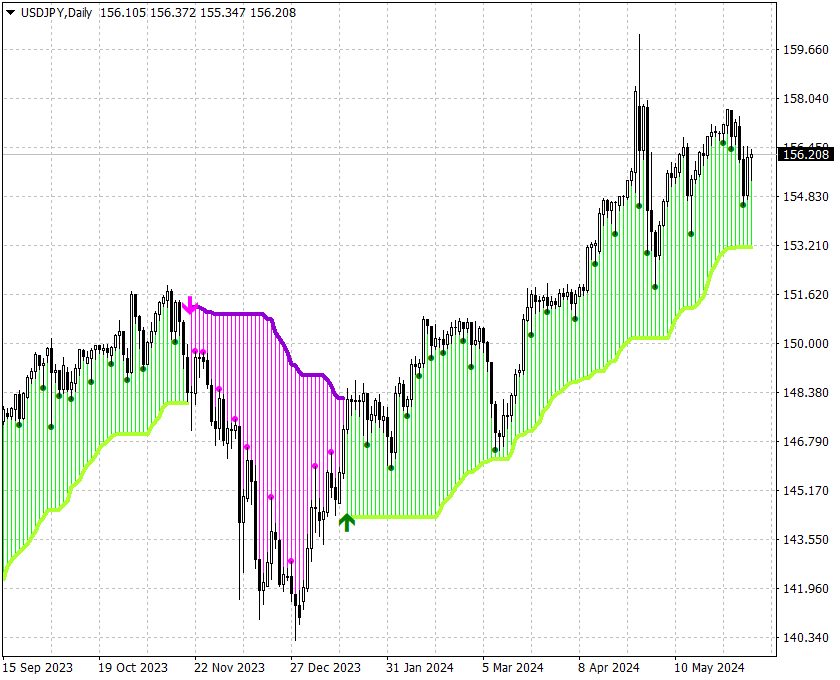
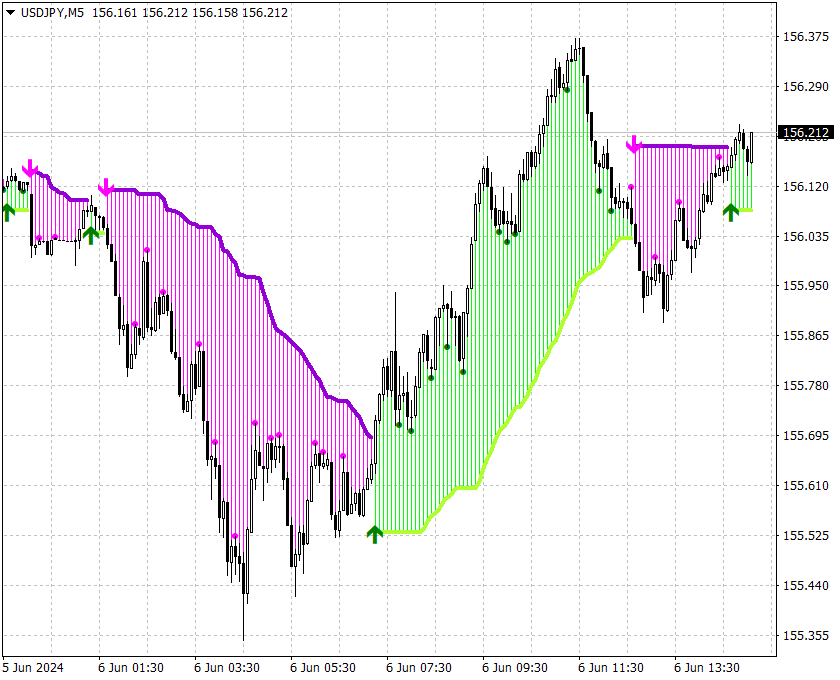
Signal of the indicator:
- red arrow appearing above the price graph - possible start of a downtrend;
- green arrow appearing below the price graph - possible start of an uptrend;
- line - S/R levels.
-
Sensitivity (>0) - sensitivity of the indicator to volatility (the higher the indicator, the less sensitive it is);
- Coefficient - coefficient for the sensitivity of the indicator to volatility (the higher, the more sensitive the indicator);
- Limit - the number of bars determined to form the maximum/minimum of the indicator (the more, the less sensitive the indicator);
- Smoothing_Period - indicator smoothing;
- Smoothing_Shift - shift for smoothing the indicator;
- Smoothing_Method - indicator smoothing method;
- Alerts - show a dialog box containing user data;
- Send_Notification - sends push notifications to the mobile terminals, whose MetaQuotes IDs are specified in the "Notifications" tab;
- Send_Mail - sends an email using an address specified on the Email tab of the options window.