Volatility level
- インディケータ
- Guner Koca
- バージョン: 1.0
- アクティベーション: 20
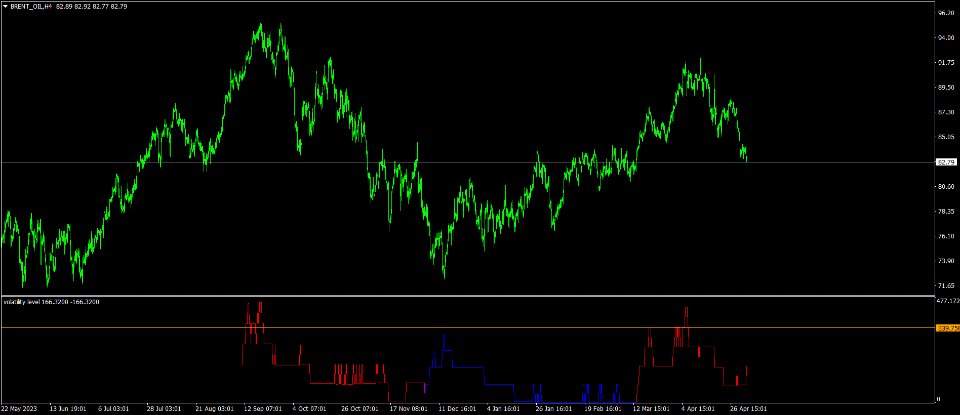
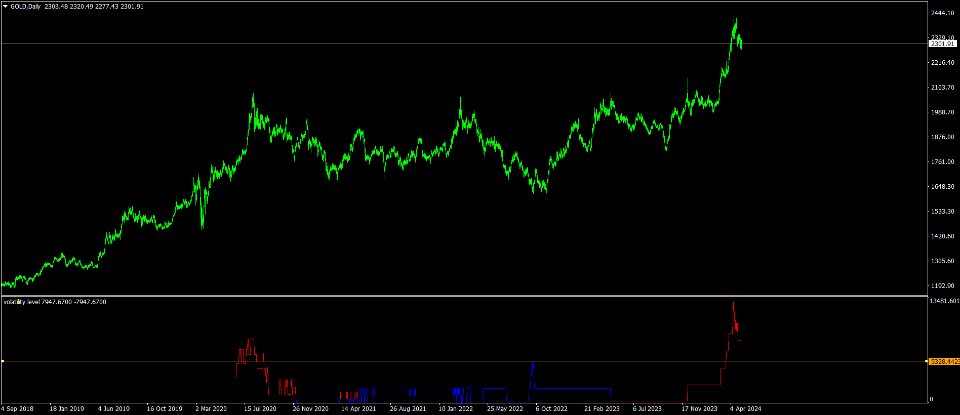
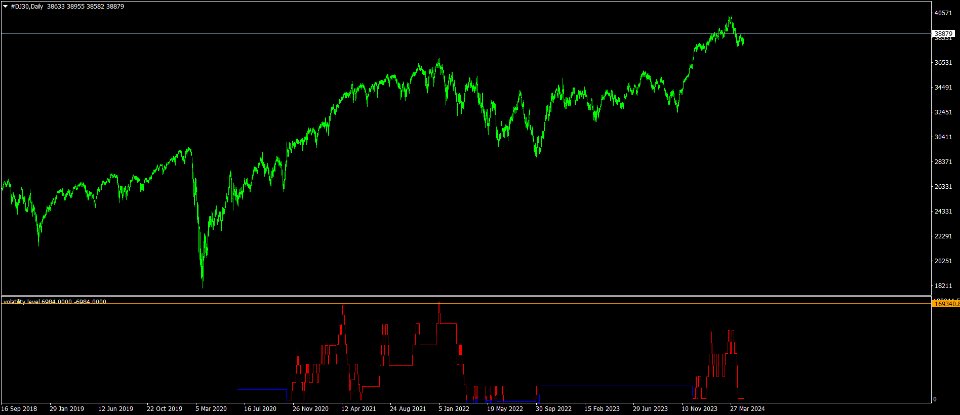
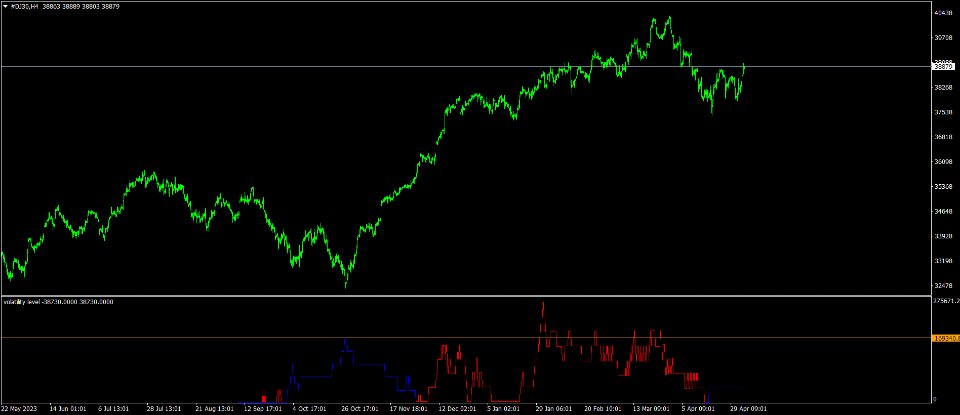
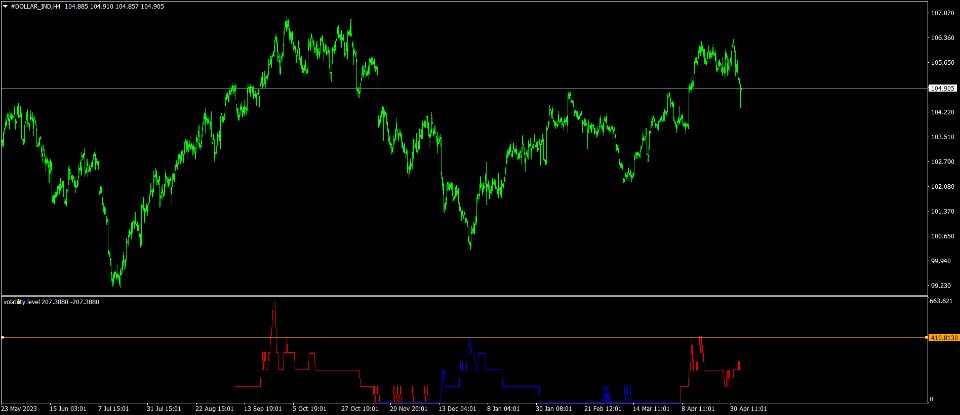
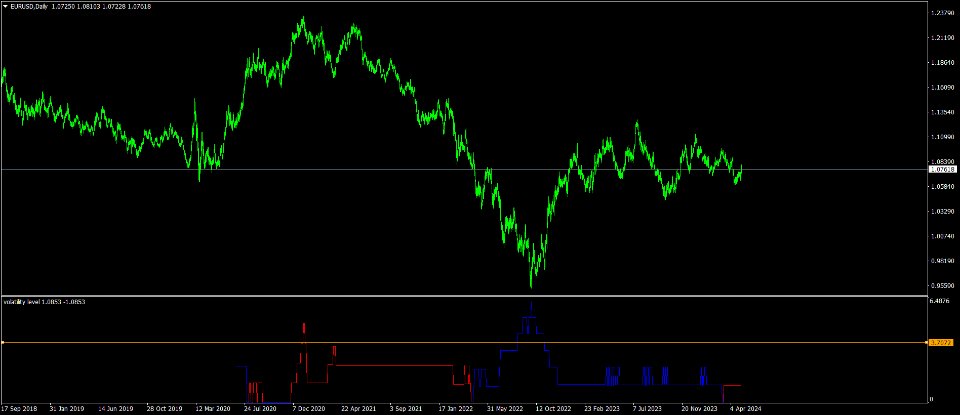
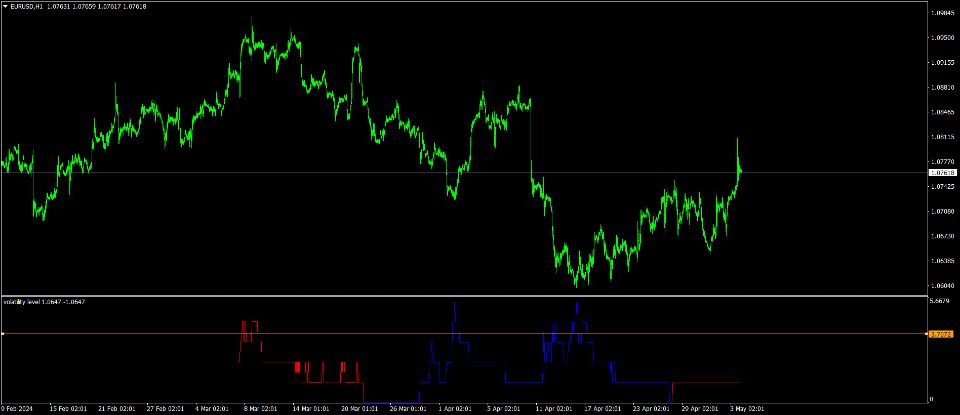
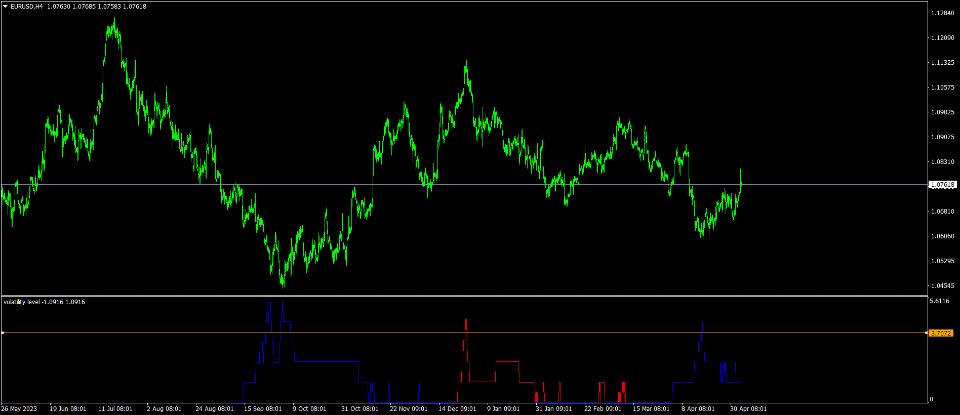
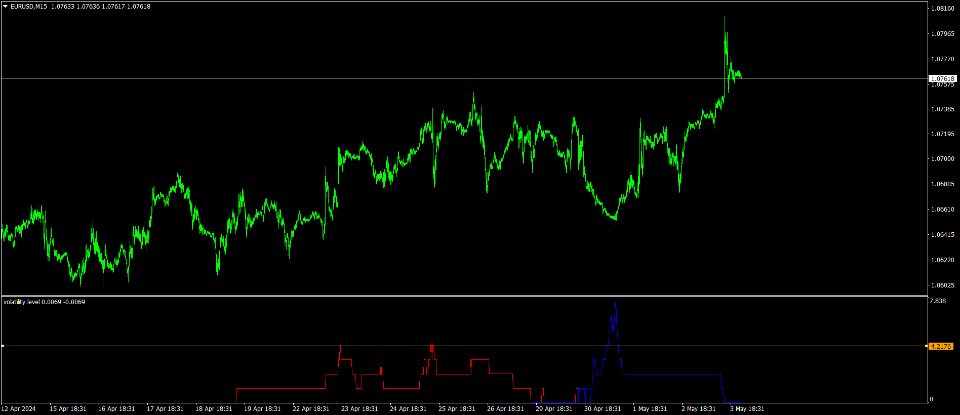
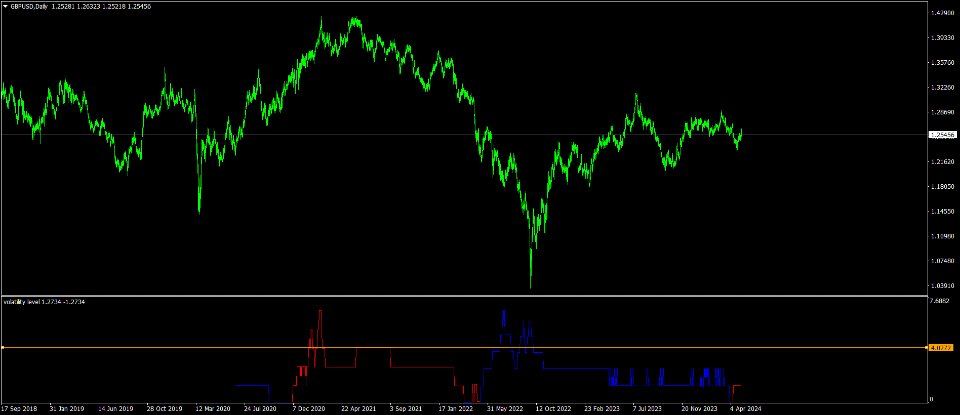
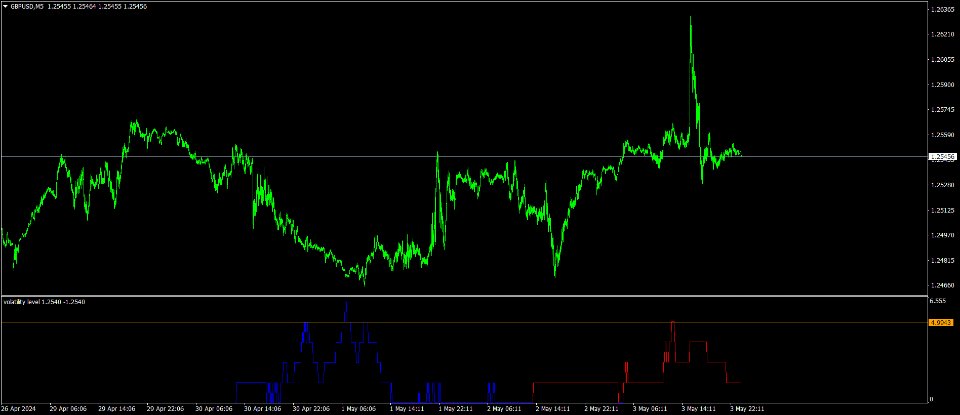
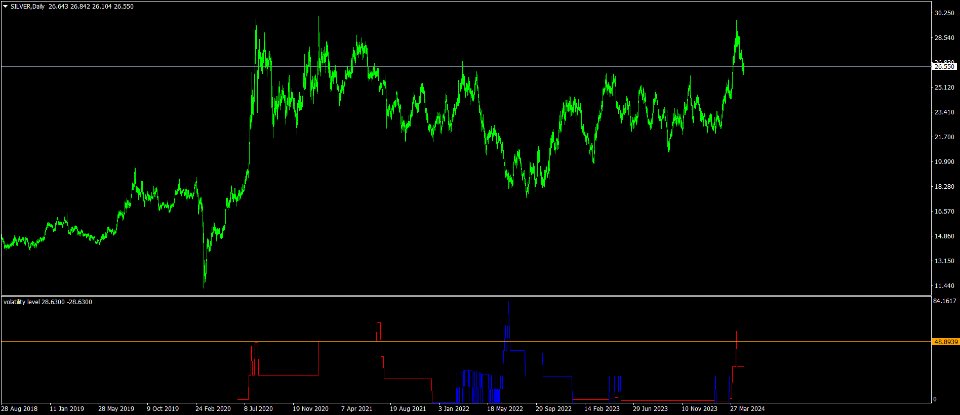
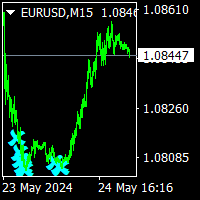
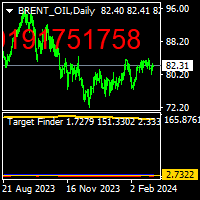
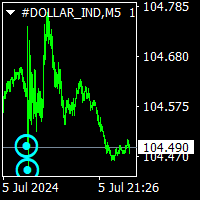
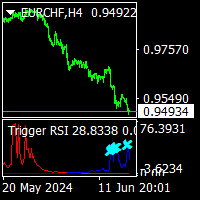
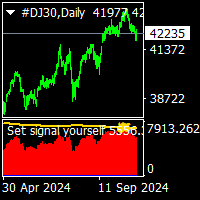
volatility level indicator is a volatility oscillator to see trend reversal points.
price trends has reverese when volatility inreased .
this indicator show trend reversal points volatility.
mostly same level up and down volatility is reversal points.
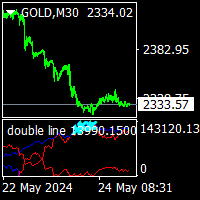
red colour shows up points of volatilty.and probably trend will down.
blue colour oscillator shows deep point of price when increased volatiliyty.
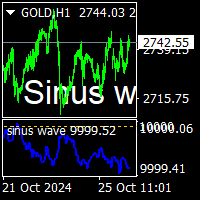
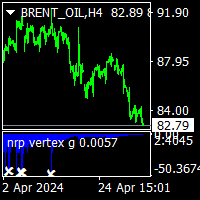
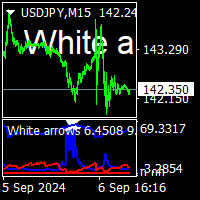
on pictures horizontal lines on oscillator has drawed by hand.to see the before level and compare now.














This indicator really changed my mindset for a long time, after being discouraged by so many trend-based indicators. Actually, no market players knows where the price will move. Moreover, an indicator. So basically, all trend indicators will always be misleading to follow. But the activities of impulsive market players can show concrete signs that the price will move in a certain direction. And this indicator is quite capable of providing predictions of the oddities of the activity, which is reflected in its volatility. I use this as a primary guide, along with other price action indicators.