Dashboard Multi Currency MTF Double RSI
- インディケータ
- Anon Candra N
- バージョン: 1.20
- アップデート済み: 26 9月 2024
- アクティベーション: 20
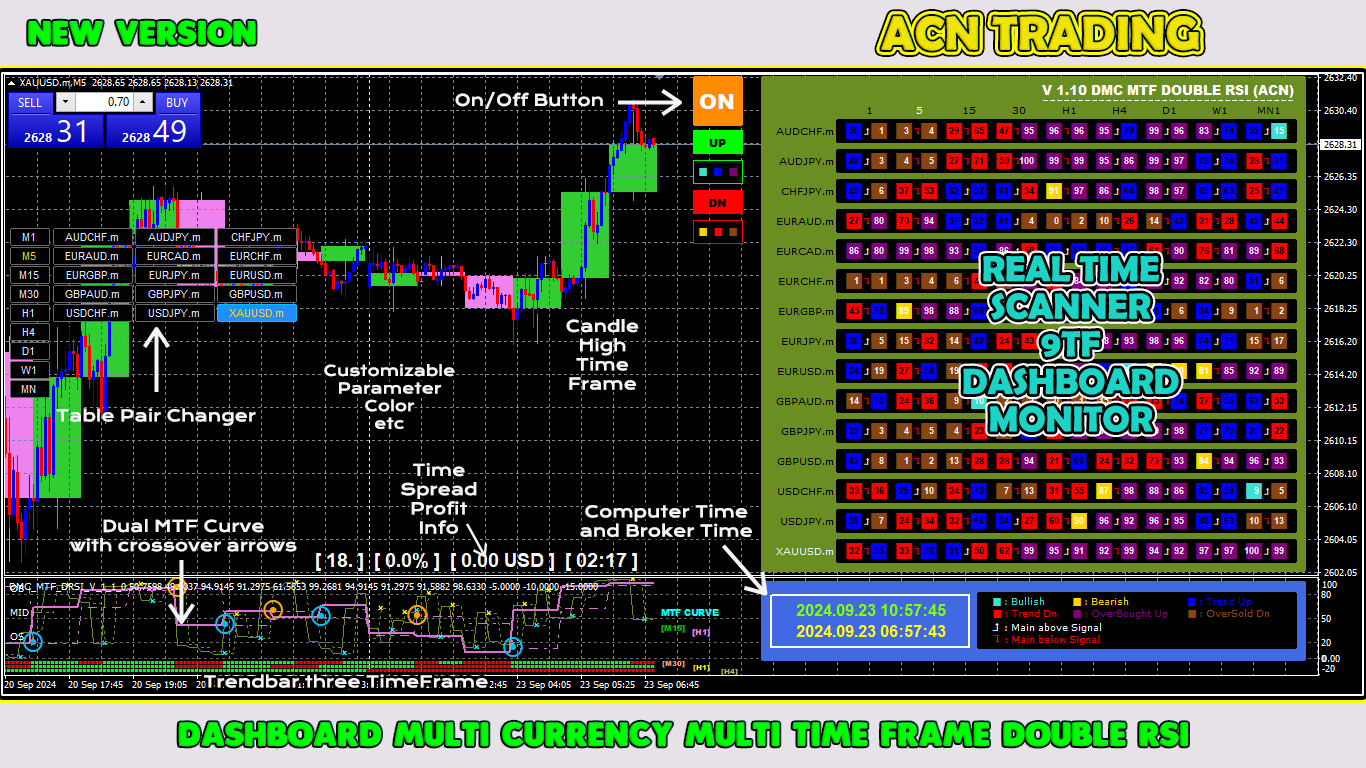
この取引ツールを使用すると、15 の市場を同時にスキャンできます。
新しい取引指標 2024 のご紹介:
➡️ ダッシュボードのマルチ通貨マルチタイムフレームダブルRSI。
私がこの取引ツールを作成した理由は少なくとも 2 つあります。
まず、1 つの市場だけを観察することに飽きました。
次に、別の市場への参入の瞬間を逃したくないです。
だからこそ、他の市況も同時に知りたいのです。
このため、複数の市場の状況を同時にスキャンできるスキャナーが必要です。
私は、高速 RSI ライン > (または <=) 低速 RSI ラインが M1 から H4 (または単に M1 から M30) で始まる市場をよく探します。
また、M1 から M30 まで売られすぎ/買われすぎの市場をよく探します。
私の分析に同意するなら、これがあなたが探していた取引指標です。
市況が上記の要件を満たす瞬間を見逃さないでください。
これは、多くの優れた機能を備えたストキャスティックのスキャナーまたはダッシュボードです。
高速RSIラインのデータを表示可能
遅いRSIラインのデータも表示可能
高速 RSI ラインと低速 RSI ラインの位置を表示できます (高速ラインが低速ラインの上、または高速ラインが低速ラインの下)
速い RSI ラインと遅い RSI ラインの両方のデータ レベルを表示できます (強気、弱気、上昇トレンド、下降トレンド、買われすぎだが依然として上昇、売られすぎだがまだ下落)
M1からMN1までのリアルタイムデータを表示可能
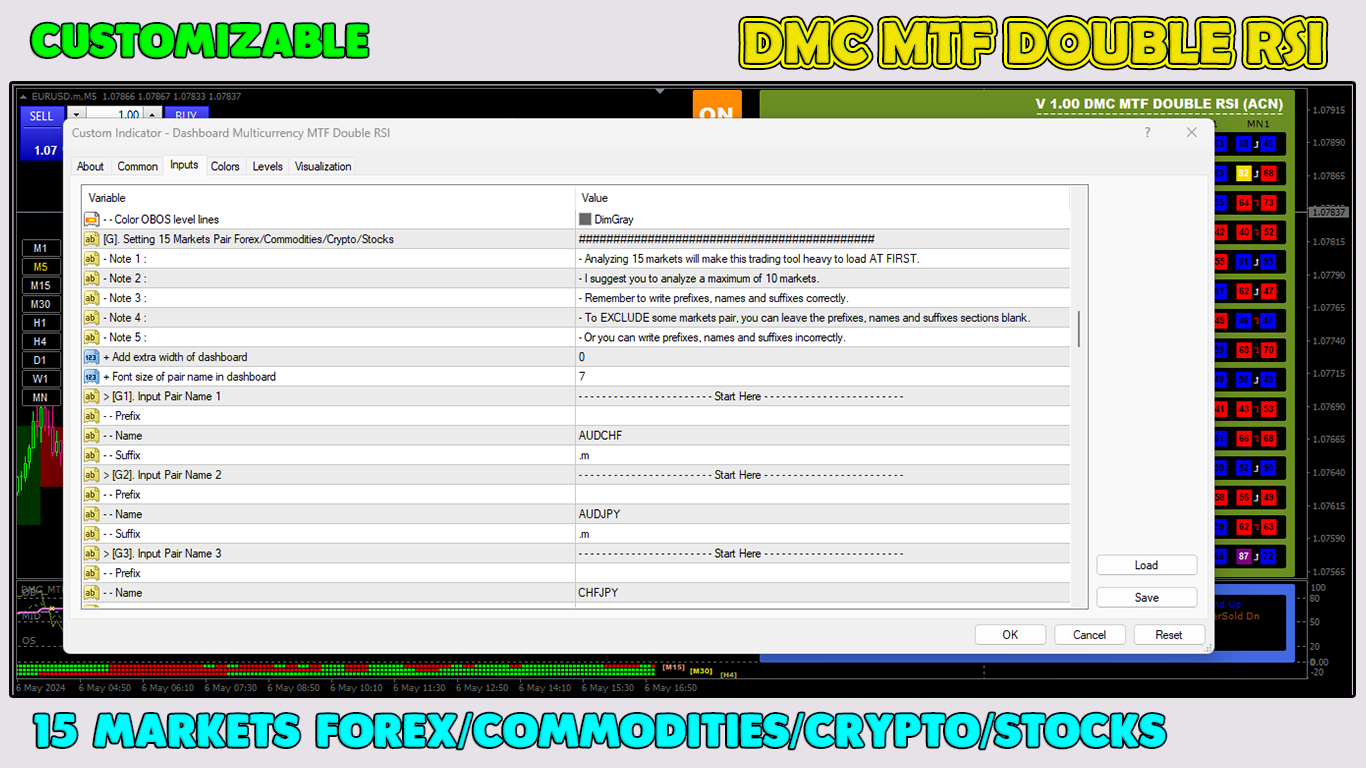
15通貨ペア(多通貨FX/商品/仮想通貨/株式)のデータを表示可能
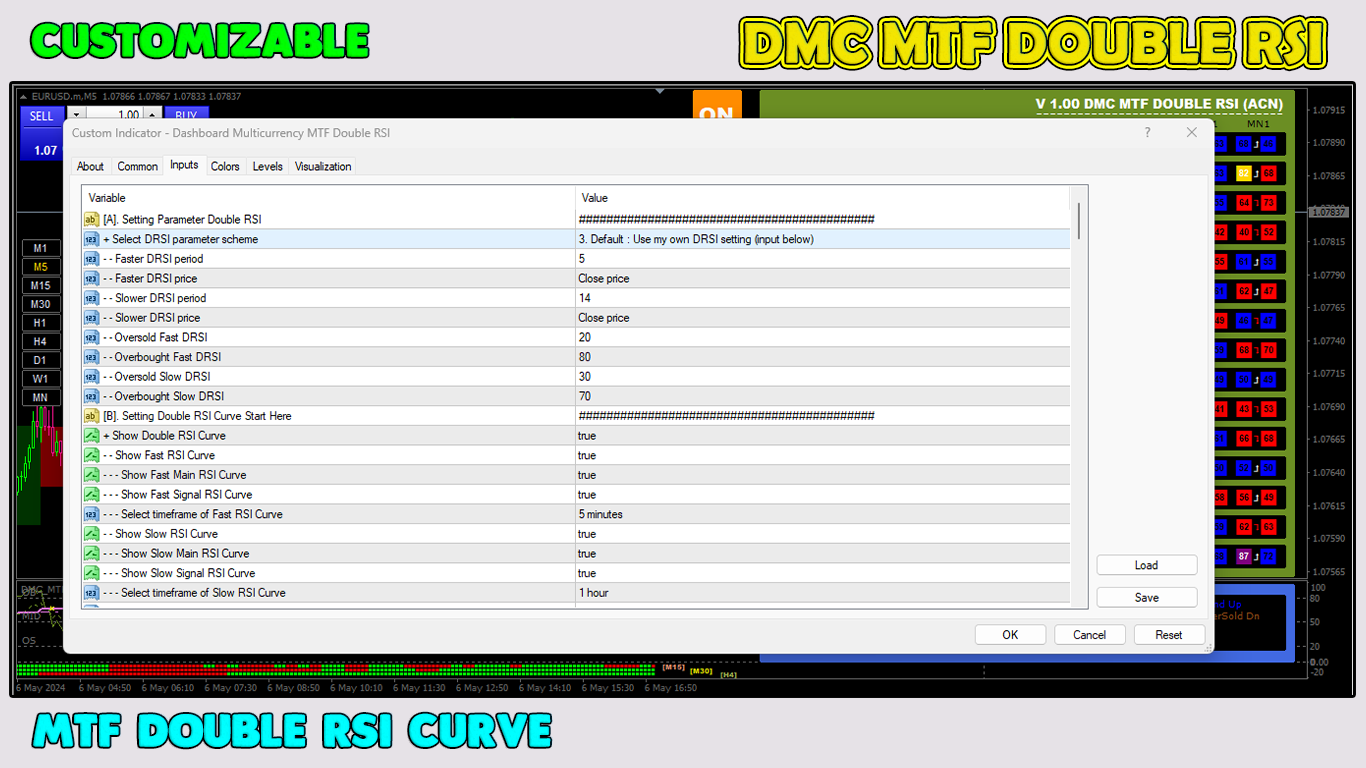
カスタマイズ可能なパラメータ
カスタマイズ可能なカラーOBOSレベル
美しい 20 ダッシュボードの配色
オン/オフ通貨ペアチェンジャーを搭載
ローソク足のハイタイムフレームを搭載
時間差利益情報を搭載
現在のローカルコンピュータ時間とブローカー時間を装備
MTFダブルRSIカーブ搭載
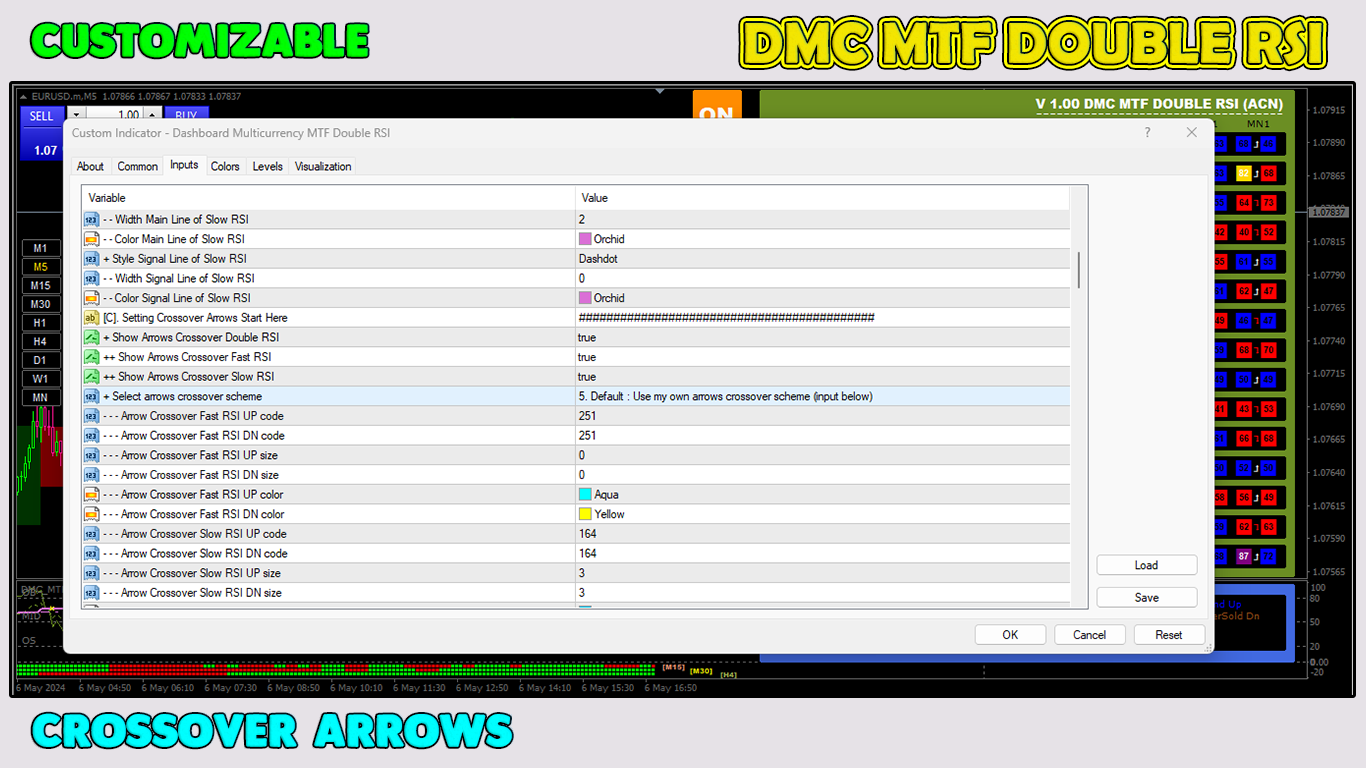
MTFダブルRSIカーブのクロスオーバーアローを搭載
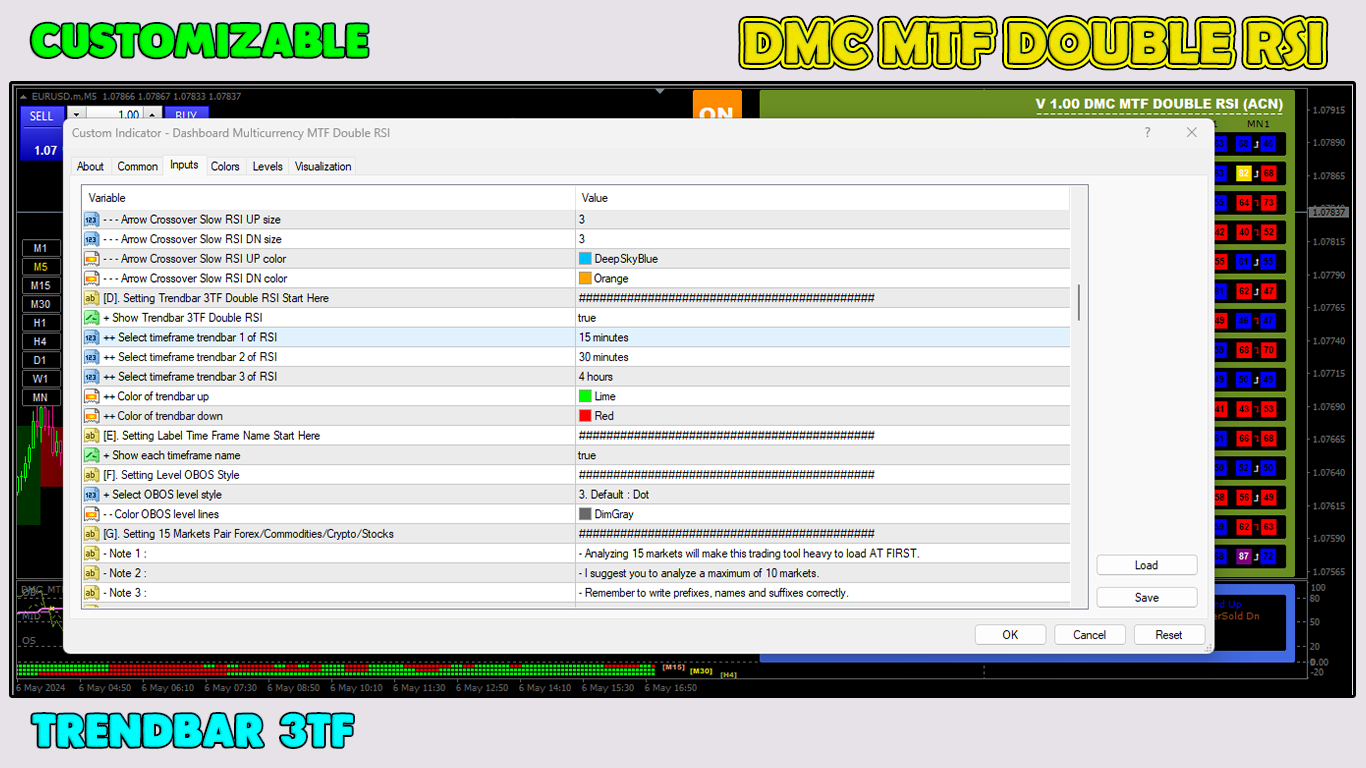
トレンドバー3TFダブルRSI搭載
この取引ツールは、すべてのトレーダーが絶対に必要とするものです。
今すぐダウンロードしてください。
自信を持ってエントリーして、プロのように取引しましょう!
ありがとう。
このプロモーション価格をぜひご利用ください。
さまざまな高度な機能を備えたこの取引ツールは、200 ドルの価格で販売されるはずです。
したがって、この取引指標を今すぐ購入してください。
#ダッシュボードRSI #多通貨 #マルチタイムフレーム #RSItradingstrategy #scannerRSI