Review script historical transaction records
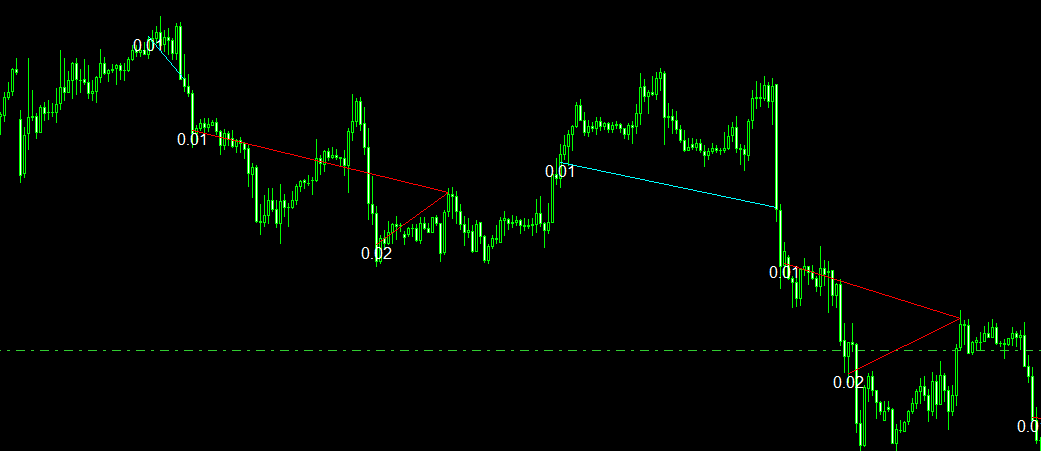
これは複盤スクリプトで、取引履歴をグラフに記録して直接表示します。
まず、アカウントの履歴トランザクションを時間帯に設定し、スクリプトを実行すると、設定した時間帯内の履歴トランザクションをグラフに表示します。表示できるのは、開倉価格、平倉価格、止損価格、止盈価格、および1件当たりの取引量で、多くは赤い線、空単は緑の線である。書留は水平線として表示されます。
1、自分の取引過程を直観的に観察して検査し、自分の取引歴史を振り返ることができ、それによって自分の取引過程に存在する問題を発見し、あなたが損失の原因を見つけることを助け、改善策を考え、方法技術を高めることができます。
2、他の人のアカウントを見て、グラフに彼の取引記録を表示することができて、あなたがそのアカウントの取引方法を学ぶのを助けることができます。
3、仮に取引量が固定している場合、取引口座の履歴に基づいて、すべての取引の損益状況を統計し、さらにこの取引記録の成果を評価することができる。
このスクリプトは非常に実用的で、特に外国為替、現物、先物取引の初心者とベテランが技術を高め、取引経験を総括するのに適している。