• 概要
  • レビュー
  • コメント

Boom and Crash Pro Indicator

Boom and Crash Pro Indicator

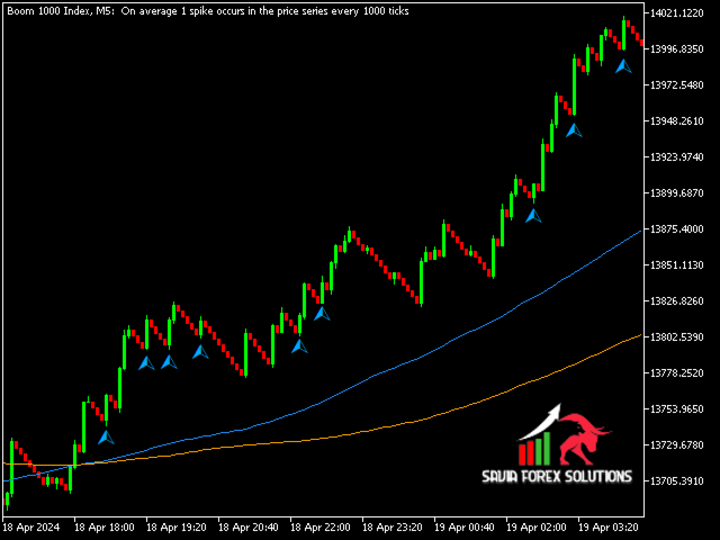
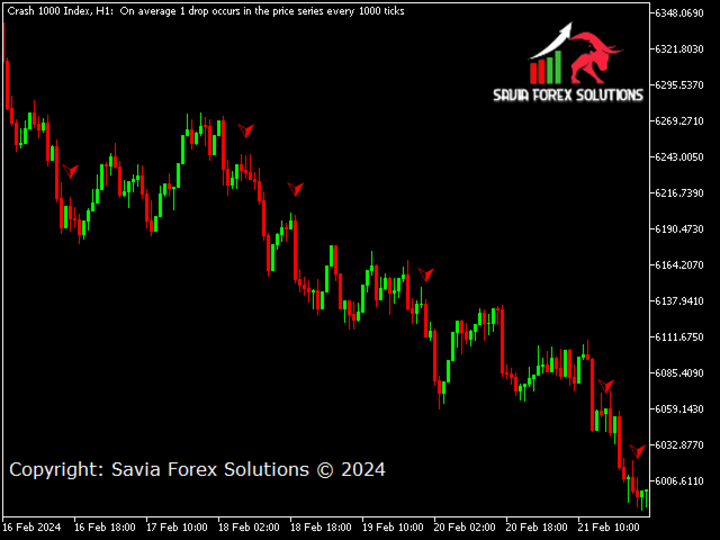
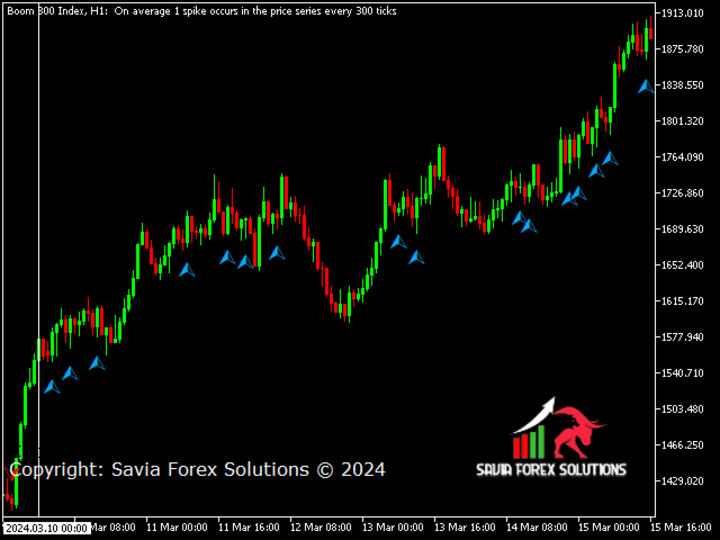
The Savia Forex Solutions Boom and Crash Pro Indicator gives you highly accurate entries on all Boom and Crash Indices. The Boom and Crash Pro Indicator is dynamic and powerful and is optimized for all timeframes. Trade with improved confidence and maximize your success rate.

Benefits

  • Dynamic and Powerful.
  • Boom and Crash Pro Indicator is fully optimized for all chart timeframes.
  • Whether price action is an uptrend, downtrend or trading sideways, Boom and Crash Pro Indicator is consistent in always proving how dynamic and powerful it is by seamlessly adjusting to whatever timeframe you are analyzing.
  • Gain confidence in understanding the direction of the trend, making perfect entries and trade like a pro.

How to use

  • Buy/Rent and install the indicator in your MT5 terminal.
  • Select, drag and drop the indicator onto any chart.
  • That's it! Let the Savia FxS Boom and Crash Pro Indicator show you its power and automatically give you optimized entry signals. The rest is up to you to use your trading knowledge and experience to maximize your success rate.

Settings & How To Use

  • Threshold = Toggle indicator sensitivity. Default setting = 2. The greater the threshold the less signals given. The lower the threshold, the more signals given.
  • Audible Alerts = Toggle ON/OFF to play an alert when a signal is given.
  • Push Notifications: Toggle On/Off to send Notifications to Your Mobile Phone.


Disclaimer

Forex and synthetic indices trading involves risk. Carefully consider your investment objectives, level of experience and risk appetite. Most importantly, do not invest money you cannot afford to lose.

None of the information contained herein are a recommendation or financial advice in any meaning whatsoever, also in the meaning of any trading act or law. I am not accountable for your trading in any way.

Under no circumstance will we provide refunds for our EA's (Robots), Indicators and other software and trading tools purchased from us.

おすすめのプロダクト
This product is designed for the MT5 platform and offers two key features: VWAP (Volume Weighted Average Price) calculation and Volume Profile analysis. Advantages: VWAP Calculation: The product calculates the VWAP, which is a popular indicator used by traders to determine the average price of a security based on its trading volume. It helps identify potential buying or selling opportunities by comparing the current price to the average price weighted by volume. Volume Profile Analysis: The prod
このインジケーターは、チャート上のすべての注文 (トランザクション/注文ラインにクローズ) に対して既に設定した TP および SL 値 (その通貨で) を表示し、すべての注文の利益と損失を見積もるのに大いに役立ちます。また、PIP 値も表示されます。表示されている形式は、「利益または損失の通貨値 / PIP 値」です。 TP 値は緑色で表示され、SL 値は赤色で表示されます。 ご質問や詳細については、fxlife.asia@hotmail.com で販売者にお気軽にお問い合わせください。 (そして、近日中にインジケータに追加される次の機能は、「自動または半自動の TP および SL 設定」であり、お客様は無料で更新バージョンを入手できます。よろしくお願いします。) (または、表示に何か機能を追加すべきだと思われる場合は、お気軽にお申し付けください)
QuantumForexBot   is a reliable automated assistant for traders specializing in trend trading on the Forex market. Trading on the Forex market is a complex process that requires a significant amount of time, effort, and experience. With the advent of trading bots, traders can now automate their trading strategies and take advantage of market trends without the need to spend countless hours analyzing data. QuantumForexBot is recommended for use on highly volatile currency pairs or during perio
Naked Forex Kangaroo Tail Indicator Kangaroo Tail Indicator is a pattern recognition indicator for Forex, Stocks, Indices, Futures, Commodities and Cryptos. The Kangaroo Tail is a multi-bar pattern. The Kangaroo Tail pattern is very effective and is very simple to trade. The strategy that comes with the Kangaroo Tail is based on price action. The indicator does what it was designed for: displaying Kangaroo Tail patterns.   Don't expect to follow the up and down arrows and make money . Tr
Fibonacci and RSI. Demo versión only works with GBPUSD. For full version, please, visit visit https://www.mql5.com/en/market/product/52101 The indicator is a combination of the Fibonacci and RSI indicators. Every time the price touches one of the fibonacci levels and the rsi condition is met, an audible alert and a text alert are generated. Parameters number_of_candles : It is the number of candles that will be calculated. If you put 100, the indicator will give you the maximum and min
FREE
A powerful oscillator that provide Buy and Sell signals by calculating the investor liquidity. The more liquidity the more buy possibilities. The less liquidity the more sell possibilities. Please download the demo and run a backtest! HOW IT WORKS: The oscillator will put buy and sell arrow on the chart in runtime only . Top value is 95 to 100 -> Investors are ready to buy and you should follow. Bottom value is 5 to 0 -> Investors are ready to sell and you should follow. Alert + sound will app
Трендовый индикатор который подойдет как для новичка, так и для профессионального трейдера. Алгоритм индикатора отфильтровывает незначительные колебания цены при этом выделяет основные трендовые движения.  First trend PRO подойдет для неопытных трейдеров. Индикатор показывает точки входа и текущее направление движения цены. Благодаря этому вы всегда будите в курсе текущего положения дел на рынке.  Преимущества First trend PRO : First trend PRO подходит для всех символов Meta Trader 5: валют, мет
Reverse side scalper is the manual trading system, that works on choppy(anti-trend) market. As a rule markets are on 80% choppy and only 20% is trend phase. System is based on custom step Moving and RSI and reverse pattern. System defines up movement, down movement, trend / choppy phases. Indicator plots Buy signal arrow when current direction is down and phase is trend, Sell signal arrow is plotted when currently is up movement and phase is trend. As a rule it allows to "catch" local maximum/mi
RAD CRITICAL LEVES RAD indicator tracks “Relevant Volume” in real time, identifying accumulation and distribution processes, projecting them in the chart as SUPPORT or RESISTANCE zones. Natural   support   and resistance levels are generated by Volume Accumulation and Distribution processes. As these processes evolve, levels at which the relevant volume in the market place is positioned, become difficult areas to cross upwards or downwards. By using this information, traders can identify very s
How to use Pair Trading Station Pair Trading Station is recommended for H1 time frame and you can use it for any currency pairs. To generate buy and sell signal, follow few steps below to apply Pair Trading Station to your MetaTrader terminal. When you load Pair Trading Station on your chart, Pair Trading station will assess available historical data in your MetaTrader platforms for each currency pair. On your chart, the amount of historical data available will be displayed for each currency pai
Your Trend Friend
Luigi Nunes Labigalini
5 (1)
The trend is your friend! Look at the color of the indicator and trade on that direction. It does not  repaint. After each candle is closed, that's the color of the trend. You can focus on shorter faster trends or major trends, just test what's most suitable for the symbol and timeframe you trade. Simply change the "Length" parameter and the indicator will automatically adapt. You can also change the color, thickness and style of the lines. Download and give it a try! There are big movements
Pmax
Celal Engin Baka
PMax is a brand new indicator developed by KivancOzbilgic in earlier 2020. It's a combination of two trailing stop loss indicators; One is Anıl Özekşi's MOST (Moving Stop Loss) Indicator and the other one is well known ATR based SuperTrend. Both MOST and SuperTrend Indicators are very good at trend following systems but conversely their performance is not bright in sideways market conditions like most of the other indicators. Profit Maximizer - PMax tries to solve this problem.   PMax
This indicator is based on a mathematical formula and an ANN combined, designed to make a model(using previous prices) of the most recent market condition (any chart*) in order to use the model as a forecasting tool. *This indicator can operate on any chart/timeframe, but it's suggested you use multiple timeframes for each trade because this method relies solely on the time factor, you can not use this indicator to predict price volatility, but if it's fit correctly it will show you when the nex
MarketMagnet
Kelly Adediran Raymond
Are you ready to take your trading journey to new heights? Look no further than MarketMagnet, this groundbreaking indicator designed to propel your trading success with excitement and accuracy. Powered by the convergence of Momentum and CCI (Commodity Channel Index), MarketMagnet equips traders with the ultimate tool to determine direction and entry prices for a wide range of recommended currency pairs and instruments. It is designed for traders seeking to scalp for a few pips on lower timeframe
What is KTrend indicator ? KTrend is a powerful indicator for trading medium-term binary options that identify the trend of price by candlesticks. Sell signal is formed when the value is below the zero line. Similarly, buy signal is formed when the value is above the zero line. It is separated from KTrend trading system and you can get the backtest result from the pictures below.
The Urgently indicator is designed to quickly determine the situation in the market, reflect the state of the market and signal profitable levels for opening trades. Market conditions change quickly enough, requiring constant calibration of trading strategies. Recommended for use in conjunction with any of the oscillators. The Urgently forex market trend indicator shows the trend direction and entry points. It smooths out price fluctuations when generating a signal by averaging the data and the
Upgraded - Stars added to indentify Areas you can scale in to compound on your entry  when buying or selling version 2.4 Upgraded Notifications and alerts added version 2.3 *The indicator is suitable for all pairs fromm  Deriv pairs (Vix,jump,boom & crash indices) , Currencies, cryptos , stocks(USA100, USA30 ), and metals like gold etc. How does it work? Increasing the period make it more stable hence will only focus on important entry points However  lowering the period will mean the indica
Tree Of Life is a fully automated trading robot designed to generate stable long-term gains while providing excellent risk management. After years of trading and testing, we have discovered spesific combinations of indicators and internal calculations that secure a solid foundation for a robust strategy. The main indicators Tree Of Life uses are the Moving Average and Stochastic. Together with internal calculations, our combinations have proven to be a solid recipe.   The Money Management m
Limitless MT5 is a universal indicator suitable for every beginner and experienced trader. works on all currency pairs, cryptocurrencies, raw stocks Limitless MT5 - already configured and does not require additional configuration And now the main thing Why Limitless MT5? 1 complete lack of redrawing 2 two years of testing by the best specialists in trading 3 the accuracy of correct signals exceeds 80% 4 performed well in trading during news releases Trading rules 1 buy signa
TPO Profile MT5
Kyra Nickaline Watson-gordon
Definition : TPO is a Time Price Opportunity. Instead of using bars or candles with an Open, High, Low, and Close price, each "bar" in a Market Profile is represented by horizontal bars against the price It is called Market Profile terminology. In other words time-price-opportunity (TPO) profiles are histograms of how much time was spent at each price within the span of the profile. By using a TPO chart, you are able to analyze the amount of trading activity, based on time, for each price leve
MSnR Lines
Pierre Paul Amoussou
MSnR Lines は、サポートとレジスタンスの水準をチャート上に表示するカスタムインジケーターです。これらの水準は、マレーシアのSNR理論に基づいています。この理論では、水準は特定の価格水準を指し、エリアではありません。これらの価格水準は、ラインチャートのピークと谷に基づいています。 特徴: A-Level、V-Level、ギャップレベルの3つの種類の水準。 水準の新鮮さインジケータ:新鮮な水準は、未テストの水準や取引された水準よりも重要です。 新鮮な水準と新鮮でない水準の色とスタイルをカスタマイズ可能。 新鮮な水準のみを表示するか、すべての水準を表示するかを選択できます。 バックテスト期間と現在の価格上下の水準の数を調整可能。 複数のタイムフレームをサポート。 用途: トレーダーは、MSnR Linesを使用して潜在的なサポートとレジスタンスの水準を識別し、取引の意思決定を行うことができます。新鮮な水準はより重要であり、より良い取引機会を提供する可能性があります。また、異なるタイムフレームの水準を使用してマルチタイムフレーム分析を行い、取引の精度と信頼性を向上させることがで
クリスマスセール!40% OFF!1月1日に価格が$250に値上がり! GoldenGate Entriesをご紹介します:最先端のトレーディングソリューション! GoldenGate Entries(GGE)を使用して取引する革新的なアプローチを発見しましょう。GGEは、取引体験を向上させるために設計された先進的なインジケーターで、ユーザーに正確性と自信を持たせるための包括的な機能を提供します。 通貨ペア:Any(FX - 商品 - 株式 - 株式 - クリプト) タイムフレーム:15分からH1 主な特徴: 買いと売りの矢印の指示:常に情報を受け取るために、買いと売りの矢印の指示をポップアップアラートとともに受け取ります。 GoldenGate_Algo:GoldenGate_Algoを使用して市場の状況を把握し、市場が「売り過ぎ」または「買い過ぎ」かどうかを評価する強力なツールです。 現在のトレンド分析:視聴中のタイムフレームで現在のトレンドにアクセスして、取引を市場の主流方向に合わせることができます。 組み込みのピボットポイント:組み込まれた
ACB Breakout Arrows MT5
KEENBASE SOFTWARE SOLUTIONS
5 (1)
The ACB Breakout Arrows indicator provides a crucial entry signal in the market by detecting a special breakout pattern. The indicator constantly scans the chart for a settling momentum in one direction and provide the accurate entry signal right before the major move. Get multi-symbol and multi-timeframe scanner from here - Scanner for ACB Breakout Arrows MT 5 Key features Stoploss   and Take Profit levels are provided by the indicator. Comes with a MTF Scanner dashboard which tracks the br
Stormer RSI 2
Ricardo Rodrigues Lucca
This strategy was learned from Stormer to be used on B3. Basically, 15 minutes before closing the market, it will check RSI and decided if it will open an position. This strategy do not define a stop loss. If the take profit reach the entry price it will close at market the position. The same happens if the maximal number of days is reached. It is created to brazilian people, so all configuration are in portuguese. Sorry Activations allowed have been set to 50.
View Trade Status
Jose Pablo Estrella Mejia
This indicator will help you have a better visualization of the status of your open trades. You can see profits or losses in USD or %, as well as a total of all trades and the percentage of profit or loss according to your account size. You can change the font size and color. I hope you find it useful and it makes monitoring your trades easier.  This indicator adjusts to the size of your screen and will be positioned in the bottom right corner of your screen for better convenience.
Micro  ******************* Секундные графики MT5 ********************** Более точного инструмента для входа в сделку вы не найдёте. Входные параметры: Timeframe, sek - период построения графика, секунды Displayed bars - отображаемые бары Step of price levels, pp, 0-off - шаг отрисовки ценовых уровней, пункты Scale points per bar, 0-off - масштаб в пунктах на бар Show lines - отображение текущих уровней Show comment - отображение комментария Standard color scheme - стандартная цветовая сх
Automatic cataloging of probabilistic strategies for Binary Options. Including: * MHI 1, 2 and 3, "MHI potencializada", M5 variation, Five Flip, "Padrão do Milhão", "Três Vizinhos", C3 and Turn Over. * Analysis by time range, date, and days of the week. * Function that brings results from other pairs. * Analysis only following trend and / or side market. * Operation analysis filtering only entries after hit. * Alert after x number of hits, after loss in martingale, or in each new quadrant ent
Binary Trader EA   This EA is designed to trade synthetic indices Boom 1000 index & Crash 1000 index. Boom1000 index & Crash1000 index from volatility 75 index Please don't use the default settings, ask for proper settings and I will send you. This EA follows the trend. Can set risk as a percentage. Only tested on binary deriv broker indices.  Crash 1000 index spikes down, so to avoid that, we trade on a bigger timeframes, 1hr timeframe is perfect. Contact me if you have any questions. Recomme
The SmartTrendMt5 trend indicator generates signals based on the principle of combined analysis of calculated reference points within the Keltner channel. The indicator plots the Keltner channel in a separate window (by default, red lines and a blue line - the middle of the channel), and also draws the histogram of calculated reference points for each candle (by default, the histogram bars are yellow). The should be attached to a chart of any timeframe and any trading symbol in the usual way.
A Média Móvel é um indicador que faz parte da Análise Técnica. Com ela, é possível identificar o equilíbrio dos preços no mercado, observando tendências de alta, neutra ou baixa. Este indicador customizado traz opções extras pera definir o método de cálculo podendo-se esclolher entre SMA,EMA,SSMA,LWMA,JJMA,JurX,ParMA,T3,Vidya,AMA,HULL MA. Também conta com varias opções para escolher o método de cálculo para o preço base a ser usado no cáculo da média.
このプロダクトを購入した人は以下も購入しています
まず第一に、この取引インジケーターは再描画されず、再描画されず、遅延しないことを強調する価値があります。これにより、手動取引とロボット取引の両方に理想的なものになります。 ユーザーマニュアル:設定、入力、戦略。 アトミックアナリストは、価格の強さとモメンタムを利用して市場でより良いエッジを見つけるためのPA価格アクションインジケーターです。ノイズや誤ったシグナルを除去し、取引ポテンシャルを高めるための高度なフィルターを備えています。複雑なインジケーターの複数のレイヤーを使用して、アトミックアナリストはチャートをスキャンし、複雑な数学的計算をシンプルなシグナルと色に変換します。これにより、どのような初心者トレーダーでも理解して使用し、一貫した取引の決定を行うことができます。 「アトミックアナリスト」は、新規および経験豊富なトレーダー向けにカスタマイズされた包括的な取引ソリューションです。プレミアムインジケーターとトップノッチの機能を1つの取引戦略に組み合わせ、すべてのタイプのトレーダーにとって汎用性のある選択肢にします。 デイリートレーディングとスキャルピング戦略:高速で正確な
まず第一に、このトレーディングシステムがノンリペイント、ノンリドロー、ノンラグのインジケーターであることを強調する価値がある。これにより、手動取引とロボット取引の両方に理想的なものになっています。 オンラインコース、マニュアル、プリセットのダウンロード。 「スマートトレンドトレーディングシステム MT5」は、新規および経験豊富なトレーダー向けにカスタマイズされた包括的なトレーディングソリューションです。10以上のプレミアムインジケーターを組み合わせ、7つ以上の堅実なトレーディング戦略を備えており、多様な市場状況に対応する多目的な選択肢となっています。 トレンドフォロー戦略:トレンドを効果的に乗り越えるための正確なエントリーとストップロス管理を提供します。 リバーサル戦略:潜在的なトレンドの反転を特定し、トレーダーがレンジ相場を活用できるようにします。 スキャルピング戦略:高速で正確なデイトレードおよび短期取引のために設計されています。 安定性:すべてのインジケーターはノンリペイント、ノンリドロー、ノンラグであり、信頼性の高いシグナルを保証します。 カスタマイズ:個々の取引の嗜好に合わせ
ご紹介   クォンタム トレンド スナイパー インジケーターは 、トレンド反転を特定して取引する方法を変革する画期的な MQL5 インジケーターです。 13年以上の取引経験を持つ経験豊富なトレーダーのチームによって開発されました。     クォンタムトレンドスナイパーインジケーター   は、非常に高い精度でトレンドの反転を識別する革新的な方法で、あなたのトレーディングの旅を新たな高みに押し上げるように設計されています。 ***Quantum Trend Sniper Indicatorを購入すると、Quantum Breakout Indicatorを無料で入手できます!*** クォンタム ブレイクアウト インジケーターは、トレンドの反転を特定するとアラートを発し、矢印を示し、3 つのテイクプロフィットレベルを提案します。 初心者トレーダーにもプロのトレーダーにも適しています。 量子EAチャネル:       ここをクリック MT4のバージョン:       ここをクリック 推奨事項: 期間:すべての時間枠。最良の結果を得るには、M
Reversal First Impulse levels (RFI)      INSTRUCTIONS        RUS       -       ENG              R ecommended to use with an indicator   -   TREND PRO -  Version MT4                 A key element in trading is zones or levels from which decisions to buy or sell a trading instrument are made. Despite attempts by major players to conceal their presence in the market, they inevitably leave traces. Our task was to learn how to identify these traces and interpret them correctly. Main functions:: Di
FX Volume MT5
Daniel Stein
4.94 (17)
mql5と Telegramの モーニング・ブリーフィングで、詳細とスクリーンショットを含む毎日のマーケット・アップデートをご覧 ください! FX Volumeは、ブローカーの視点から市場のセンチメントをリアルに洞察する、最初で唯一の出来高インジケーターです。 ブローカーのような機関投資家が外国為替市場でどのようなポジションをとっているか、COTレポートよりもはるかに速く、素晴らしい洞察を提供します。 この情報をチャート上で直接見ることは、あなたの取引にとって真のゲームチェンジャーであり、画期的なソリューションです。 以下のようなユニークなマーケットデータ洞察から利益を得てください。 比率は 、通貨のロングポジションとショートポジションの比率をパーセントで表示します。 比率の変化は 、選択した期間内のロング比率とその変化率を表示します。 Volumes Totalは 、通貨の取引量(ロングとショート)の合計をロット単位で表示します。 Volumes Long :全通貨のロングポジションの取引量を表示します。 Volumes(ショート )は、全通貨のショートポジションの取引量を表示
トレンド スクリーナー インジケーターでトレンド取引の力を解き放ちます。ファジー ロジックと複数通貨システムを活用した究極のトレンド取引ソリューションです。 ファジー ロジックを活用した革新的なトレンド インジケーターである Trend Screener を使用して、トレンド取引を向上させます。 これは、13 を超えるプレミアム ツールと機能、および 3 つの取引戦略を組み合わせた強力なトレンド追跡インジケーターであり、Metatrader をトレンド アナライザーにする多用途の選択肢となります。 期間限定オファー : トレンド スクリーナー インジケーターは、わずか 50 ドルで生涯ご利用いただけます。 (元の価格 125$ ) (オファー延長) Trend Screener の 100% 非再描画精度の揺るぎない精度を体験して、取引の決定が過去の価格変動の影響を受けないようにしてください。 マルチタイムフレームおよびマルチ通貨機能の多用途性を解放し、比類のない自信を持って外国為替、商品、暗号通貨、インデックスの世界を取引できるようにします。 Trend Screener の包括的な
mql5と Telegramの モーニング・ブリーフィングで、詳細とスクリーンショットを含む毎日のマーケット・アップデートをご覧 ください! FX Power MT5 NGは 、長年の人気を誇る通貨強度計FX Powerの次世代モデルです。 この次世代ストレングスメーターは何を提供するのでしょうか?初代FXパワーの魅力すべて プラス GOLD/XAUの強さ分析 より正確な計算結果 個別に設定可能な分析期間 カスタマイズ可能な計算上限値により、さらに優れたパフォーマンスを実現 もっと見たい人のための特別なマルチインスタンス設定 すべてのチャートでお好みの色を無限に設定可能 数え切れないほどの通知オプションにより、重要なことを見逃すことはありません。 Windows 11とmacOSのスタイルで角を丸くした新しいデザイン 魔法のように動くインジケーターパネル FXパワーの主な機能 すべての主要通貨の強さの完全な履歴 すべての時間枠における通貨の強さの履歴 すべてのブローカーとチャートで同一の計算結果 100%信頼できるリアルタイム計算 -> リペイントなし ドロップダウン・リストから
Bill Williams Advanced is designed for automatic chart analysis using Bill Williams' "Profitunity" system. The indicator analyzes four timeframes at once. Manual (Be sure to read before purchasing) Advantages 1. Automatically analyzes the chart using the "Profitunity" system of Bill Williams. The found signals are placed in a table in the corner of the screen. 2. Equipped with a trend filter based on the Alligator indicator. Most of the system signals are recommended to be used only accordi
Step into the realm of Forex trading with confidence and precision using XQ, a cutting-edge Forex indicator designed to elevate your trading game to unprecedented heights. Whether you're a seasoned trader or just stepping into the world of currency exchange, XQ Forex Indicator empowers you with the insights and signals needed to make informed trading decisions. The signal conditions are a combination of three indicators, and XQ Forex Indicator only display  medium and long-term trends . The ind
これはMT5のインジケーターで、再描画なしで取引に参入するための正確なシグナルを提供します。 外国為替、暗号通貨、金属、株式、インデックスなど、あらゆる金融資産に適用できます。かなり正確な見積もりを提供し、取引を開始して終了するのに最適な時期を教えてくれます。1つのシグナルを処理しただけでインジケーターの元が取れた例の 動画 (6:22)をご覧ください。Entry PointsPro インジケーターの助けを借りたほとんどのトレーダーの最初の1週間の結果が改善しています。 Telegramグループ に登録してください。Entry Points Proインジケーターのメリットは次の通りです。 再描画のないエントリーシグナル 再描画されるインジケーターでは一度表示されたシグナルが削除されて大きな金銭的損失につながることがありますが、これと異なり、表示されて確認されたシグナルは消えることがありません。 エラーなしの取引開始 インジケーターアルゴリズムによって取引を開始する(資産を売買する)理想的な瞬間を見つけることができます。それを使用するすべてのトレーダーの成功率が向上します。
note: this indicator is for METATRADER4, if you want the version for METATRADER5 this is the link:  https://www.mql5.com/it/market/product/108106 TRENDMAESTRO ver 2.4 TRENDMAESTRO recognizes a new TREND in the bud, he never makes mistakes. The certainty of identifying a new TREND is priceless. DESCRIPTION TRENDMAESTRO identifies a new TREND in the bud, this indicator examines the volatility, volumes and momentum to identify the moment in which there is an explosion of one or more of these data a
TPSpro TRENDPRO  - is a trend indicator that automatically analyzes the market and provides information about the trend and each of its changes, as well as giving signals for entering trades without redrawing! The indicator uses each candle, analyzing them separately. referring to different impulses - up or down impulse. Exact entry points into transactions for currencies, crypto, metals, stocks, indices!  -  Version MT4               DETAILED DESCRIPTION               R ecommended to use with
ご紹介     Quantum Breakout PRO は 、ブレイクアウト ゾーンの取引方法を変革する画期的な MQL5 インジケーターです。 13年以上の取引経験を持つ経験豊富なトレーダーのチームによって開発されました。     クォンタム ブレイクアウト プロ   は、革新的でダイナミックなブレイクアウト ゾーン戦略により、あなたのトレーディングの旅を新たな高みに押し上げるように設計されています。 クォンタム ブレイクアウト インジケーターは、5 つの利益ターゲット ゾーンを備えたブレイクアウト ゾーン上のシグナル矢印と、ブレイクアウト ボックスに基づいたストップロスの提案を提供します。 初心者トレーダーにもプロのトレーダーにも適しています。 量子EAチャネル:       ここをクリック 重要!購入後、インストールマニュアルを受け取るためにプライベートメッセージを送ってください。 推奨事項: 時間枠: M15 通貨ペア: GBPJPY、EURJPY、USDJPY、NZDUSD、XAUUSD アカウントの種類: ECN、Raw、またはス
Quantum平均足PRO のご紹介 市場のトレンドに対する明確な洞察を提供するように設計された平均足キャンドルは、ノイズを除去し、誤ったシグナルを排除する能力で知られています。混乱を招く価格変動に別れを告げ、よりスムーズで信頼性の高いチャート表現を導入しましょう。 Quantum Heiken Ashi PRO を真にユニークなものにしているのは、従来のローソク足データを読みやすい色のバーに変換する革新的なフォーミュラです。赤と緑のバーはそれぞれ弱気トレンドと強気トレンドをエレガントに強調し、潜在的なエントリーポイントとエグジットポイントを驚くほど正確に見つけることができます。 量子EAチャネル:       ここをクリック MT4のバージョン:       ここをクリック この注目すべき指標には、いくつかの重要な利点があります。 明確性の向上: 価格変動を平滑化することで、平均足バーは市場トレンドをより明確に表現し、有利な取引機会を特定しやすくします。 ノイズの削減: 誤ったシグナルを引き起こすことが多い不安定な価格変動に別れを告げます。 Quantum Heik
TPA True Price Action indicator reveals the true price action of the market makers through 100% non-repainting signals strictly at the close of a candle! TPA shows entries and re-entries, every time the bulls are definitely stronger than the bears and vice versa. Not to confuse with red/green candles. The shift of power gets confirmed at the earliest stage and is ONE exit strategy of several. There are available now two free parts of the TPA User Guide for our customers. The first "The Basics"
現在33%オフ 初心者にもエキスパートトレーダーにも最適なソリューション このインジケーターは独自の機能と新しい公式を多数内蔵しており、ユニークで高品質かつ手頃な取引ツールです。このアップデートでは、2つの時間枠ゾーンを表示できるようになります。より長いTFだけでなく、チャートTFとより長いTF(ネストゾーンを表示)の両方を表示できます。すべてのSupply Demandトレーダーの皆さんのお気に召すはずです。:) 重要情報の公開 Advanced Supply Demandの可能性を最大化するには、 https://www.mql5.com/ja/blogs/post/720245 にアクセスしてください。   エントリーまたはターゲットの正確なトリガーポイントを正確に特定できれば取引がどのように改善されるか想像してみてください。新しい基盤となるアルゴリズムに基づいて構築されているため、買い手と売り手の間の潜在的な不均衡をさらに簡単に特定できます。これは、最も強い需要と供給のゾーンと、過去のパフォーマンス(古いゾーンを表示)がグラフィカルに表現されるためです。これらの機能は、最適
Gartley Hunter Multi - An indicator for searching for harmonic patterns simultaneously on dozens of trading instruments and on all possible timeframes. Manual (Be sure to read before purchasing) | Version for MT4 Advantages 1. Patterns: Gartley, Butterfly, Shark, Crab. Bat, Alternate Bat, Deep Crab, Cypher 2. Simultaneous search for patterns on dozens of trading instruments and on all possible timeframes 3. Search for patterns of all possible sizes. From the smallest to the largest 4. A
Was: $249  Now: $99   Market Profile defines a number of day types that can help the trader to determine market behaviour. A key feature is the Value Area, representing the range of price action where 70% of trading took place. Understanding the Value Area can give traders valuable insight into market direction and establish the higher odds trade. It is an excellent addition to any system you may be using. Inspired by Jim Dalton’s book “Mind Over Markets”, this indicator is designed to suit the
The Volume by Price Indicator for MetaTrader 5 features Volume Profile and Market Profile TPO (Time Price Opportunity). Volume and TPO histogram bar and line charts. Volume Footprint charts. TPO letter and block marker collapsed and split structure charts. Session filtering and grouping. Static, dynamic and flexible range segmentation and compositing methods with relative and absolute visualizations. Graphical layering, positioning and styling options to suit the user's analytic and aesthetic n
Currently Price  20% OFF  ( for unlimited use ) Indicator   USER MANUAL , trade setups, solving issues, etc :  Direct Download Here     (  for users only  ) Hello World! Introducing.. SMCpro tool and Indicator for  MetaTrader 5 , a cutting-edge feature designed to revolutionize your trading experience. With innovative ICT Smart Money Concept, you gain unparalleled insight into market dynamics, empowering you to make informed trading decisions like never before. SMC Indicator built on th
WHY IS OUR FXACCCURATE LS MT5 THE PROFITABLE ? PROTECT YOUR CAPITAL WITH RISK MANAGEMENT Gives entry, stop and target levels from time to time. It finds Trading opportunities by analyzing what the price is doing during established trends. POWERFUL INDICATOR FOR A RELIABLE STRATEGIES We have made these indicators with a lot of years of hard work. It is made at a very advanced level. Established trends provide dozens of trading opportunities, but most trend indicators completely ignore them!
トレンドトレーディング は、タイミングのプルバックとブレイクアウトにより、市場で起こっているトレンドから可能な限り利益を得るように設計された指標です。確立されたトレンドの中で価格が何をしているかを分析することにより、取引の機会を見つけます。 [ インストールガイド | 更新ガイド | トラブルシューティング | よくある質問 | すべての製品 ] 自信を持って効率的に金融市場を取引する むち打ちにならずに確立されたトレンドから利益を得る 収益性の高いプルバック、ブレイクアウト、早期の逆転を認識する この指標は、独自の品質とパフォーマンスを分析します 複数時間枠のダッシュボードを実装します インジケーターは再描画されていません 電子メール/音声/視覚アラートを実装します 確立されたトレンドは多くの取引機会を提供しますが、ほとんどのトレンド指標はそれらを完全に無視しています。インジケーターの解釈はかなり簡単です: (1) トレンドの変化 (2) トレンドの方向への後退 (3) トレンドの方向へのブレイクアウト 赤いダッシュ は下降トレンド中の修正です 青いダッシュ は上昇ト
発見が困難で頻度が少ないため、分岐は最も信頼できる取引シナリオの1つです。このインジケーターは、お気に入りのオシレーターを使用して、通常の隠れた分岐点を自動的に見つけてスキャンします。 [ インストールガイド | 更新ガイド | トラブルシューティング | よくある質問 | すべての製品 ] 取引が簡単 通常の隠れた発散を見つけます 多くのよく知られている発振器をサポート ブレイクアウトに基づいて取引シグナルを実装します 適切なストップロスおよび利益レベルを表示します 設定可能なオシレーターパラメーター カスタマイズ可能な色とサイズ バー単位でサイズ別に分岐をフィルタリング パフォーマンス統計を実装します 電子メール/音声/視覚アラートを実装します 幅広い市場の見通しを提供するために、異なるオシレーターを使用して、干渉なしで同じチャートにインジケーターを何度もロードできます。このインジケーターは、次のオシレーターをサポートしています。 RSI CCI MACD オスマ 確率的 勢い 素晴らしい発振器 加速器発振器 ウィリアムズパーセントレンジ 相対活力指数 特に外国為替市
Golden Spikes Detector This indicator is based on an advanced strategy primarily for trading spikes on Boom and Crash Indices. Complex algorithms were implemented to detect high probability entries only. It alerts on potential Buy and Sell entries. To trade spikes on the Deriv or Binary broker, only take Buy Boom and Sell Cash alerts. It was optimised to be loaded on 5-minute timeframe although multiple timeframe analysis is done in the background. Features ·             Desktop pop up and sound
このインジケータは、30を超える日本のローソク足パターンを認識し、チャート上でそれらを美しく強調します。それは、価格行動トレーダーがなしでは生きていけない指標の1つにすぎません。 一晩でテクニカル分析を強化 日本のローソク足パターンを簡単に検出 信頼できる普遍的な反転パターンを取引する 継続パターンを使用して、確立されたトレンドに安全に飛び乗る インジケーターは再描画されず、アラートを実装します インジケーターは、マルチタイムフレーム ダッシュボードを 実装します チャートが非常に多くのパターンを検出するため、チャートが非常に乱雑に見え、読みにくくなります。トレーダーは、チャートをより読みやすくするために、インディケーター入力から望ましくないパターンを無効にする必要があるかもしれません。 1小節、2小節、3小節、および多小節のパターンを検出します 反転、継続、および脆弱性のパターンを検出します パターンは有効または無効にできます 強気のパターンは 青 、弱気のパターンは 赤 、中立のパターンは 灰色で ラベル付けされてい ます 。 検出されたローソク足パターンのリスト 1バーから
Was: $299  Now: $99   Supply Demand uses previous price action to identify potential imbalances between buyers and sellers. The key is to identify the better odds zones, not just the untouched ones. Blahtech Supply Demand indicator delivers functionality previously unavailable on any trading platform. This 4-in-1 indicator not only highlights the higher probability zones using a multi-criteria strength engine, but also combines it with multi-timeframe trend analysis, previously confirmed swings
Divergence and Convergence are important harbingers of reversals in stock markets. The Divergence Sync indicator is designed to automatically search for divergences on a large number of indicators with different parameters. The search for divergences is carried out on these indicators: (CCI, CHO, DeMarker, MACD, MFI, Momentum, OBV, OsMA, RSI, Stochastic, WPR,   Awesome Oscillator ). To search for divergences, you can use one technical indicator or search simultaneously on any number of ind
IVISTscalp5
Vadym Zhukovskyi
5 (5)
iVISTscalp5インジケーターをご紹介します。このインジケーターは、トレーディングにおいて独自でありながら効果的です。時間データに基づくこのインジケーターは、多年にわたる経験と金融市場の深い分析の結果です。iVISTscalp5インジケーターは、手動トレーディングにとって優れたツールです。便利さ、簡単さ、可視化 - すべての複雑さが内部に隠されています。私たちは、iVISTscalp5インジケーターの設定と使用を最大限に簡素化しました。このインジケーターは、MT5ターミナルにあるすべての金融商品に適しています。 稼働時間は、4時から20時(UTC+3)です。 iVISTscalp5インジケーターメニュー(スクリーンショット1を参照): History - 引用を計算する週数 dT_min - 時間間隔の選択(分) TFline - 水平ボリュームの作成(時間枠) BARSline - 水平ボリュームの作成(バー数) TFtrend1 - デイリーチャンネルの作成(時間枠) BARStrend1 - デイリーチャンネルの作成(バー数) TFtrend2 - 週次チャンネルの作成(時
This indicator can be used to display Support and Resistance levels according to  the  Malaysian SNR concept , in which Support and Resistance are exact levels of a line chart. Malaysian SNR There are 3 different horizontal levels in Malaysian SNR: A-Level : This level is located at the peak of this line chart. (shape looks like the letter A) V-Level : Level at the valley of a line chart, (shape looks like the letter V) Gap-Leve l: This level is located at the Close/Open gap between two cand
このダッシュボードは、選択されたシンボルの最新の利用可能なハーモニックパターンを表示するので、時間を節約し、より効率的に /   MT4バージョン 。 無料インジケーター:   Basic Harmonic Pattern インジケーター列 Symbol : 選択したシンボルが表示されます。 Trend :   強気または弱気 Pattern : パターンの種類(ガートレー、バタフライ、バット、カニ、サメ、サイファー、ABCD) Entry : エントリー価格 SL: ストップロス価格 TP1: 1回目の利食い価格 TP2: 2回目の利食い価格 TP3:   3回目の利食い価格 Current price :   現在値 Age (in bars):    最後に描画されたパターンの年齢 主な入力項目 Symbols:   "28 Major Currency Pairs "または "Selected Symbols "から選択。 Selected Symbols:   カンマで区切られた監視したいシンボル("EURUSD,GBPUSD,XAUUSD")。ブローカーが
作者のその他のプロダクト
Volatility Index Pro Indicator The Savia Forex Solutions Volatility Index Pro Indicator gives you highly accurate entries on all Volatility Indices and Jump Indices. The Volatility Index Pro Indicator is dynamic and powerful and is optimized for all timeframes. Trade with improved confidence and maximize your success rate. Benefits Dynamic and Powerful. Volatility Index Pro Indicator is fully optimized for all chart timeframes. Volatility Index Pro Indicator works with Volatility Indices and Jum
Fibonacci Magic Pivot Levels The  Fibonacci Magic Pivot Levels  is a  powerful yet easy to use indicator . It   continuously monitor s intra-day  price action  and uses complex algorithms to calculate and detect key support, resistance and pivot levels, using the D1 timeframe as a filter.  The    Fibonacci Magic Pivot Levels is optimized for H4, H1, M30, M15, M5 & M1 timeframes and  can be used on ALL Currencies, Indices, Commodities, and Cryptocurrency pairs . Trade with improved confidence an
Fibonacci Retracements Pro The Fibonacci Retracements Pro is a powerful yet easy to use indicator. It automatically plots all the important Fibonacci retracement and extension levels for you. FRP is dynamic powerful and seamlessly adjusts to whatever timeframe you are analyzing. Fibonacci Retracement Pro is optimized for ALL timeframes and ALL Currency pairs, Indices, Commodities, and Cryptocurrency pairs. Trade with improved confidence and maximize your success rate. Benefits Dynamic and Power
Savia Forex Pro Indicator
Savia Forex Software Solutions
Savia Forex Pro Indicator The Savia Forex Solutions Forex Pro Indicator gives you highly accurate entries on all Forex/Currency pairs, Indices and Cryptocurrencies. The Forex Pro Indicator is dynamic and powerful and is optimized for all timeframes and ALL Currency pairs, Indices, Commodities, and Cryptocurrency pairs. Trade with improved confidence and maximize your success rate. Benefits Dynamic and Powerful. Forex Pro Indicator is fully optimized for all chart timeframes. Forex Pro Indicator
Savia Forex Pro Indicator (MT5) The Savia Forex Solutions Forex Pro Indicator gives you highly accurate entries on all Forex/Currency pairs, Indices and Cryptocurrencies. The Forex Pro Indicator is dynamic and powerful and is optimized for all timeframes and ALL Currency pairs, Indices, Commodities, and Cryptocurrency pairs. Trade with improved confidence and maximize your success rate. Benefits Dynamic and Powerful. Forex Pro Indicator is fully optimized for all chart timeframes. Forex Pro Indi
フィルタ:
レビューなし
レビューに返信