PowerZones Premium MT5
- インディケータ
- Christophe Pa Trouillas
- バージョン: 2.0
- アップデート済み: 19 7月 2024
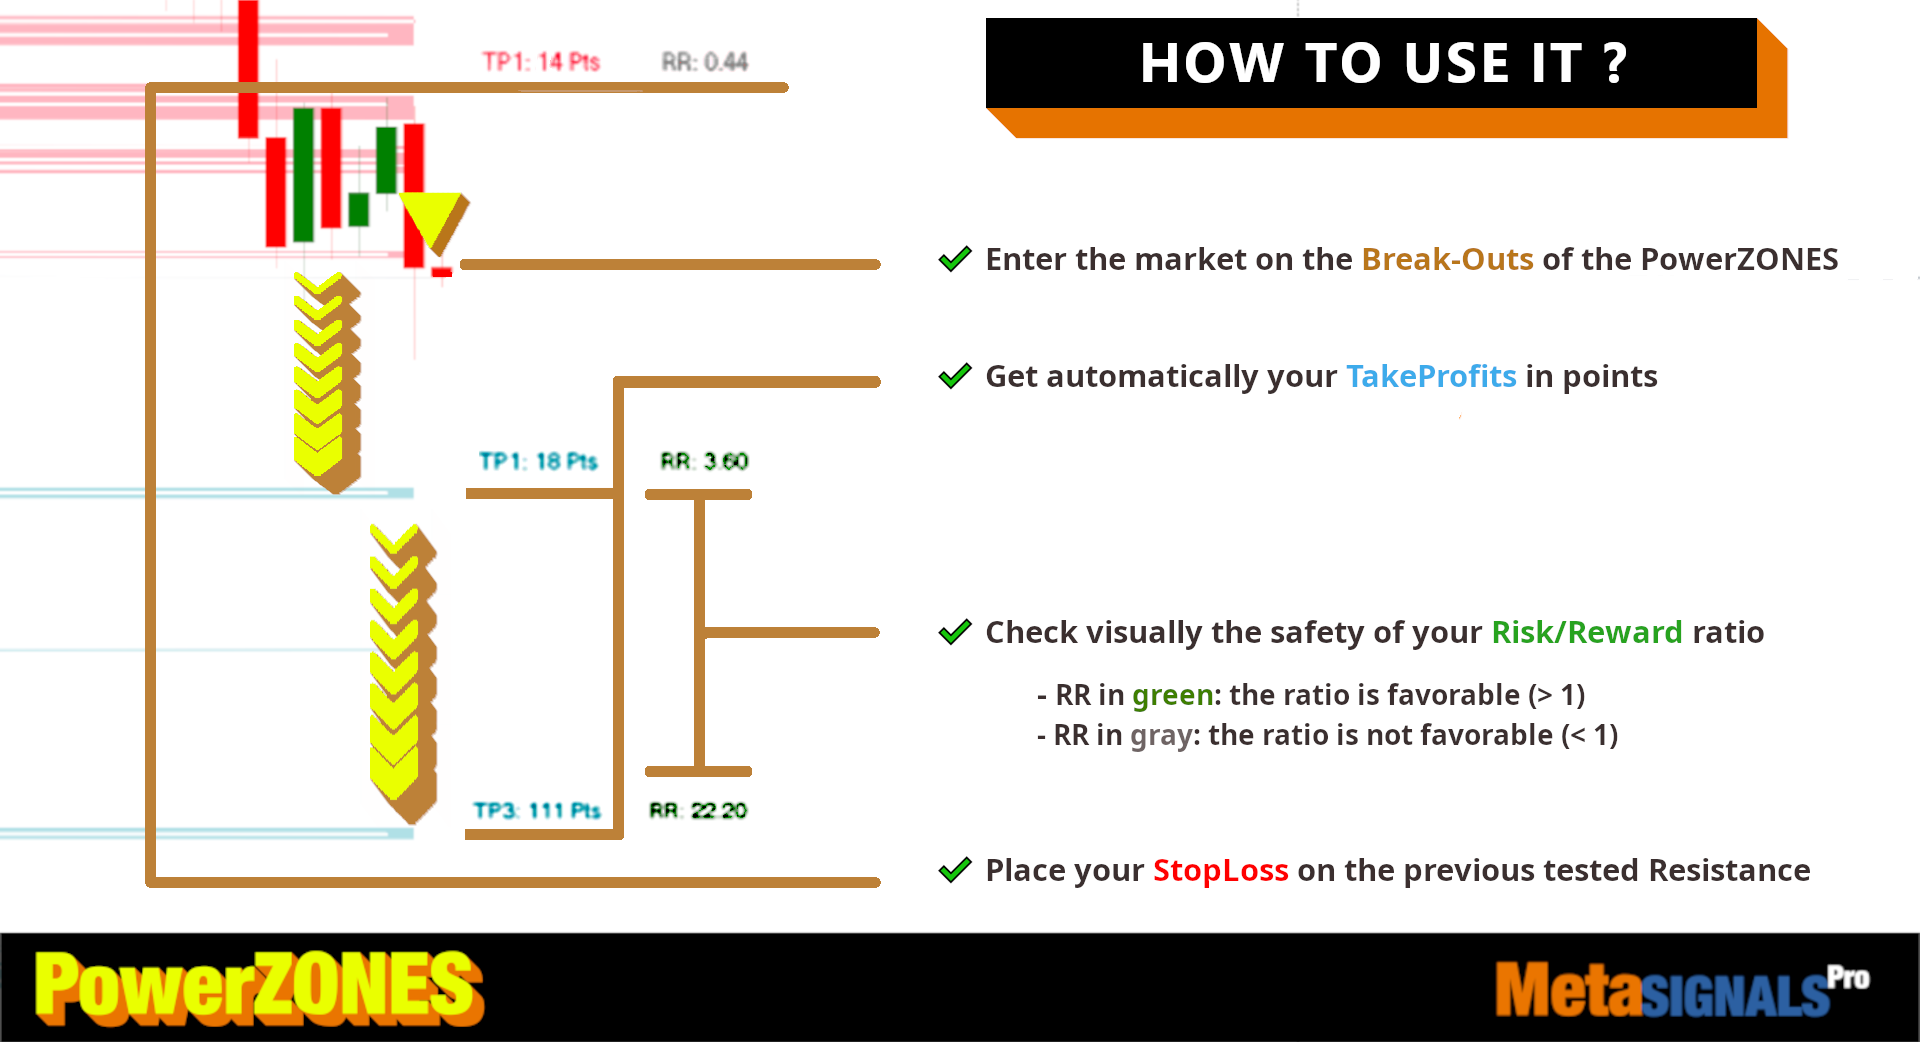
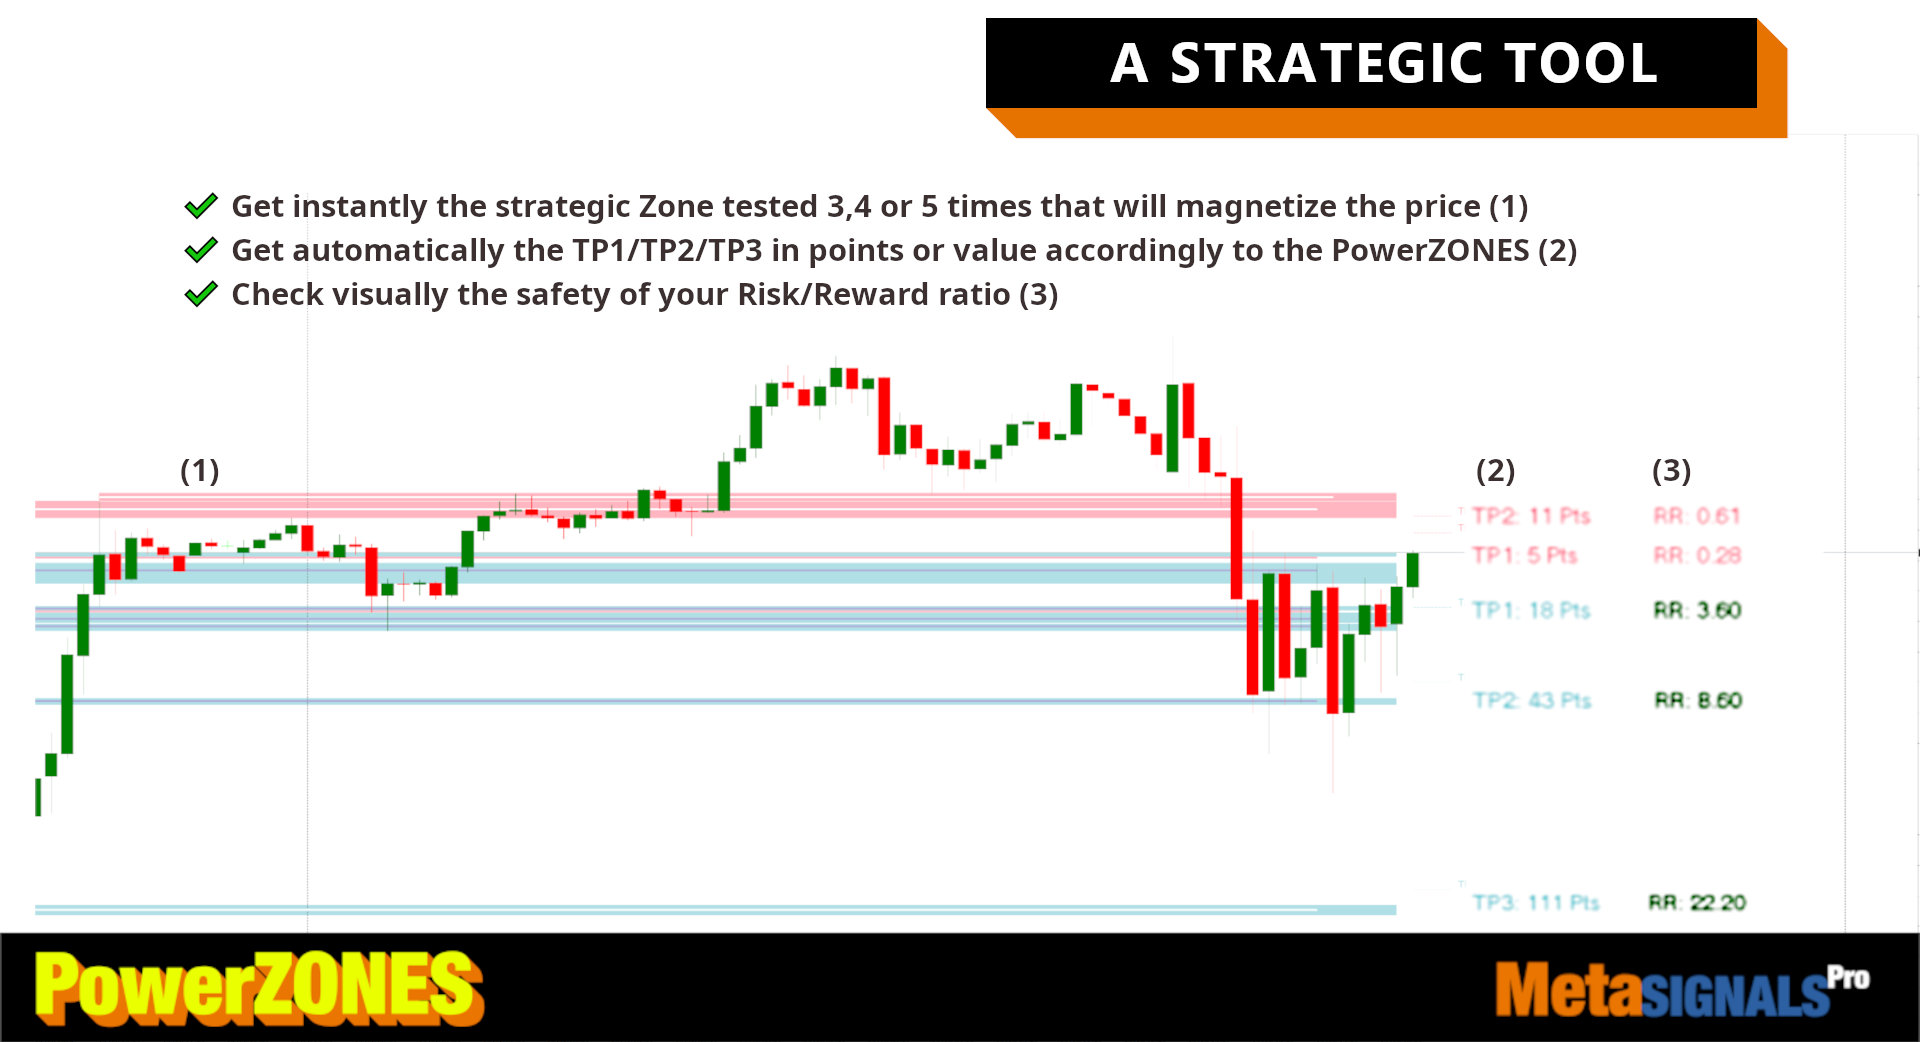
3,4,5回タッチされた戦略ゾーンを即座に取得し、価格を磁化します。>> パワーゾーンに応じたTP1/TP2/TP3のポイントまたはバリューを自動的に取得します。>> リスクとリワードの比率の安全性を視覚的にチェックします。
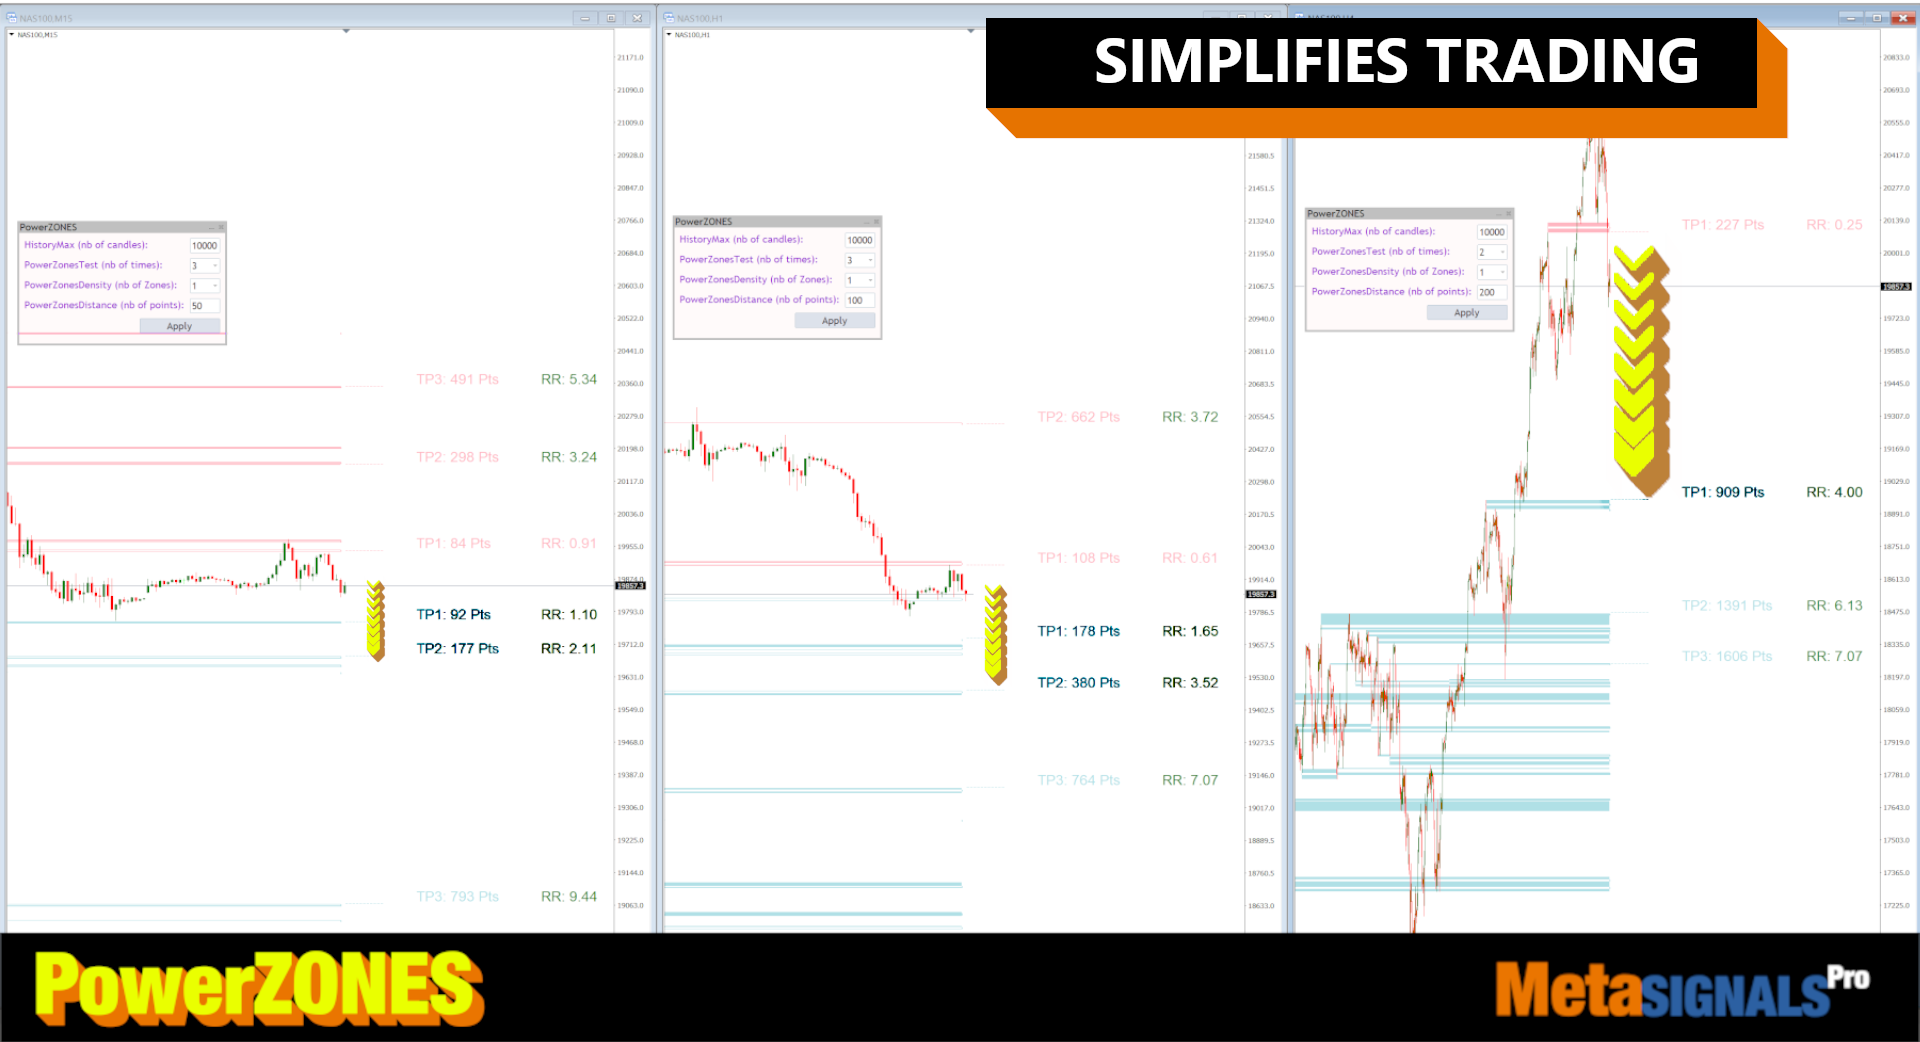
非リペイント、非遅延インディケータ - マニュアルおよび自動売買に最適 - すべての資産、すべての時間単位に対応
期間限定キャンペーン - その後 99ドルに戻る
主な特徴
- ダイナミックパワーゾーン: 本当に強いサポートとレジスタンスレベルを瞬時に視覚化し、正確なエントリー、ストップロス、TP1/2/3を可能にします。
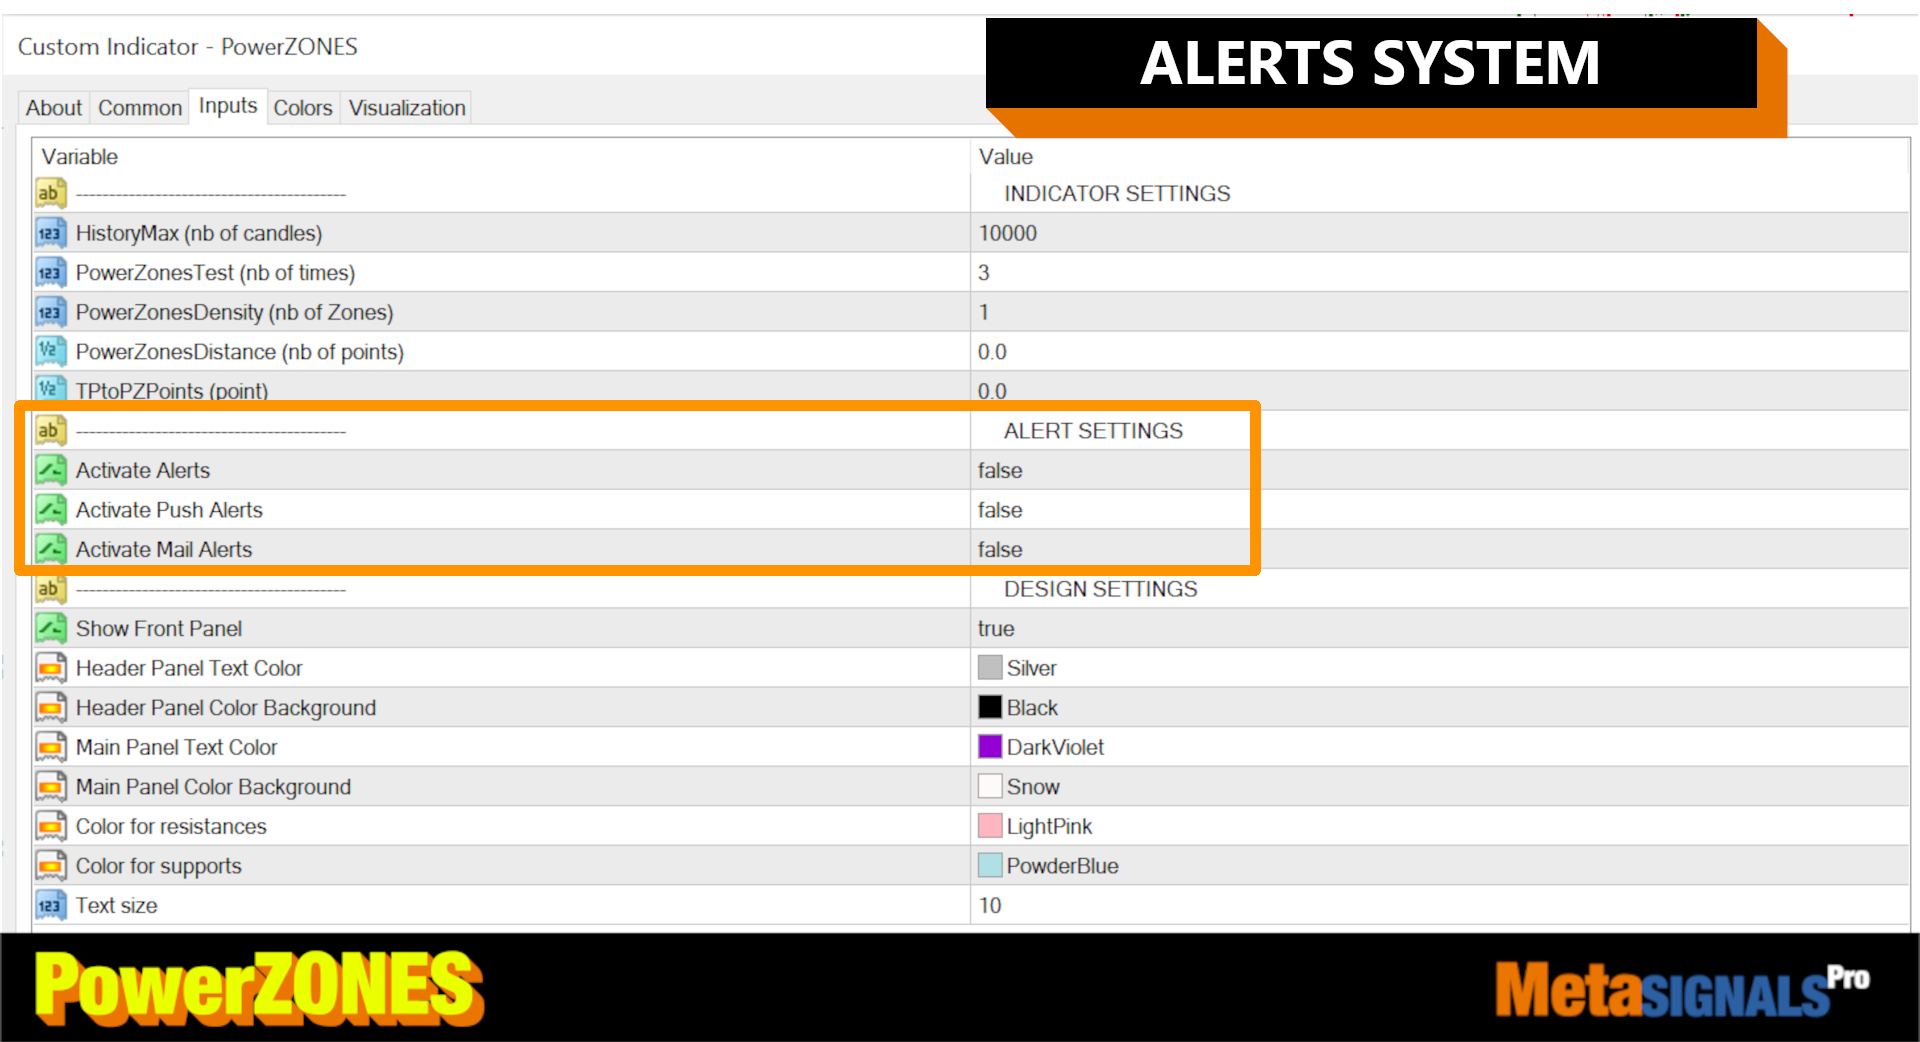
- カスタマイズ可能なアラート: ブレイクアウトイベントのカスタマイズ可能なアラートで、潜在的な取引機会をお知らせします。
- マルチタイムフレーム分析: 異なるタイムフレームをシームレスに切り替えて、市場トレンドとプライスアクションを包括的に把握できます。
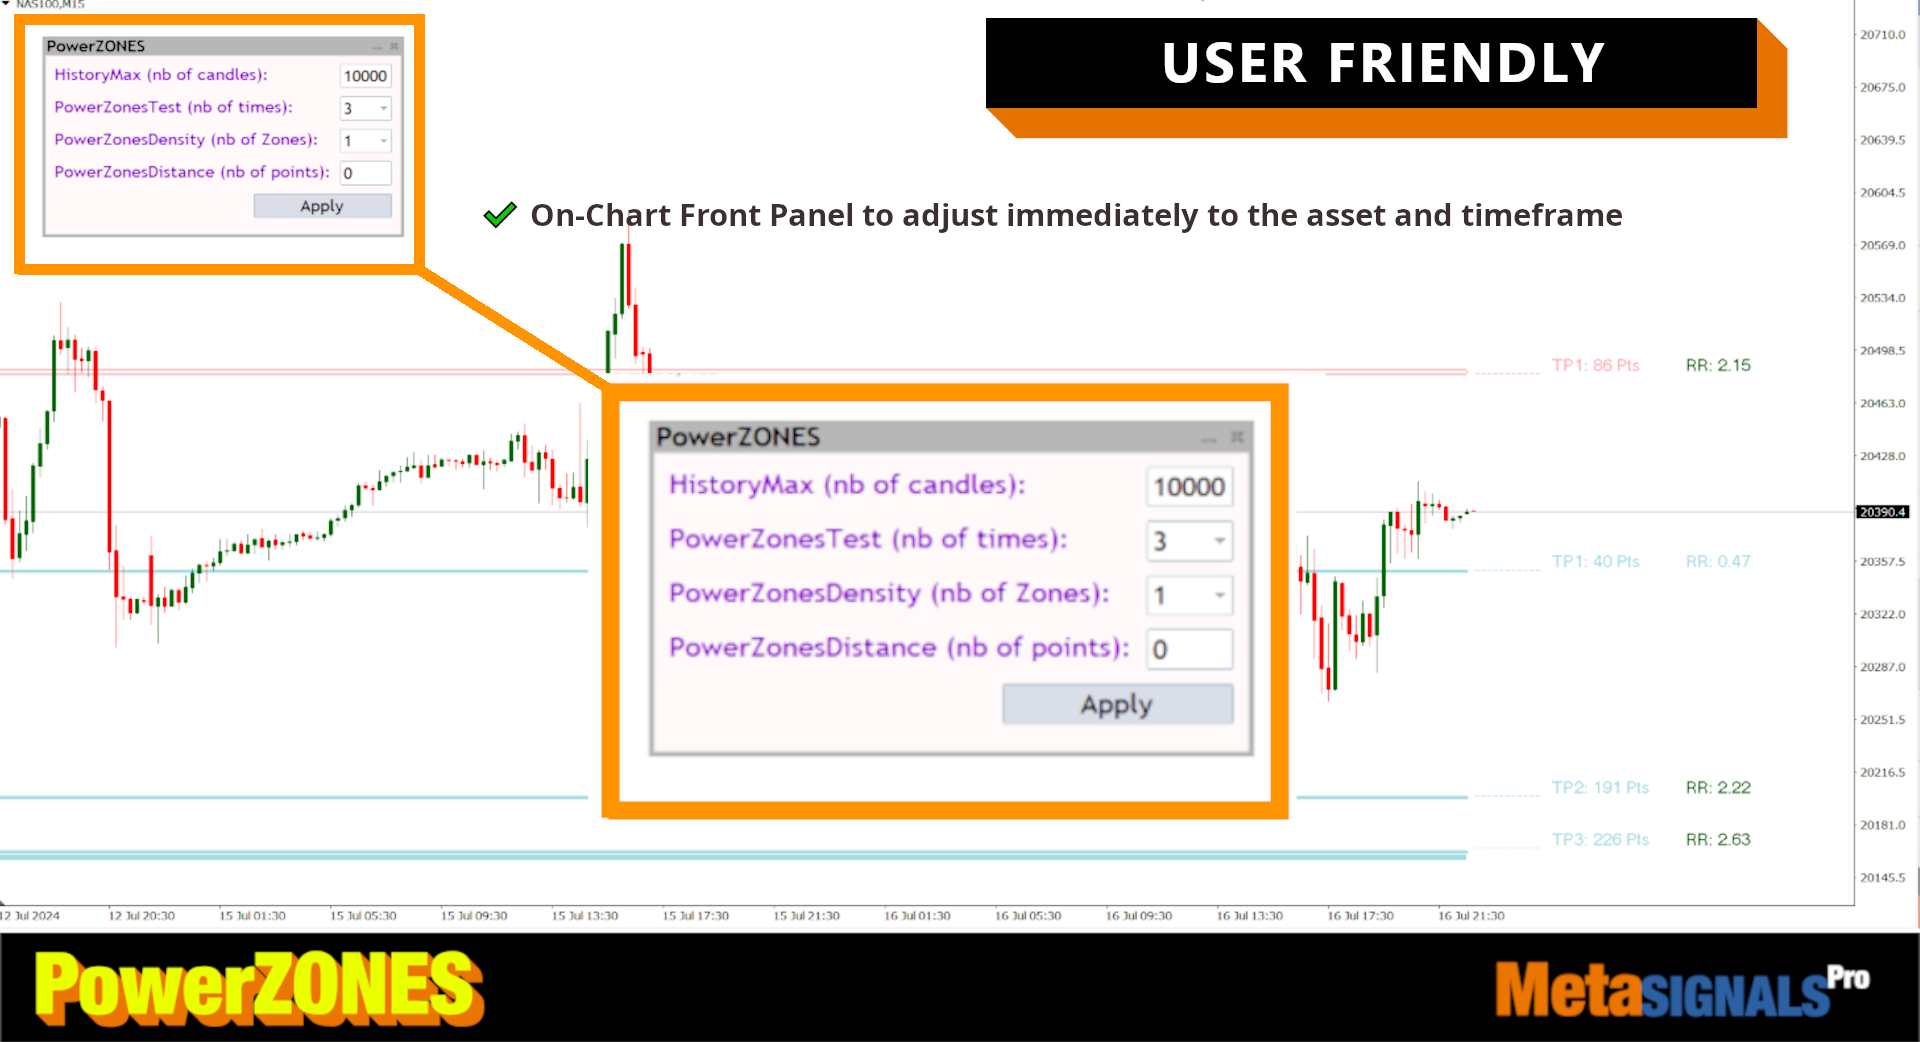
- ユーザーフレンドリーなインターフェース: 直感的なデザインにより、PowerZONESは初心者にも経験豊富なトレーダーにも使いやすくなっています。
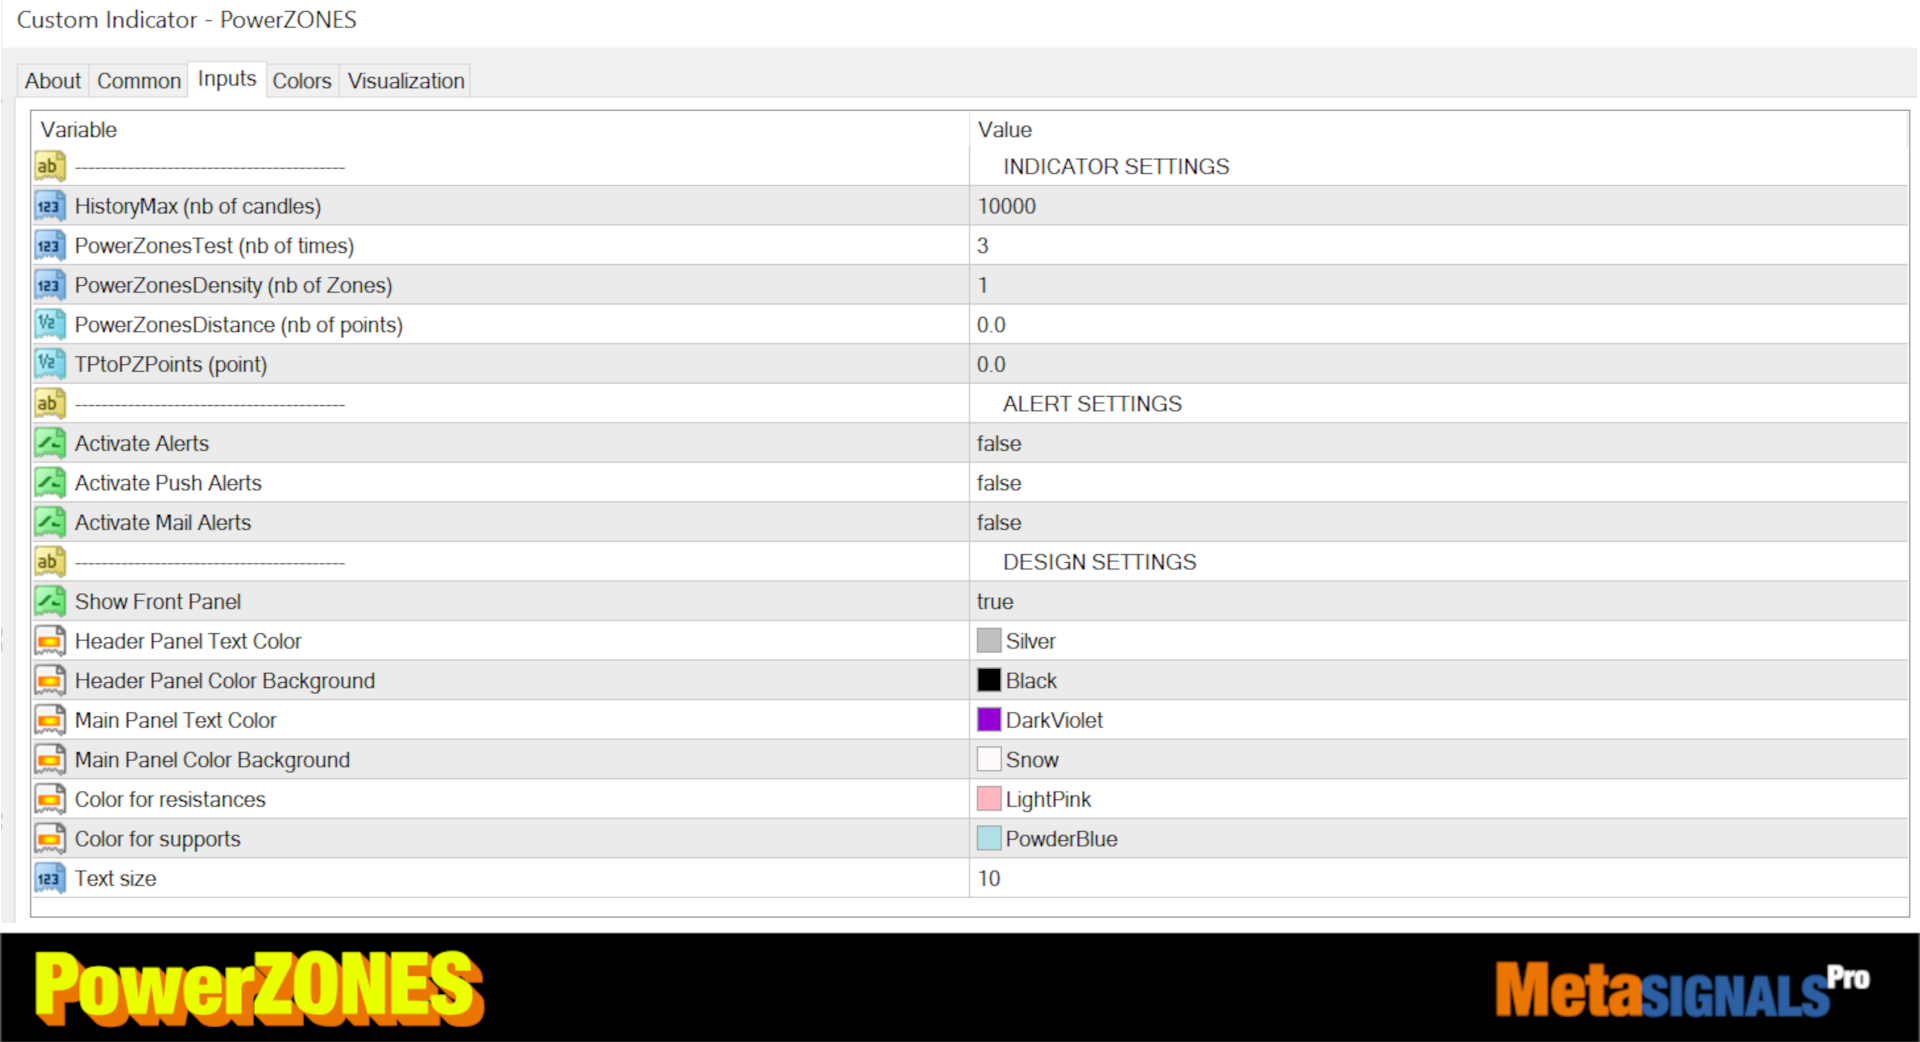
- 柔軟な設定: カスタマイズ可能なパラメータと調整可能な設定により、PowerZONESをあなたの取引スタイルに合わせて調整することができます。
なぜ優れているのか?
新しい機能を追加することにより、基本的なサポートとレジスタンスのコンセプトを革新しました:
- ゾーン: ラインよりも実際の取引に対応します。
- 強さ: 過去に何回サポート/レジスタンスにタッチされたかというシンプルなオプションを提供します。
- ゾーンの密度: 2つのゾーン間の距離を設定します。
- ゾーンは価格との位置関係によって色が変わります: 価格が下の場合、ゾーンの色が赤に変わり、価格が上の場合、ゾーンの色が青に変わります。
このインディケータは、初めてチャート上で3つの概念を視覚的に結びつけました:
- 市場がテストするゾーン
- テイクプロフィット・レベル
- サポートゾーン(ストップロス用)とレジスタンスゾーン(テイクプロフィット用)の間のリスクリワードレシオ
PowerZONESはあなたの取引ルーチンを変え、衝動的な取引を止めるのに役立ちます。
当社の製品BladeSCALPERにはPowerZONESインジケーターが含まれていますが、TPオプションは含まれていませんのでご注意ください。


He is a Good Man, buy all his products