BladeScalper Premium MT5
- インディケータ
- Christophe Pa Trouillas
- バージョン: 1.0
- アクティベーション: 5
次の反転のシグナルを受け取る | ゲインレートの統計を最適化する | 価格がテストするゾーンを取得する。 |
非リペイント、非遅延インディケータ - マニュアルおよび自動売買に最適 - すべての資産、すべての時間単位に対応
切って走れ!
BladeSCALPERを使えば、これらの予測可能なM&Wの動きのほんの一部を切り取ることができるのです!
お気に入りのアセットに繋いで、利益を上げて、群衆から逃げましょう。
何のことでしょう?
最も予測しやすいパターンとして、「ダブルトップ」と「ダブルボトム」が挙げられ、文字がこれらのパターンを明示することから、一般的に「M」と「W」と呼ばれています。
BladeSCALPERは、スキャルピングをシンプルかつ簡単にするための革新的な技術を凝縮しています。
- ScalpUP / ScalpDOWN Signal で、あなたは次の可能性のある動きの明確なシグナルを得ることができます。
- PowerZONESを使用すると、価格が引き寄せられるであろうゾーンを即座に把握することができます。
- RewardBOXの場合 - PowerZONESに応じてTP1/TP2/TP3を調整します。
- StatsPANELで-M&Wパターンの時間帯別勝率を確認する。
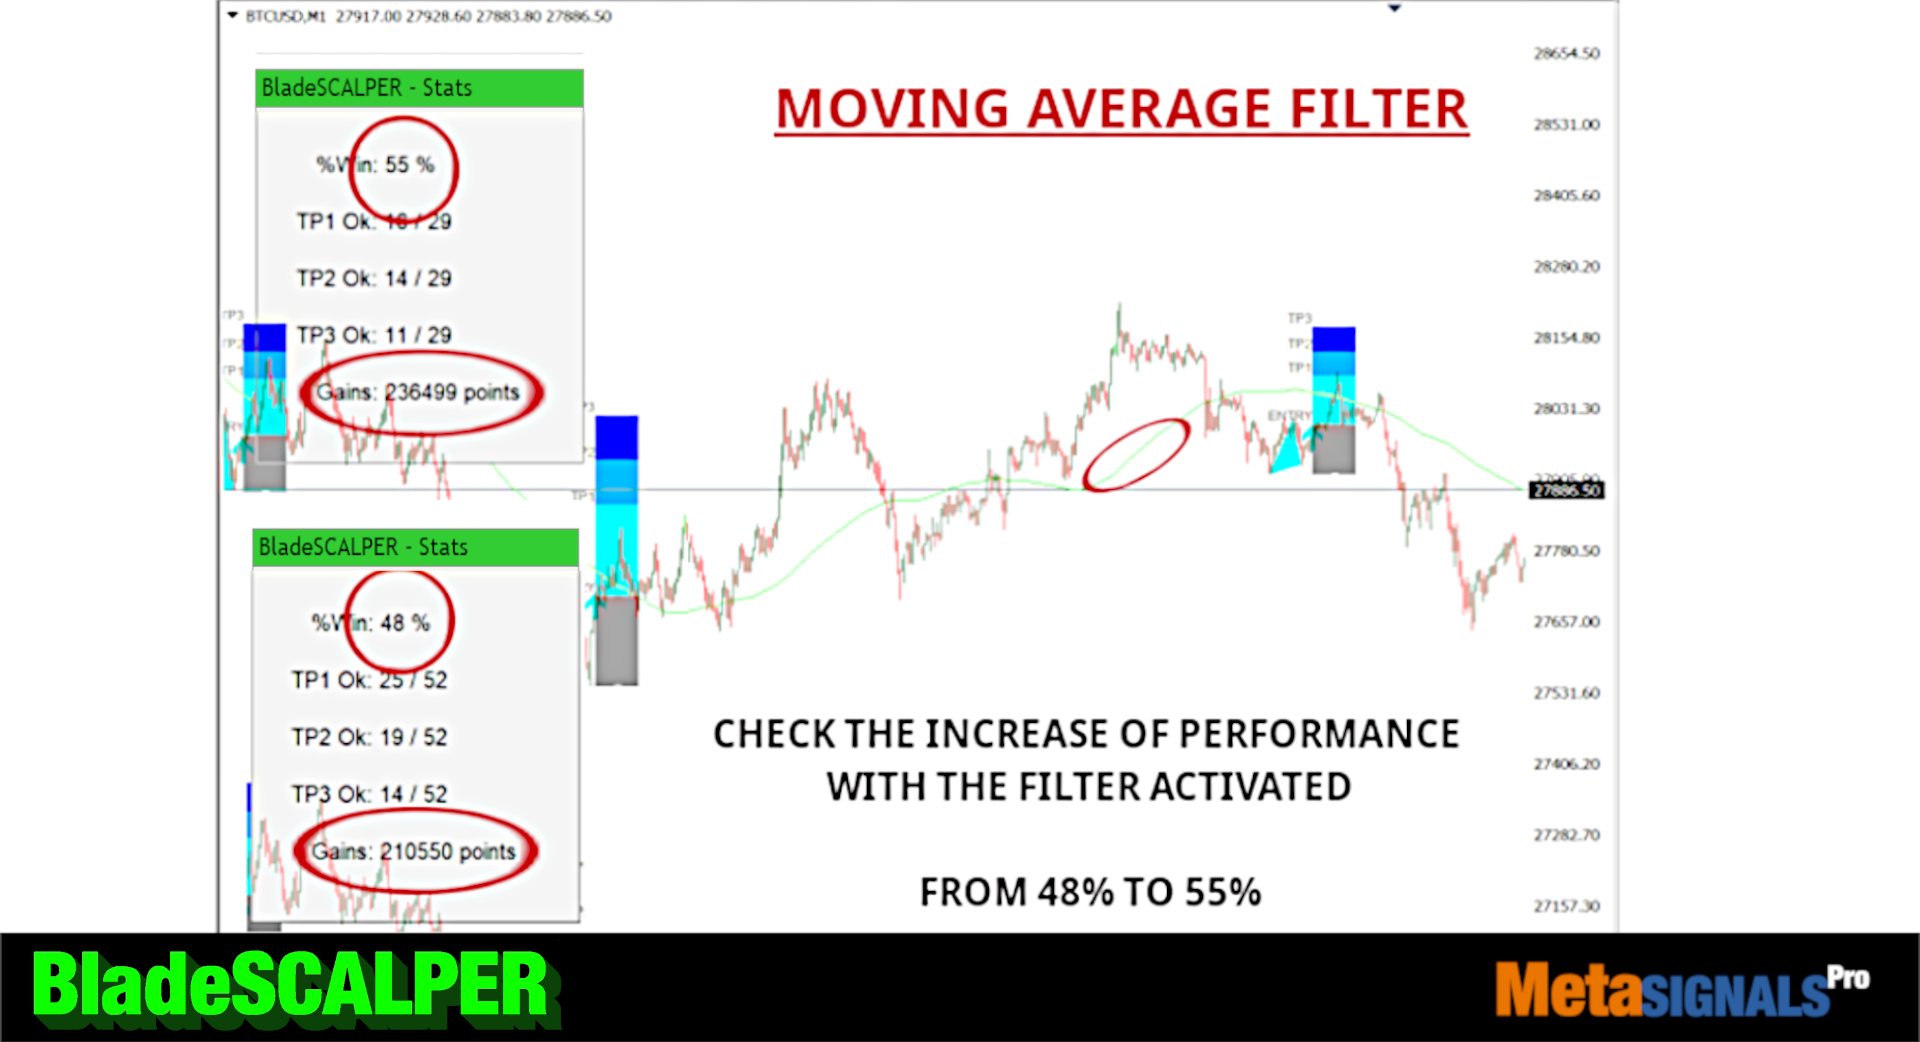
- MovingAverageFILTERで、M&Wパターンの成功確率を最適化する。
なぜ私たちはこのようなイノベーションを行ったのでしょうか?
それは、トレーダーとして、非常にシャープなスキャルピングと、テイクプロフィットやサポート&レジスタンス、すなわちパワーゾーンを視覚的にマッチさせる革新的なツールを、すべてひとつにする必要があったからです;
誰のため?
スキャルピングは、大きな動きよりも小さな動きの方が予測しやすいとされ、この操作を何度も繰り返すことが基本となります;
しかし、このインジケータをより大きな時間枠で使用し、M&Wが欲しいときにトレードすることも可能です!
ですから、基本的にBladeScalperは、時間枠や資産を問わず、M&Wパターンを成功させるトレードをしたい人のためのものなのです!
どの資産で?
BladeSCALPERとそのスクリーナーは、あらゆる資産とあらゆる時間枠で問題なく機能するユニバーサルなものです;
BladeSCALPERの仕組みと取引方法は?
スキャルプアップ/スキャルプダウンシグナル。
MとWのパターンを確認するとリアルタイムで信号を出し、塗り直しはしない。
スカルパップダウンシンガーズブレード SCALPER
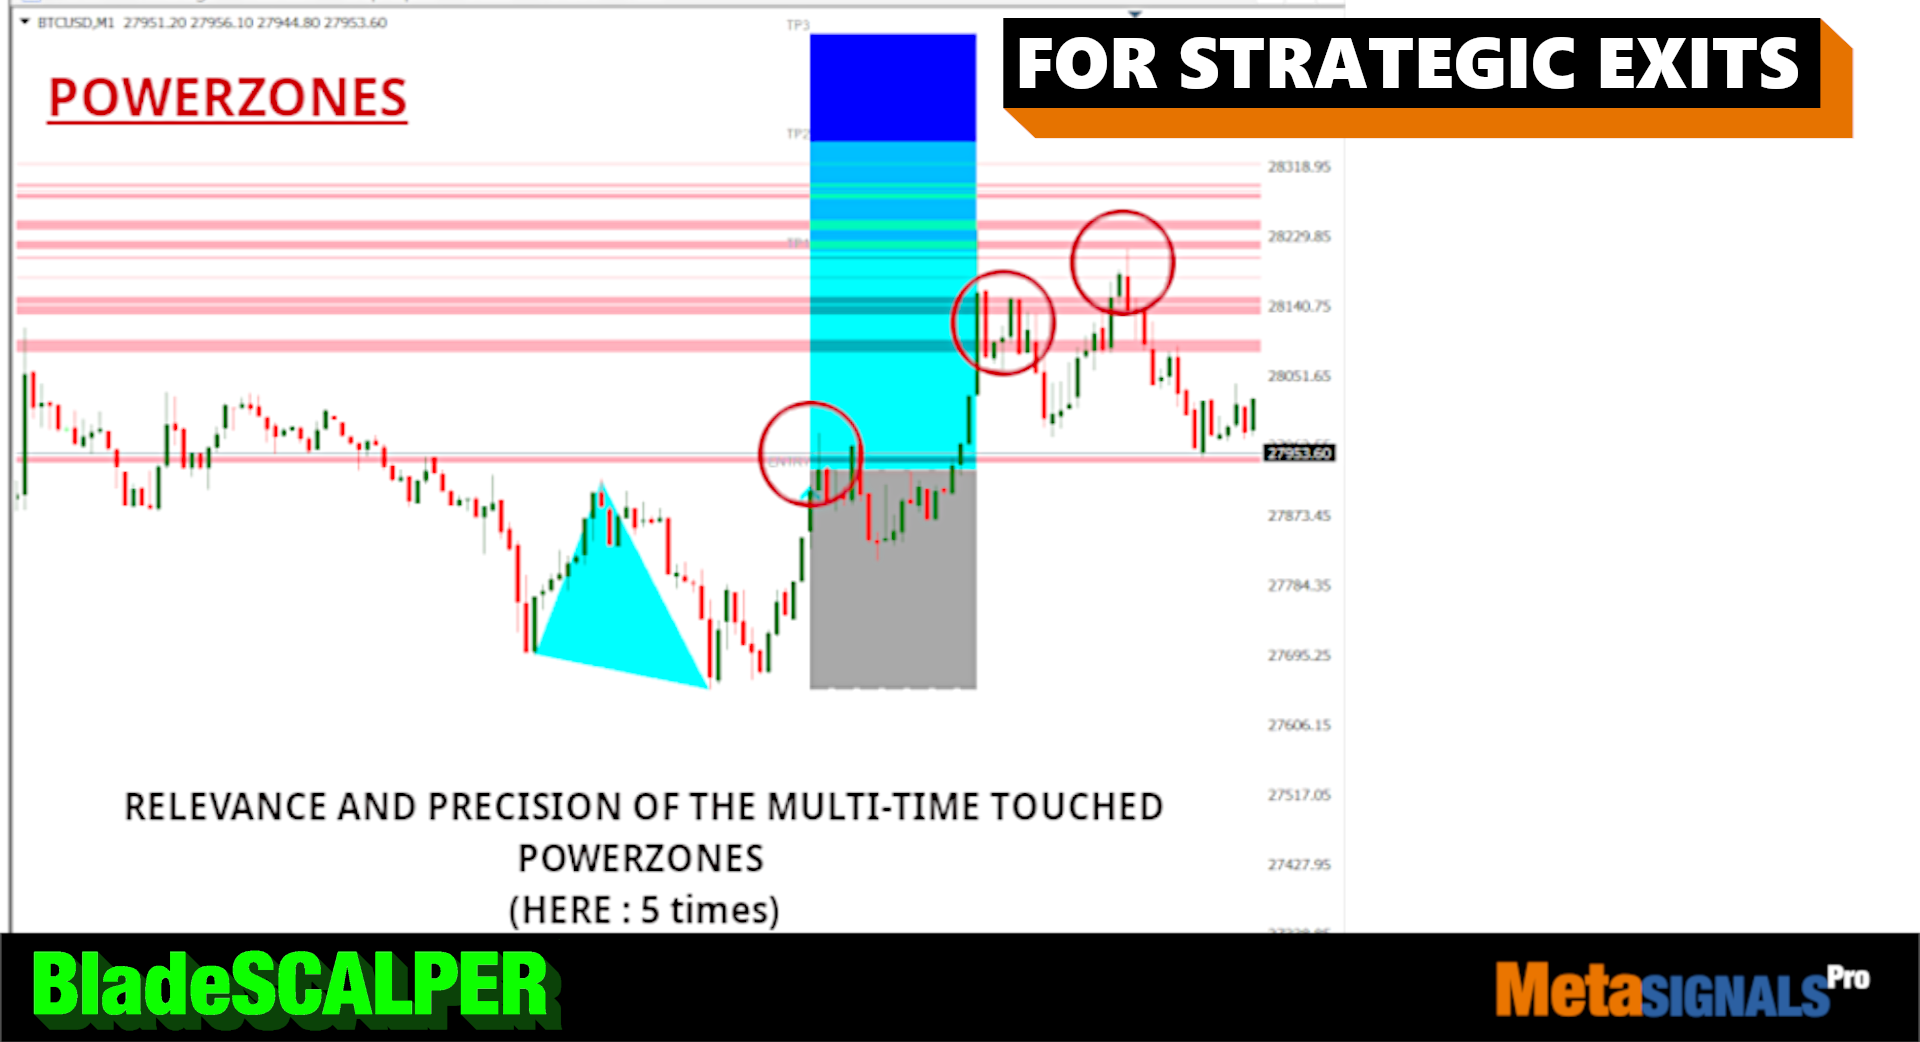
PowerZONES(パワーゾネス
基本的な「サポート」と「レジスタンス」の概念を刷新し、「サポート」と「レジスタンス」の新機能を追加しました:
- ラインよりも現実の取引に近いゾーン
- 強さ(サポート/レジスタンスが過去に何回タッチされたか)
- と、これらのゾーンの間の距離
- 最後の2つは、自分の好きな時間軸に合わせてカスタマイズできる。
- そして最後に、便宜上、ゾーンは価格に対する位置によって色を変えます:価格が下にある場合は赤く、上にある場合は青くなります。
TP1/TP2/TP3
PowerZONESで視覚的に調整し、それに応じてテイクプロフィットを設定するために、トレーダーにとって重要なこれらのマークをインジケーター自体に表示させました。
市場は、このような数字を検証する前に、ボトムとトップをテストすることがよくあることに注意してください;
このパターンに飛びつかず、お好きな時間枠でエントリーの上/下を通過するのを待つのが賢明です。
ブイワップ
特定されたM&Wの順序に基づく独自の計算式で、価格がVWAPの上/下に交差することでパターンが市場によって無効化されるかどうかを非常に早期に確認します。
Wパターンが成立した場合、VWAPの上で推移するScalpUPの動きとなる
Mパターンが成立した場合、ScalpDOWNの動きでVWAPの下に留まることになる
ブレード スカルパー VWAP
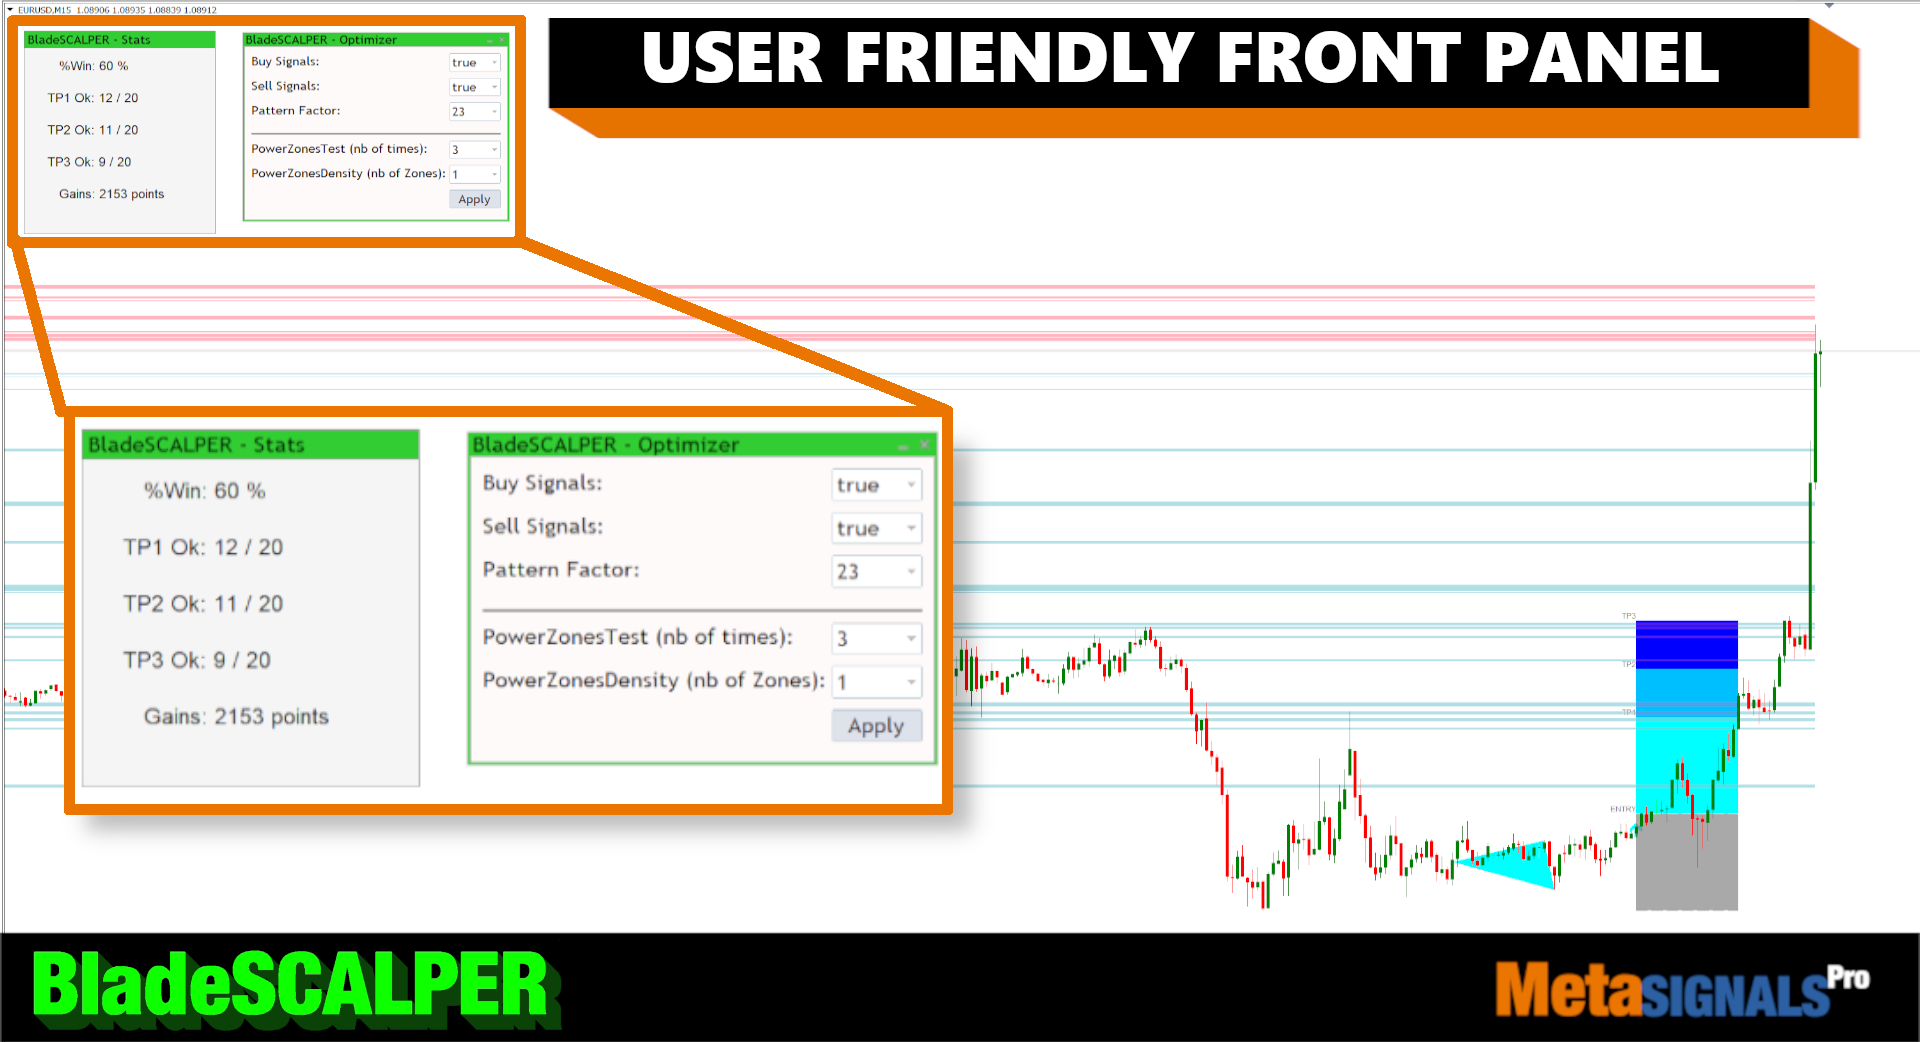
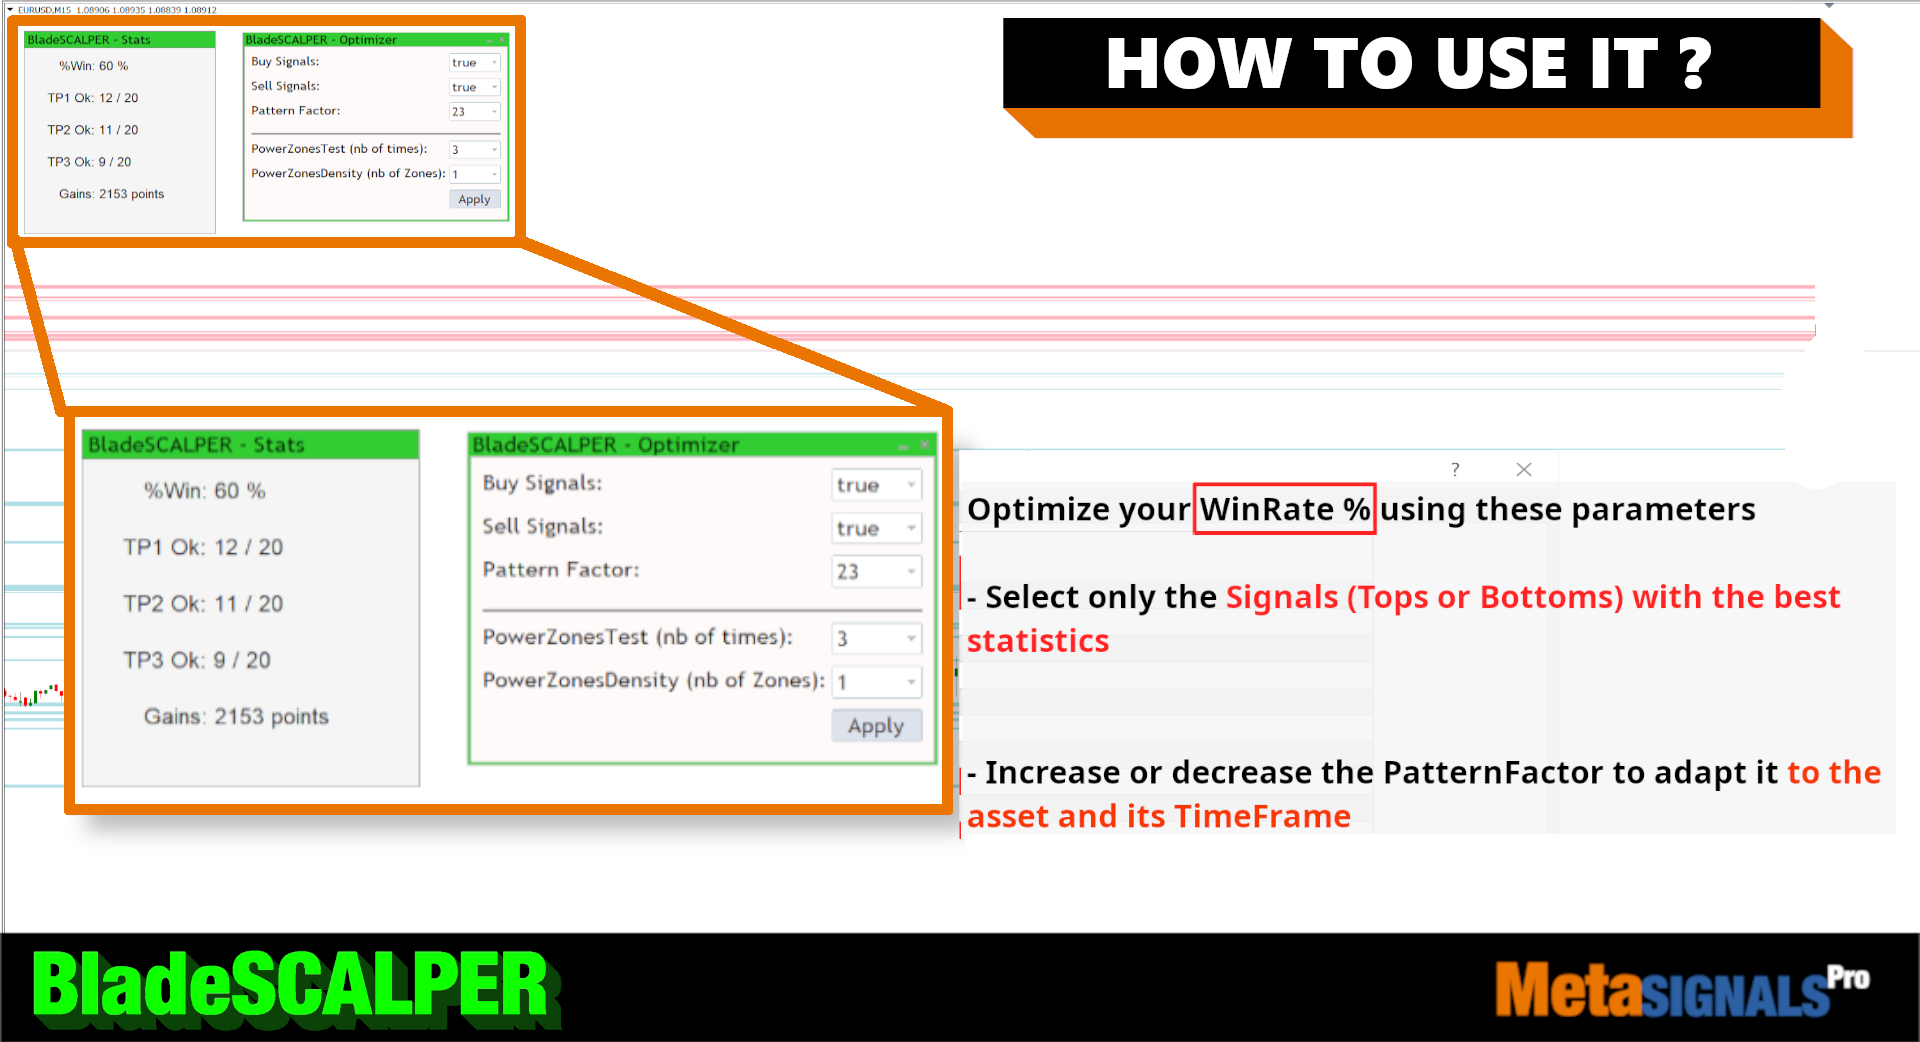
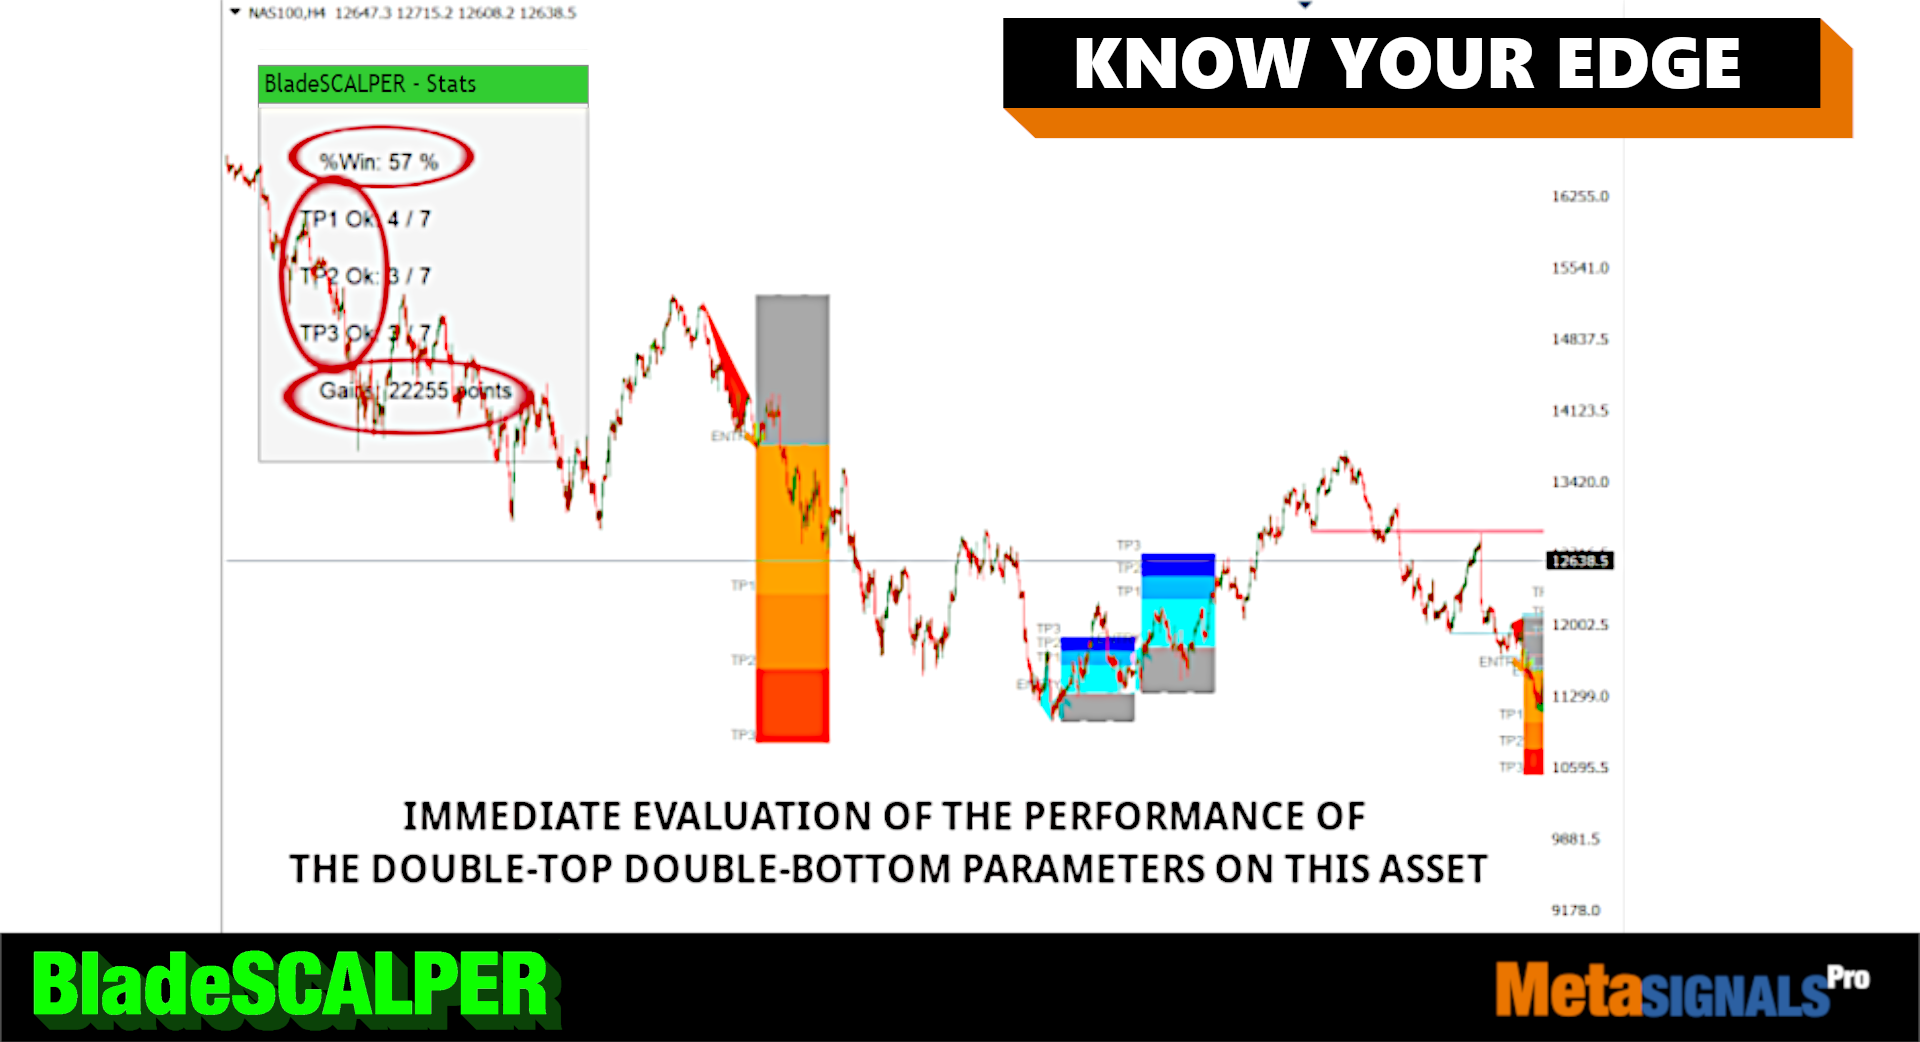
StatsPANEL
この画期的な機能により、すぐに確認することができるようになりました。
過去形
TP1/TP2/TP3に到達したトレードの正確な数。
そして何より、これらのトレードによって得られた利益
さらに、ブレードスキャルパーの精度と信頼性を向上させるための2つの重要な可能性を紹介します。
パターンファクター(PatternFACTOR)を変更することができます。
MoveringAverageFILTERを有効にすると、以下のようになります。
価格が選択したMovingAverageを下回る場合、Mパターンを抑制する。
選択したMovingAverageを超えたときに、Wパターンを抑制する。
これらの変数を変更すると、TP1/TP2/TP3およびHistoryMax変数の位置と同様に、統計が直ちに変更されます。
フィルタを使用しない場合の統計情報
フィルターありの統計
マニュアル注文を自動化し、快適にお取引いただくために、トレード・マネージャーもご覧ください;
コントロールパネル・トレードマネージャー
---------------------------------------------------------------------------------------------------
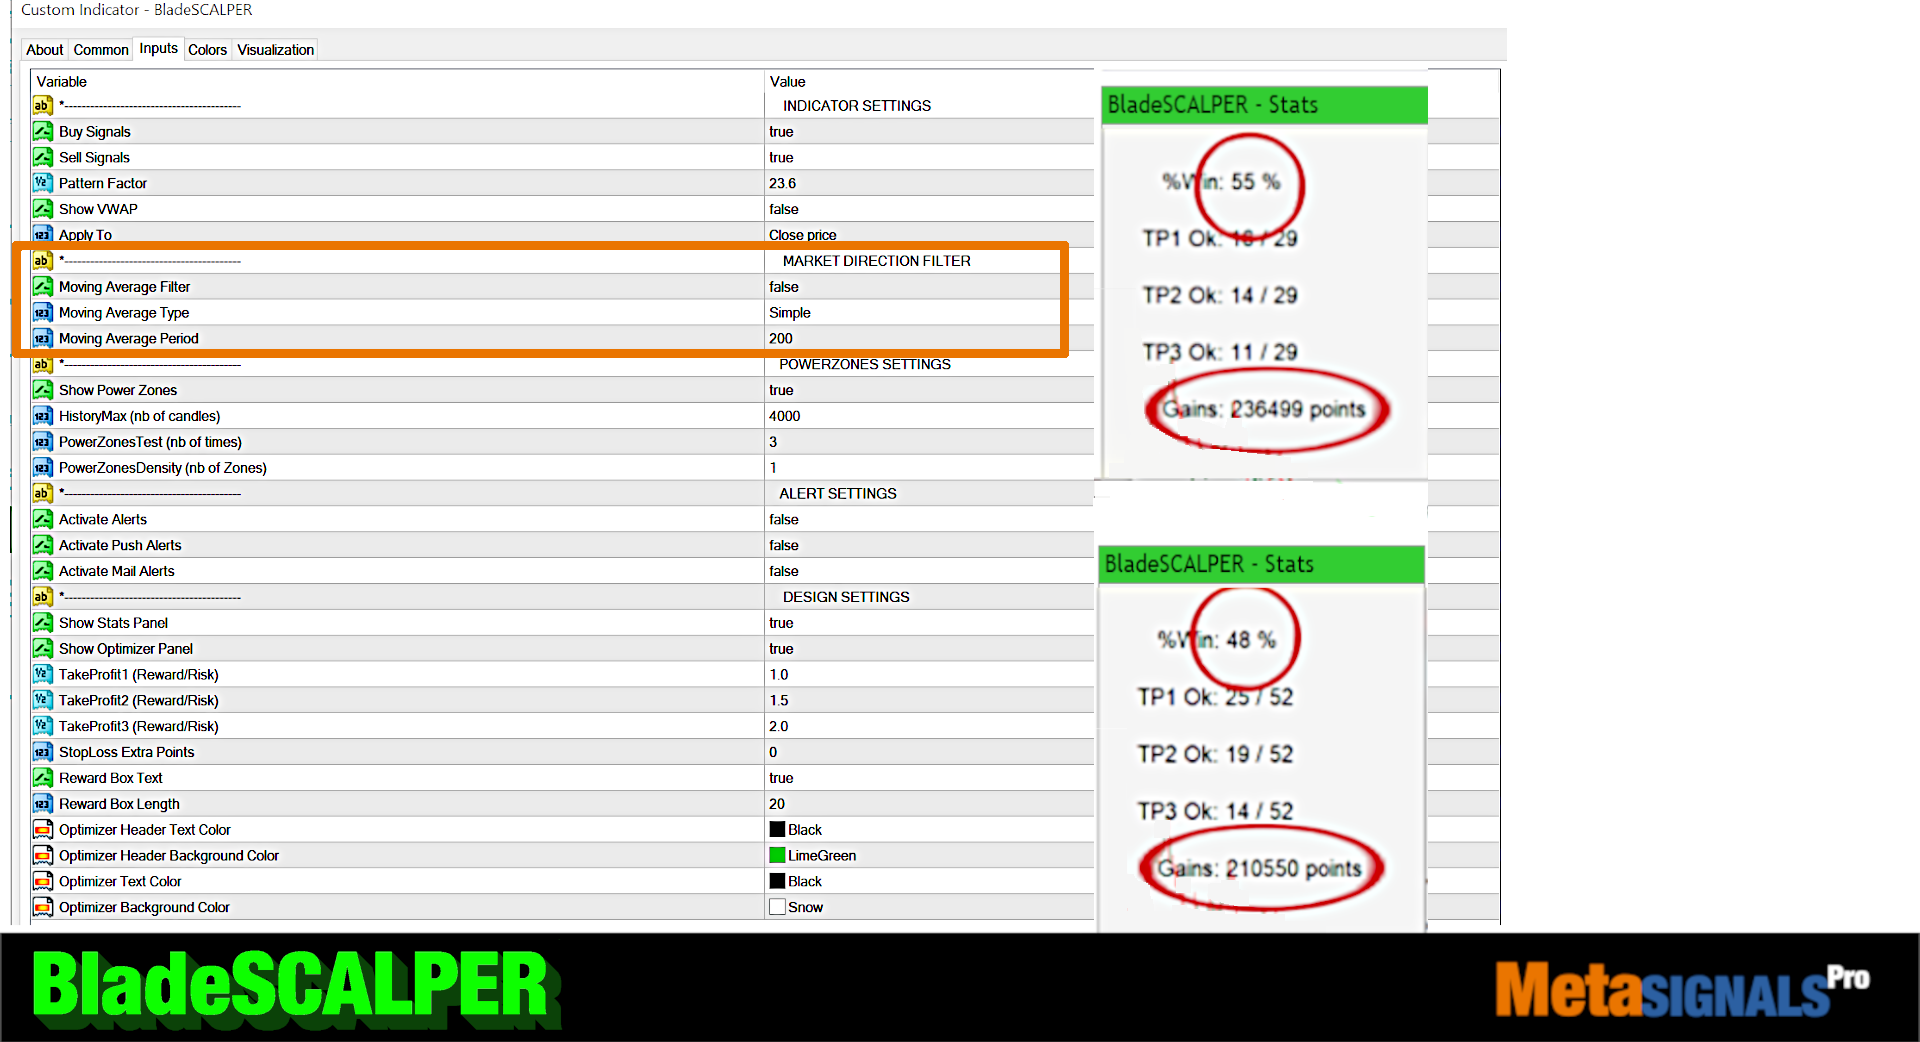
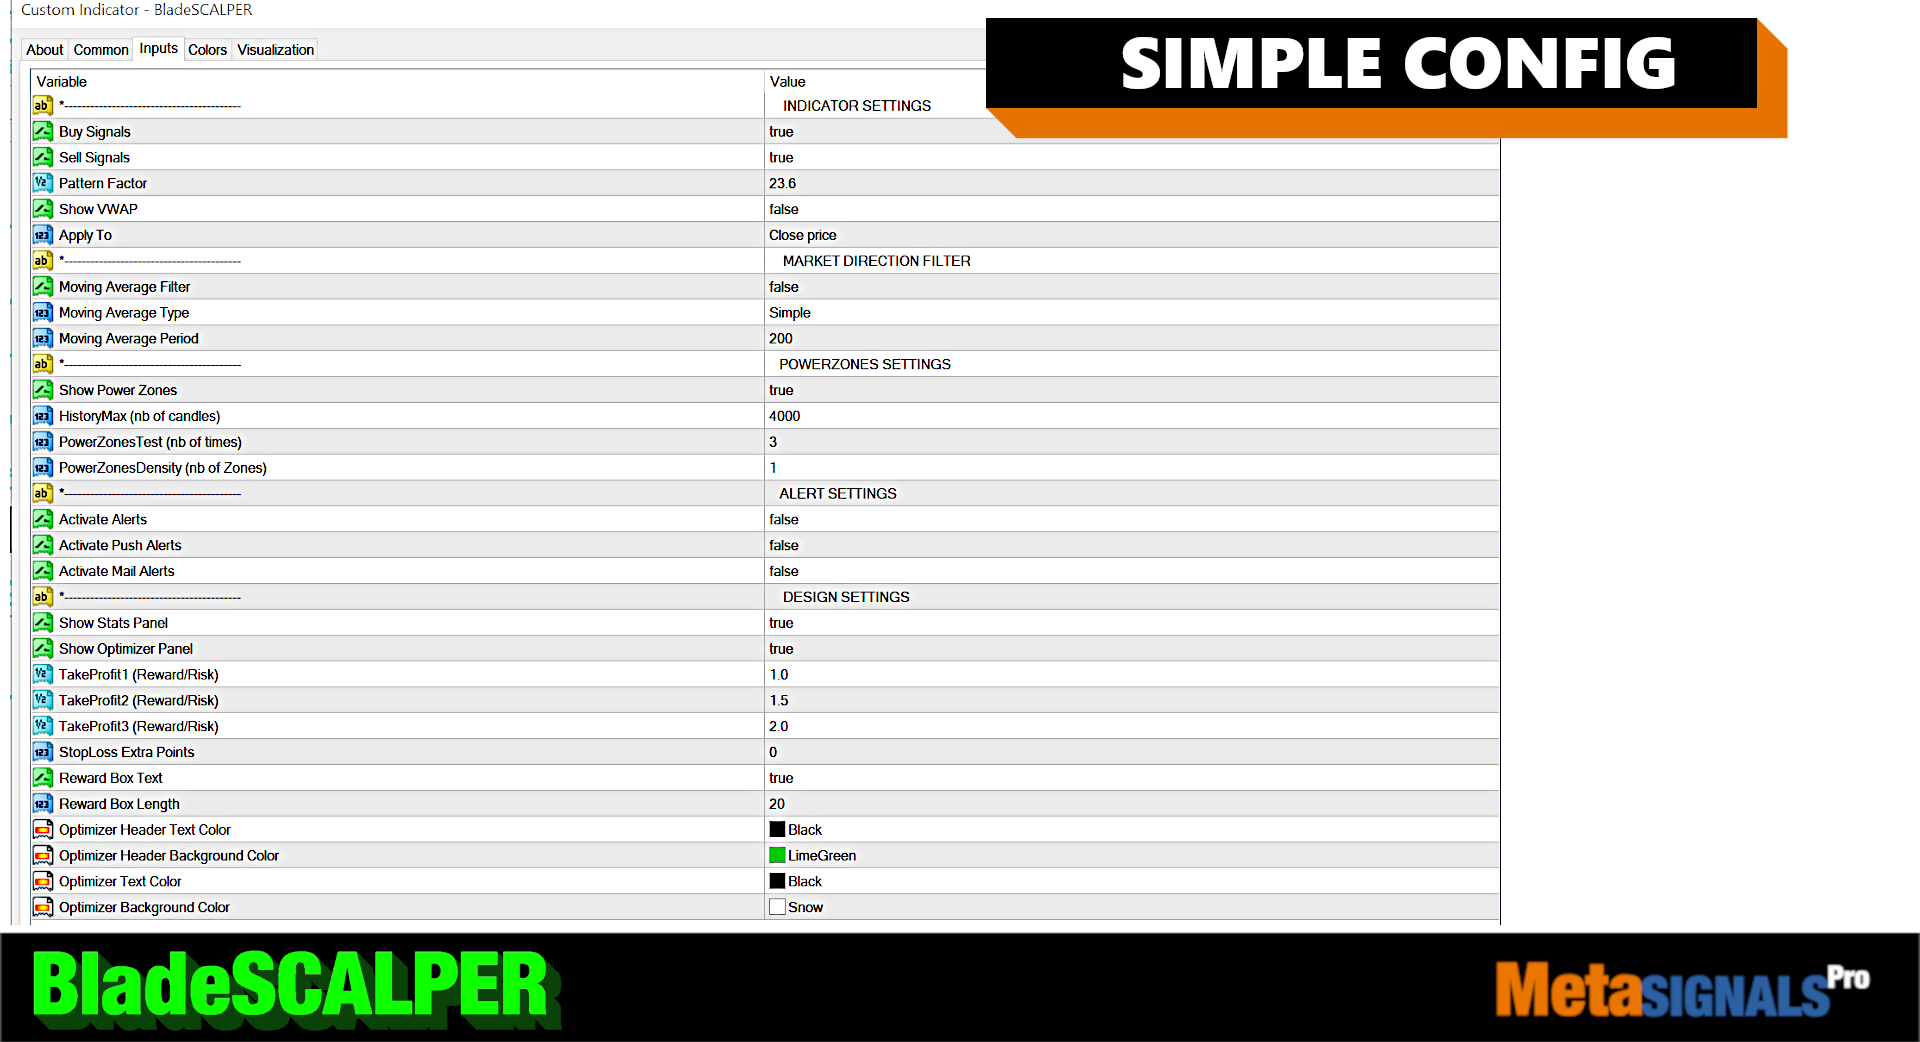
コンフィギュレーション
同封の画像をご覧ください。
- TP1/TP2/TP3: PowerZoneにTakeProfitsを適応させるために、設定を調整します。
- Buy/Sell Signals:Wパターンのみ、またはMパターンのみのシグナルを表示するかどうかを選択します。
- PowerZones: 見たくない場合は「true」(推奨しない)
- RewardBoxText: "Entry, TP1, TP2, TP3" の文字を表示したくない場合は "false" に切り替えます。
- TakeProfit1/TakeProfit2/TakeProfit3:デフォルトでは、「Entry」の下/上にあるグレーのリスクゾーンの倍数に対応します。つまり、リスク/リワード比という古典的な概念になります。
- PowerZoneTouch:ゾーンがタッチされた回数を設定する
- PowerZoneDensity:ゾーンの数を増やしたい場合はこの数値を増やし、逆に増やしたい場合はこの数値を減らす
- RewardBoxLength:想定されるムーブイン期間の長さに標準数値を合わせる
- StopLossExtraPoints:Wパターン(ScalpUP)の場合、RewardBOXの下のボーダーを下げます。Mパターン(ScalpDOWN)の場合、RewardBOXの上のボーダーを上げます。TP1/TP2/TP3の距離を自動的に移動します。
- HistoryMax:PowerZONESと過去のM&Wパターンを設定するために考慮されたユニット数
- ShowVWAP:パターン無効の指標(上記参照)を表示したくない場合は、"false "に切り替える(推奨しない)
- PatternFactor:M&Wパターンの主要なパーセンテージを定義します。
- MovingAverageFilterを使用します:
- false(デフォルト):フィルタがOFFになる
- true:フィルターがONになっている
- MovingAveragePeriod:平均のスピードを選択します。
- MovingAverageType:利用可能なすべての平均値の種類から選択します。