Trading Cycle Array MT5
- インディケータ
- Carl Gustav Johan Ekstrom
- バージョン: 1.10
- アップデート済み: 14 4月 2024
- アクティベーション: 20
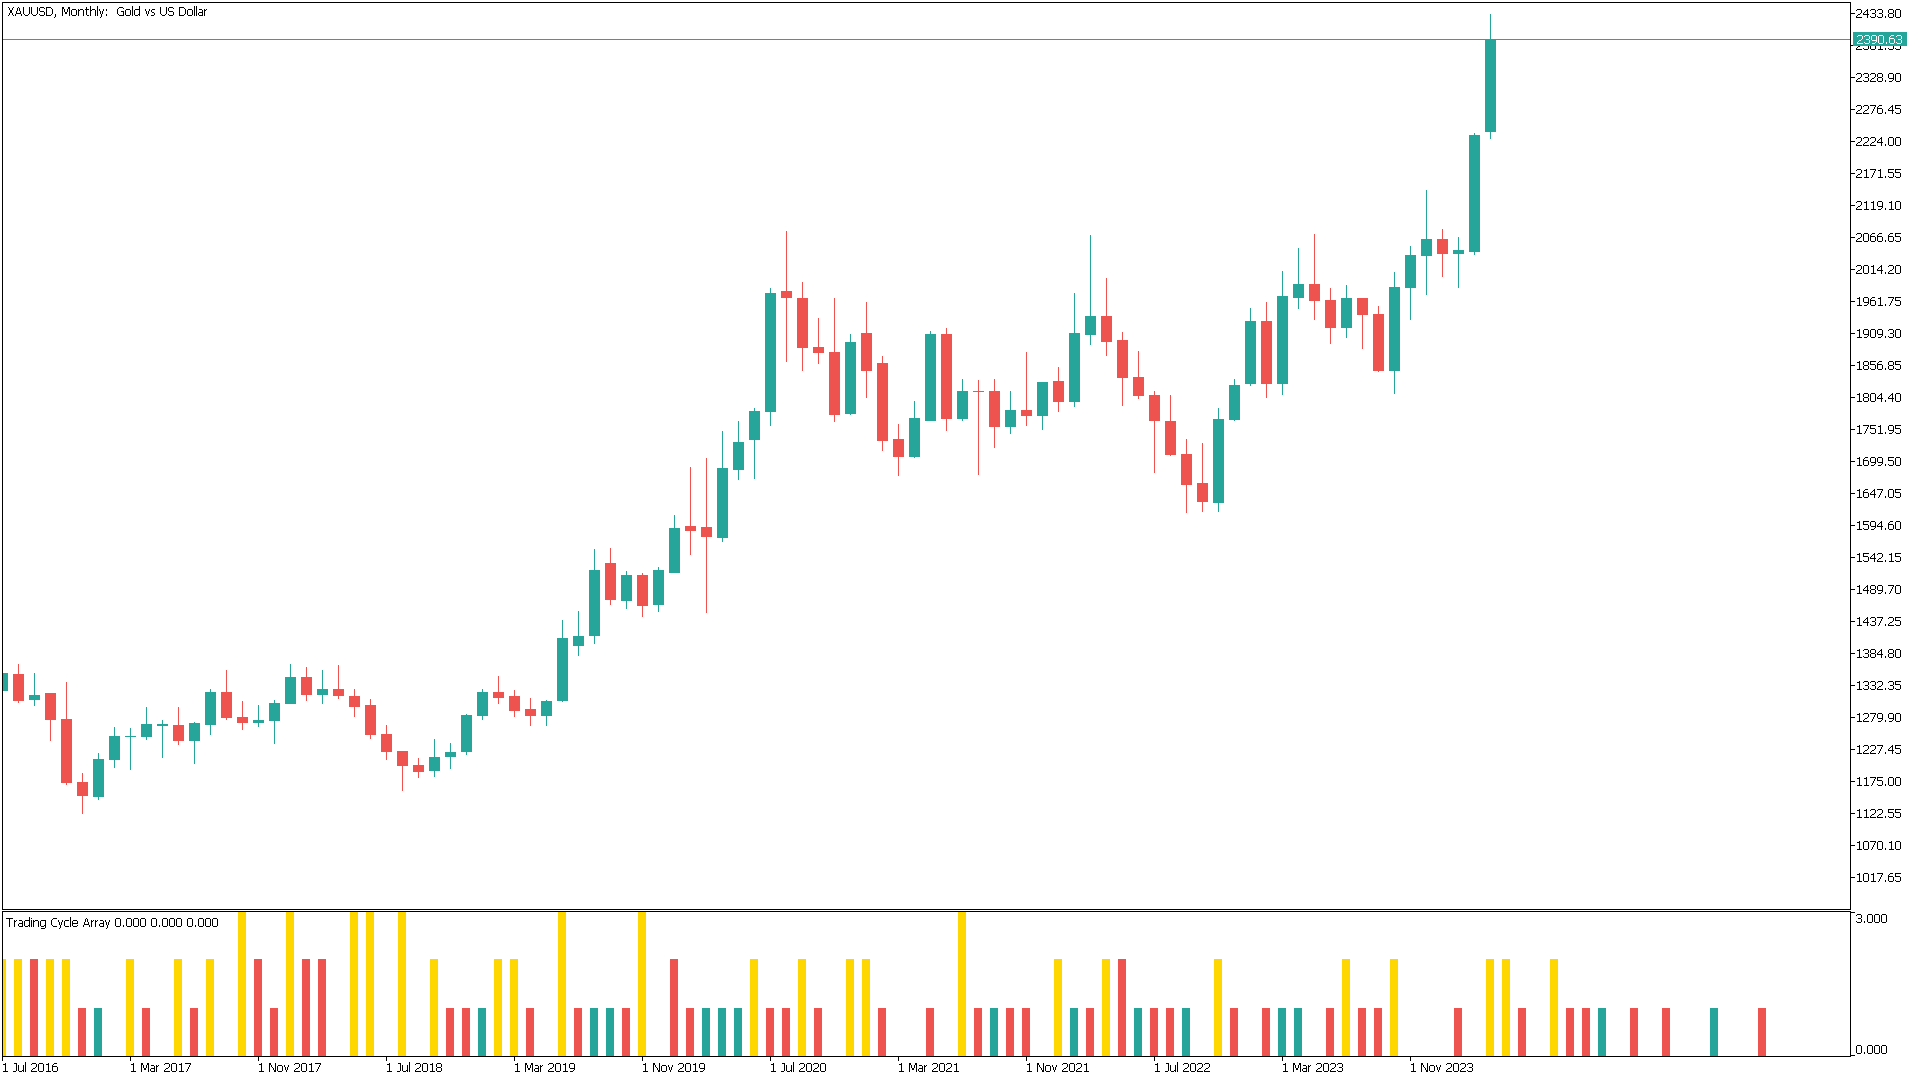
I'm excited to introduce you to the fifth bar on Martin Armstrong's Forecast Array - The Trading Cycle.
This innovative tool represents a transverse form of cyclical frequency analysis, offering a unique perspective on market trends.
This innovative tool represents a transverse form of cyclical frequency analysis, offering a unique perspective on market trends.
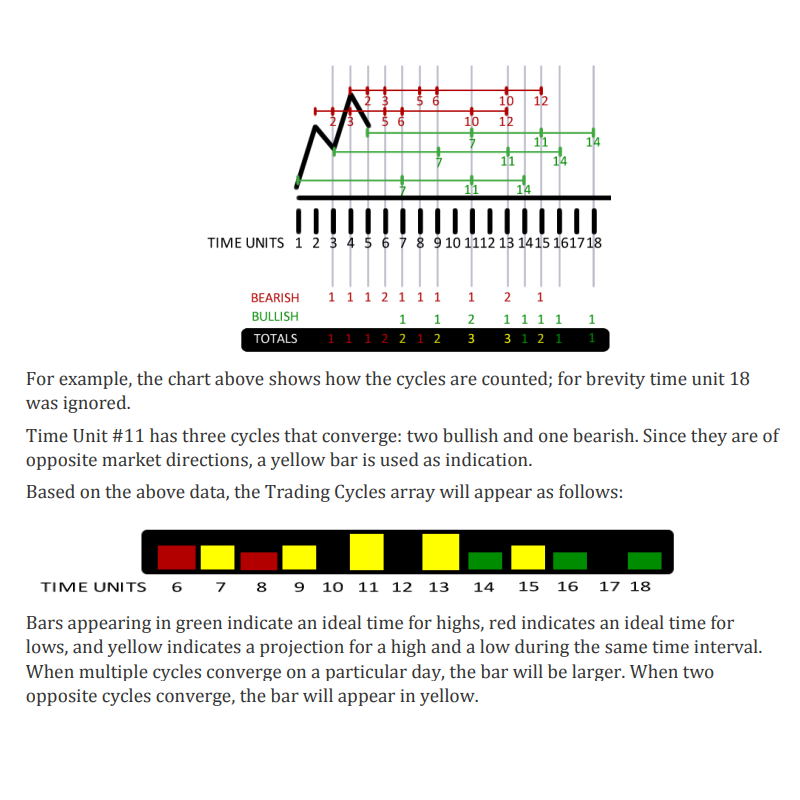
The model employs a color-coded system for easy interpretation. In this model, green signals the ideal timing for highs, red indicates ideal lows, and yellow signifies a convergence of highs and lows occurring simultaneously. This intuitive approach allows users to quickly grasp the underlying trends.
Bullish and bearish markets have empirical nominal durations that last specific time units (days, weeks, months, years):
- Bullish: 7-11-14-21 time units
- Bearish: 2-3-5-6-10-12-18 time units
Bullish trading cycles originate from a market low, whereas bearish trading cycles begin from a market high. The Trading Cycles Model quantifies the bullish and bearish predictions that fall on a particular time unit.
Through the Trading Cycles Model, we can quantify both bullish and bearish predictions within specific time units, providing a comprehensive view of market trends. By leveraging this tool, we can make more informed decisions and navigate the complexities of financial markets with greater confidence.
You can utilize this indicator across various time frames, although I suggest adhering to the daily, weekly, and monthly intervals as advised by Martin.
Parameters
- Bars Look-Back: 100
Market cycles are key and this is of great use. Author has one of a kind indicators and provides a lot of help. Can't thank him enough for all resources he has provided to give great understanding on how market moves.