Wave Mark And Quick Drawing
パート1:特性です
- 線引きと波マーカー機能が組み込まれています
- 線引き中に自動吸着(ハイ/ローを自動検索)します。
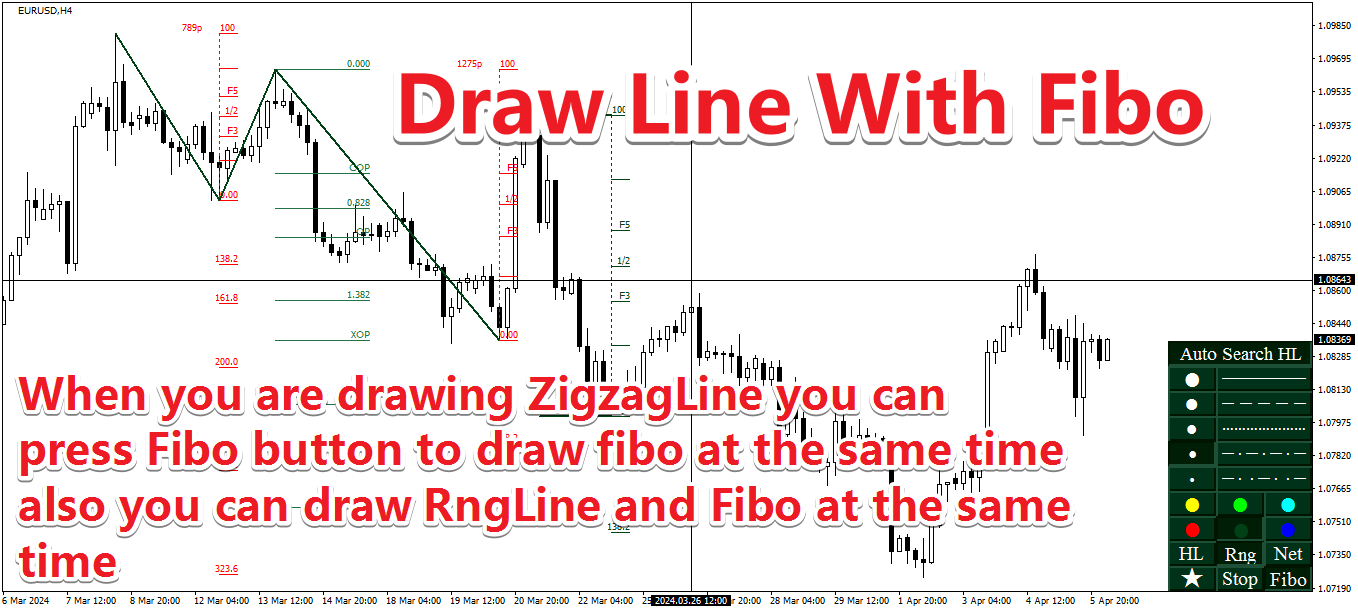
- 折れ線とフィボナッチ回とフィボナッチ拡大を同時に描きます
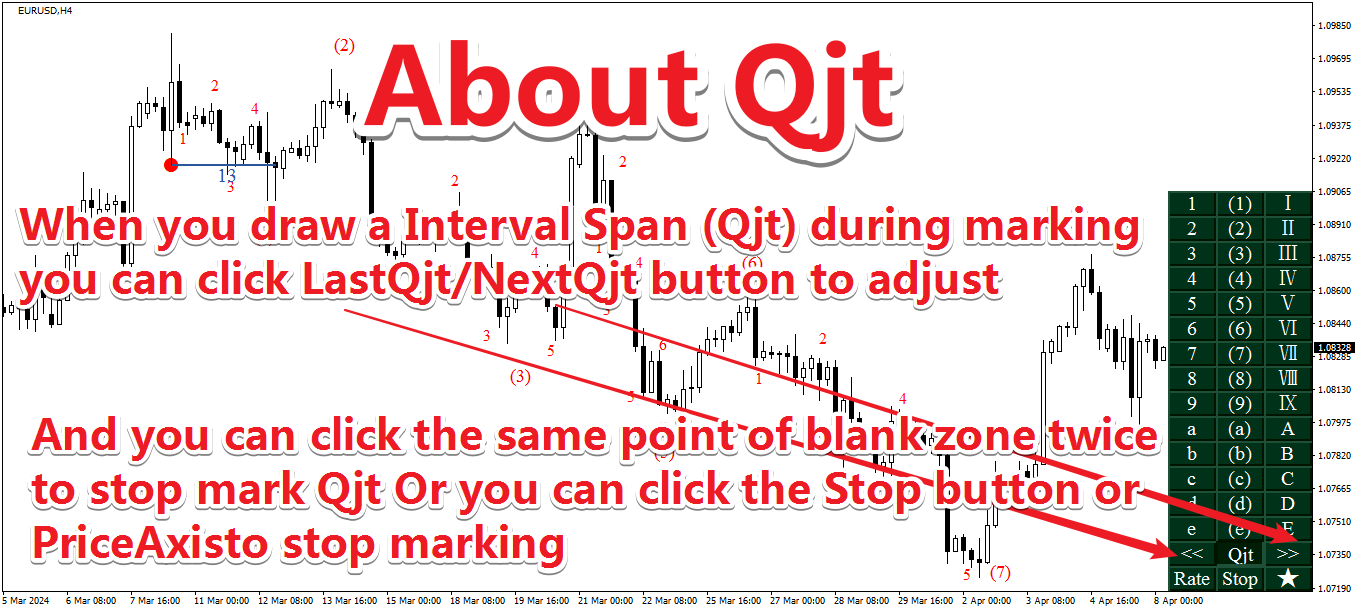
- Qjtと呼ばれるスパンの比率を求めます
- オブジェクトをクリックで連続削除します。
- 線を引く対象を一括削除します。
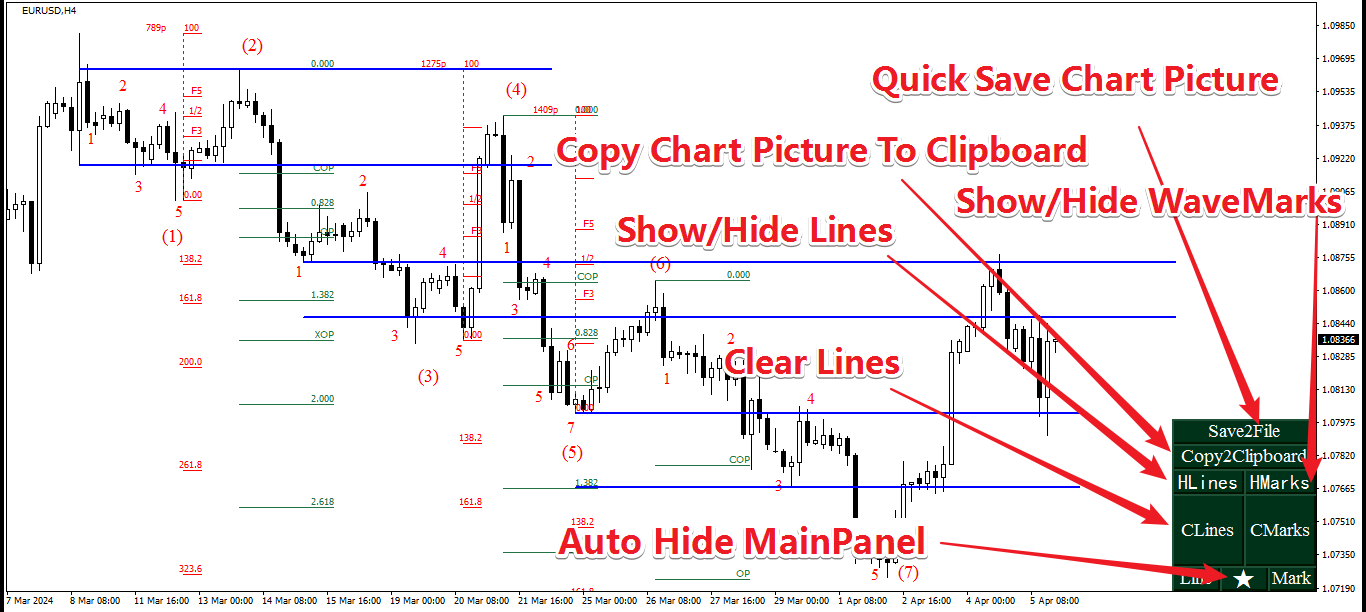
- 線と波のマークを表示/非表示にします
- 現在のグラフをローカルのあるフォルダに画像として素早く保存します。
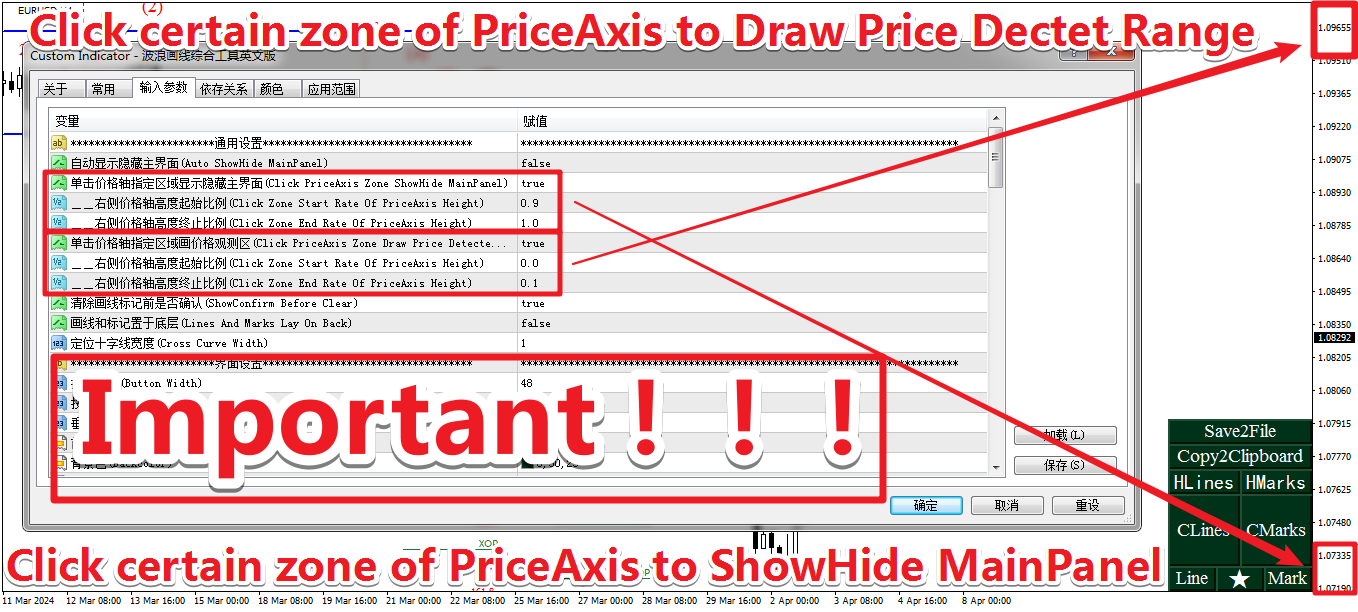
- 価格軸の特定領域をクリックまたはホットキーWを押すことでメインパネルを表示/非表示にします。
- Qボタンを押してパネルを切り替えます
- メインパネルは自動的に隠されます
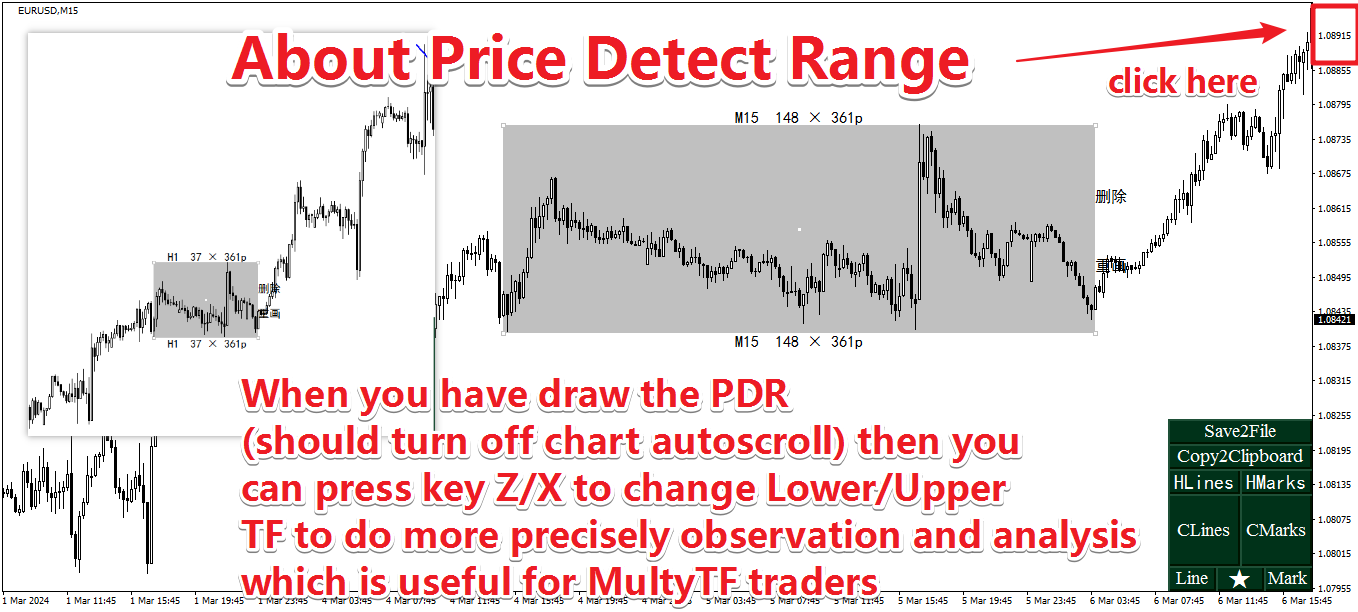
- 価格軸の特定の領域をクリックして価格検出範囲を描画します
- ホットキーZとXで上下サイクルに素早く切り替えます
第2部:描画です
(1)線を引くタイプです。
- 折れ線です
- Fiboです
- 水平傾向線です
- 区間線です
- 時空の格子です
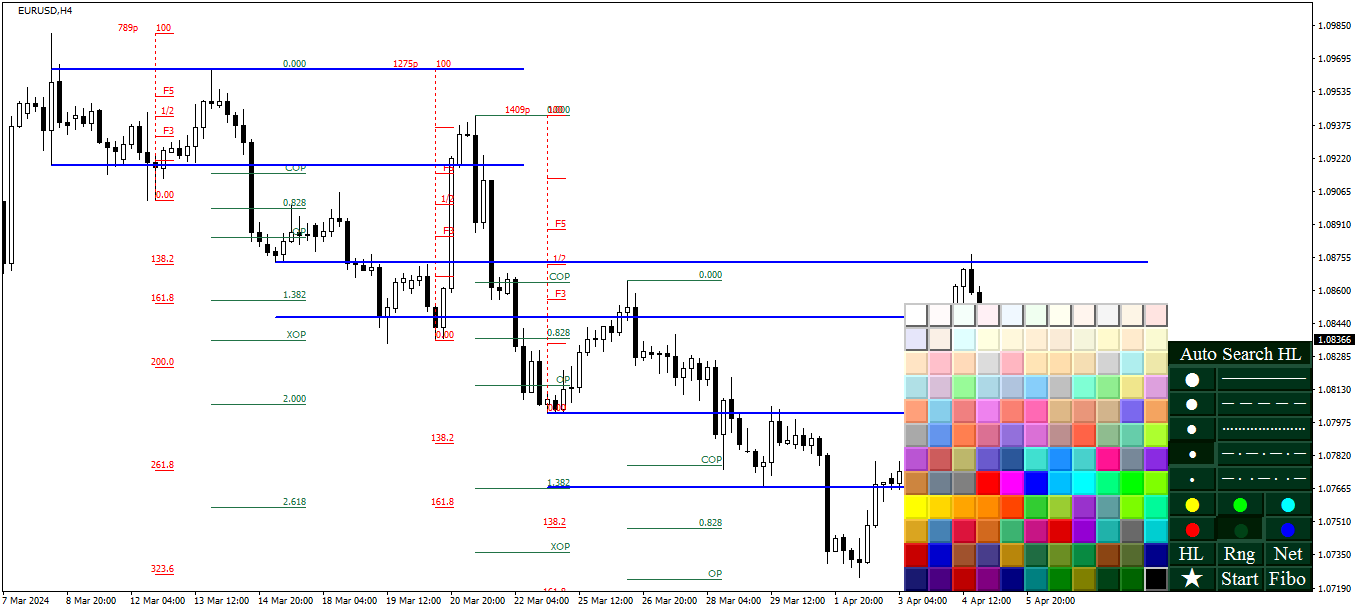
(2)線の色、形、幅を設定します。
- 線の色や形、幅を設定するには、いくつかのボタンをクリックするだけです。
- 2行目の真ん中の色ボタンを押すと、色選択パネルを呼び出してカスタムカラーを設定します。
(3) .線を引き始めます。
- 描画タイプボタン(HL/Rng/Net/Fibo)を押していない場合、線の色ボタンまたは線のスタイルボタンまたは線の幅ボタンを選択すると、デフォルトで折れ線が描画されます。
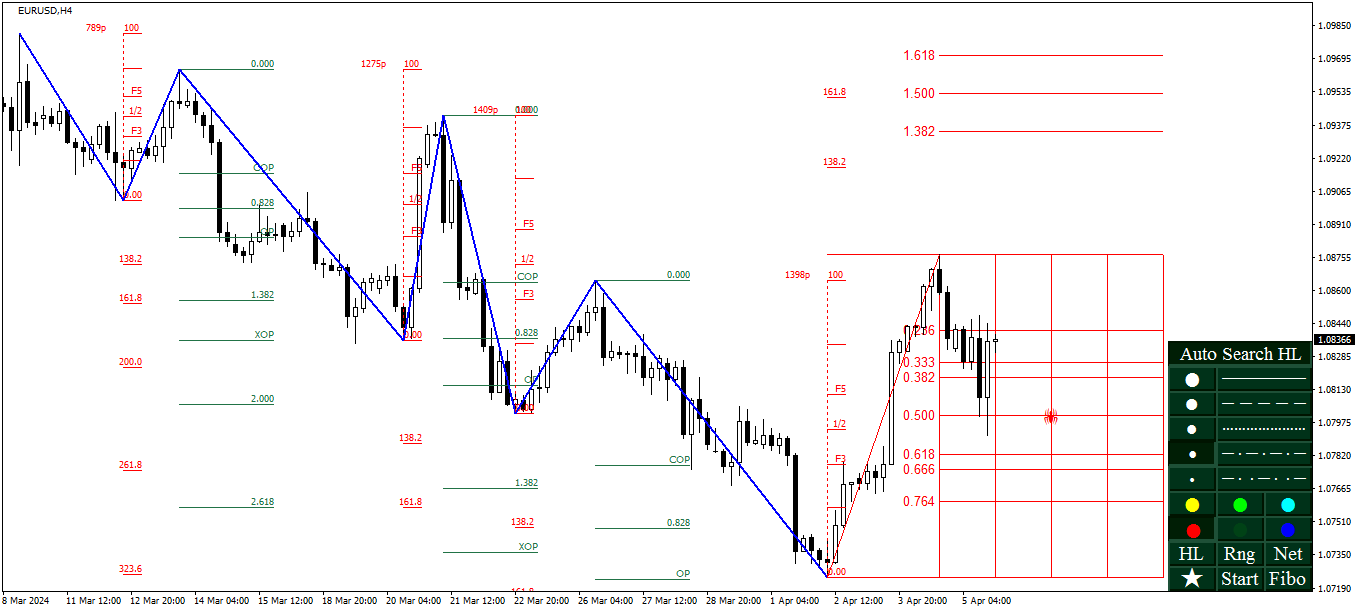
- 折れ線やインターバル線を描画しているときはFiboボタンを押します。フィボナッチ戻しとフィボナッチ拡張を同時に描画します。
- 最高値と最安値の位置を正確に特定できる線を描きたい場合はAutosearchhlボタンを押します
(4)線を引き終わります
- 同じ領域(誤差範囲20ピクセル)を2回クリックします。
- 価格軸をクリックします
- 停止ボタンをクリックします。
(5)線を引くのをやめる
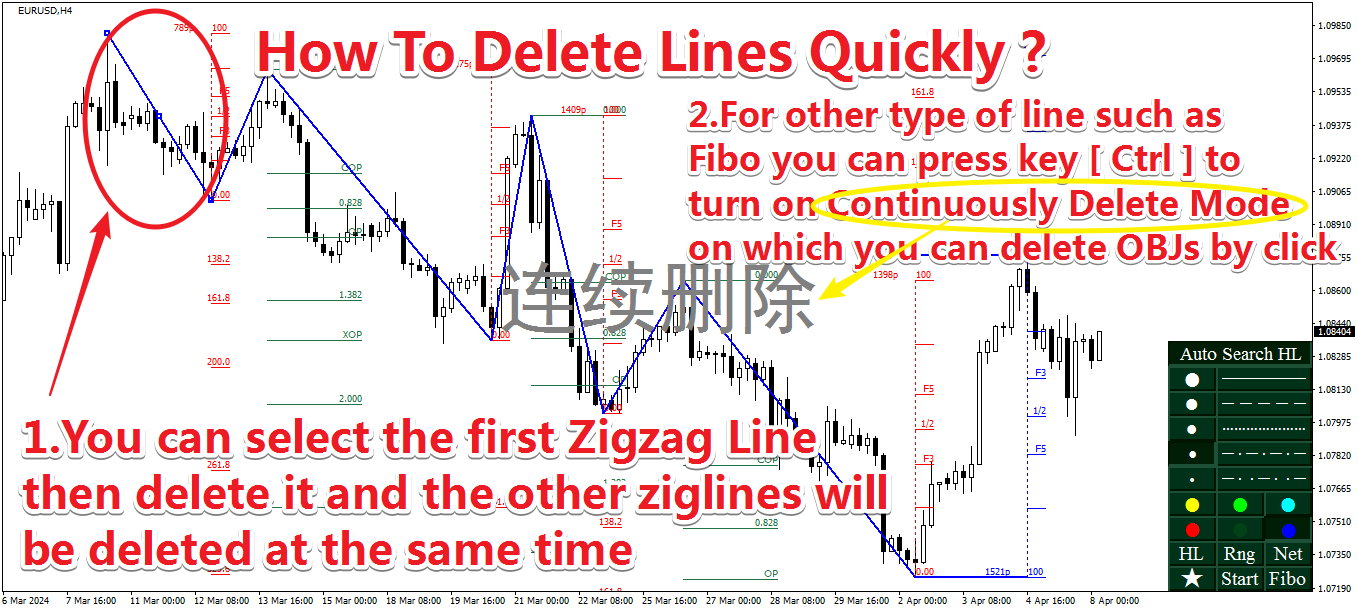
- 折れ線の最初の部分を選択して削除します。折れ線をすべて削除します。
- Ctrlキーで連続削除モードを開き、削除対象をクリックします。
- 「クリア」ボタンをクリックするとすべての描画がクリアされます。
- 「波のマーク」ボタンをクリックして全ての波のマークを消します
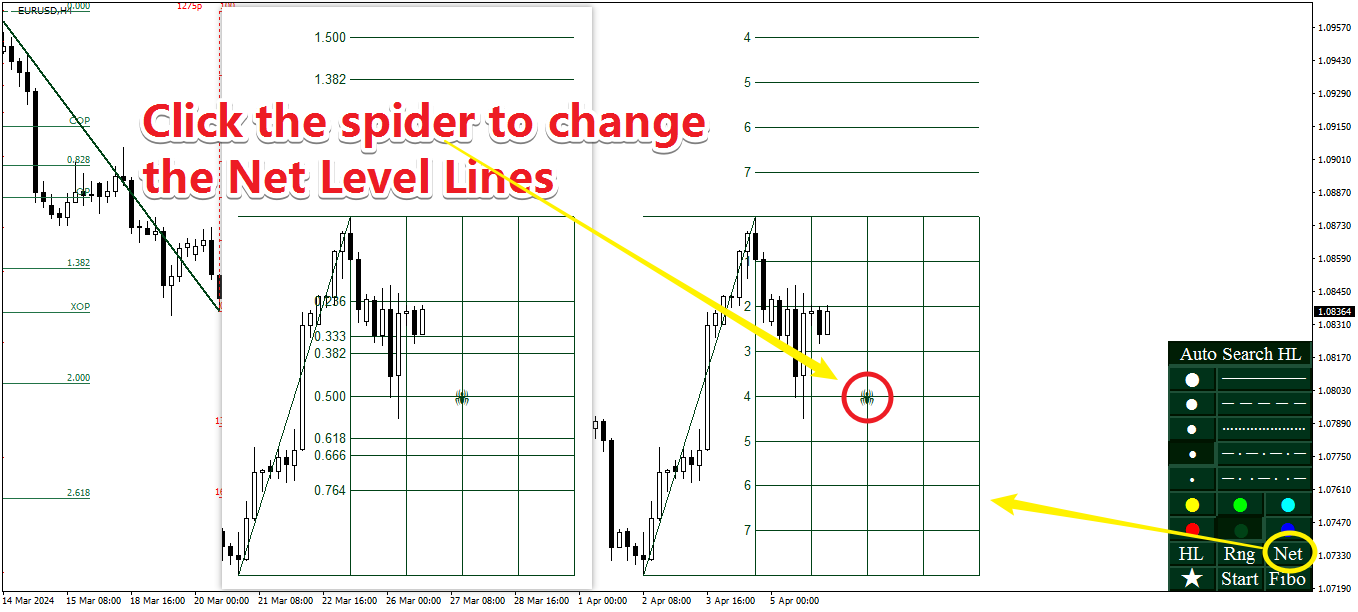
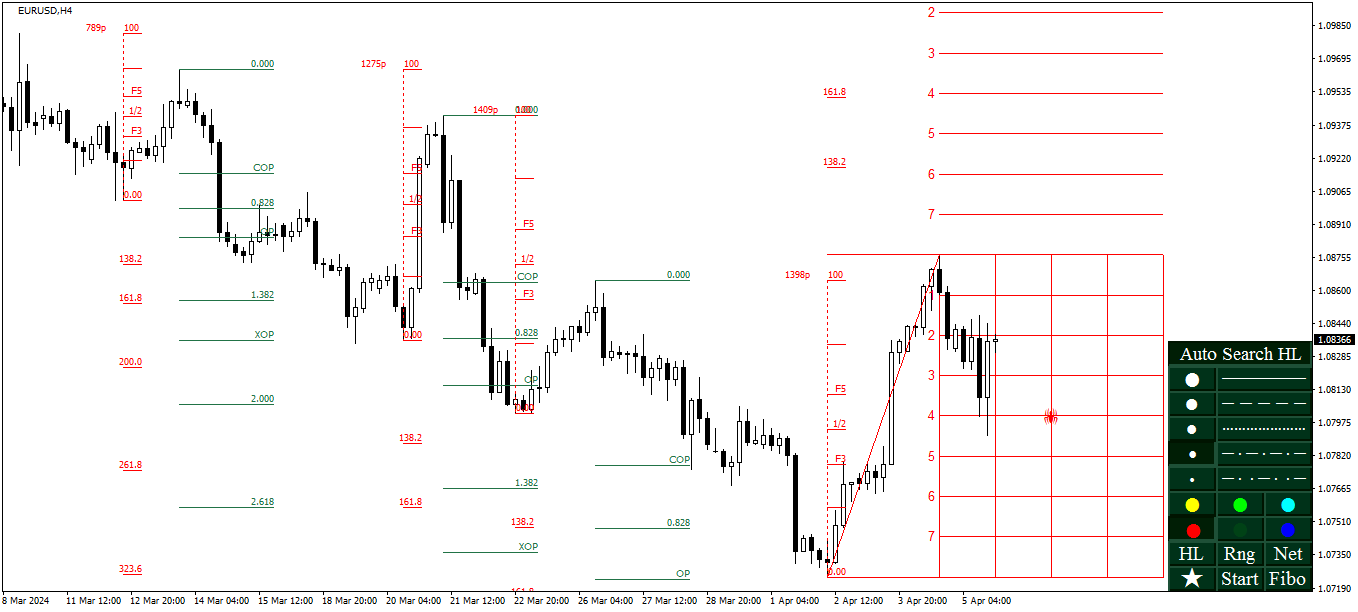
(6)。価格-時間-純レベルを変更します。
- 時空格子の中央にあるクモのアイコンをクリックして水平比ビットを切り替えます
パート3波マーカーです
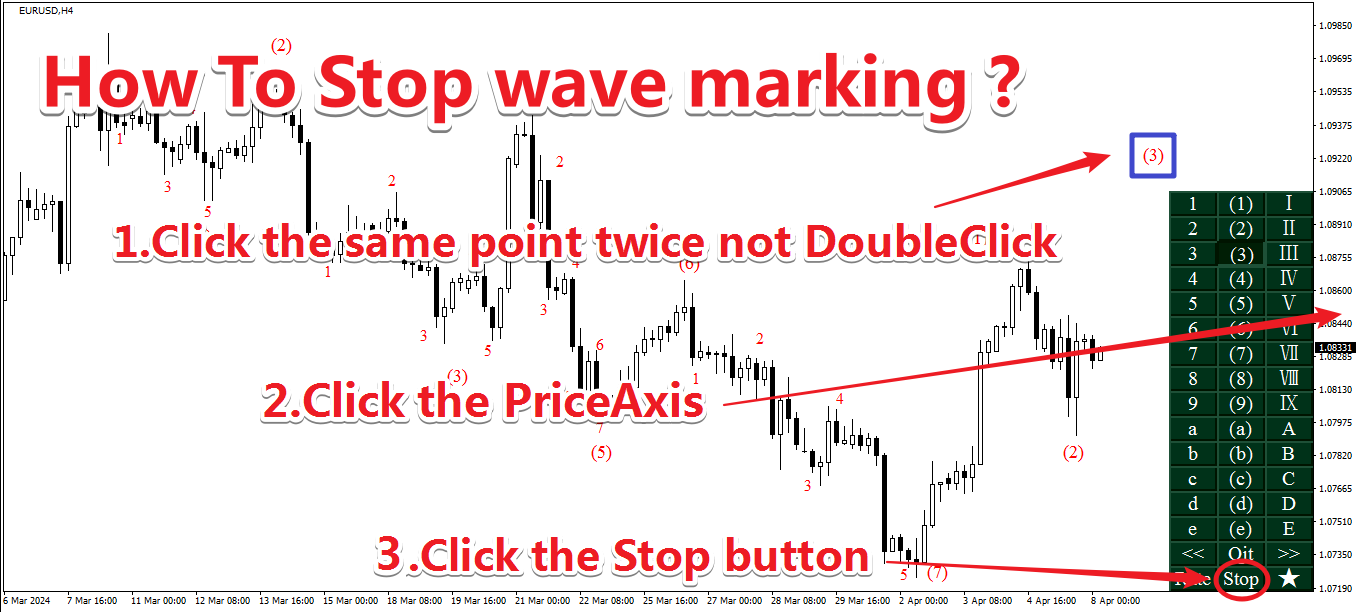
(1).波止めマークまたはQjtマークです
- マークが停止している場合は、同じ領域を2回クリック(誤差範囲は20ピクセル)します(マークQjtを停止している場合は、その領域は空白領域になります)。
- 価格軸をクリックして停止します
- 停止ボタンをクリックします。
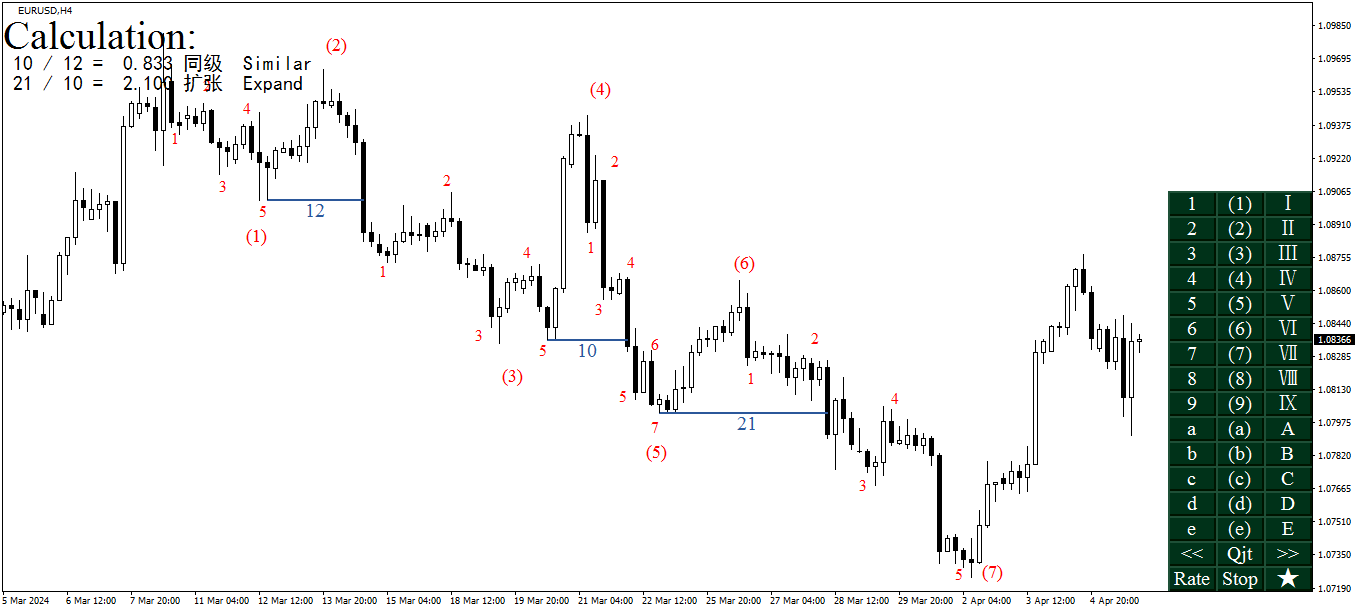
(2). Qjtマークです。
- Qjtボタンを押します
- BMS(ブレイクスルー)以前の高値または安値をクリックします
- Qjtを調整するには、<</>>ボタンをクリックします。
(3) Qjtsシーケンスの比率を算出します。
- Rateボタンをクリックします
- 計算するQjtsを選択します。