Moving Average Scanner MT4
- インディケータ
- Frederic Jacques Collomb
- バージョン: 1.0
- アクティベーション: 5
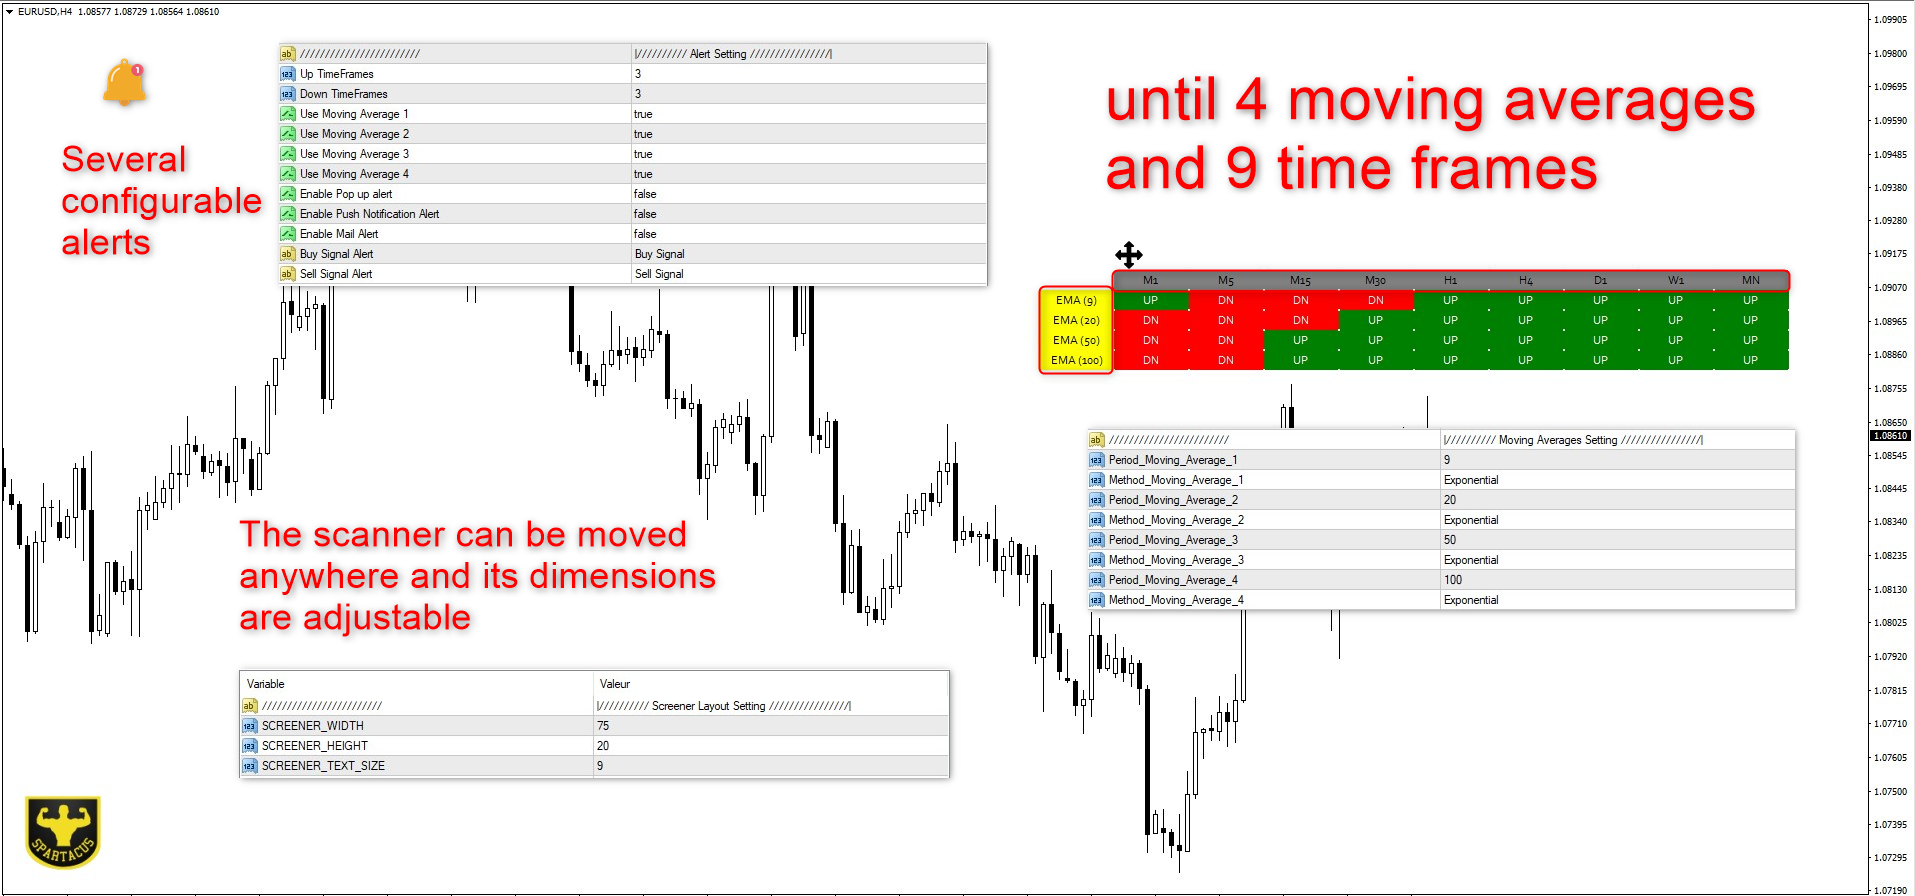
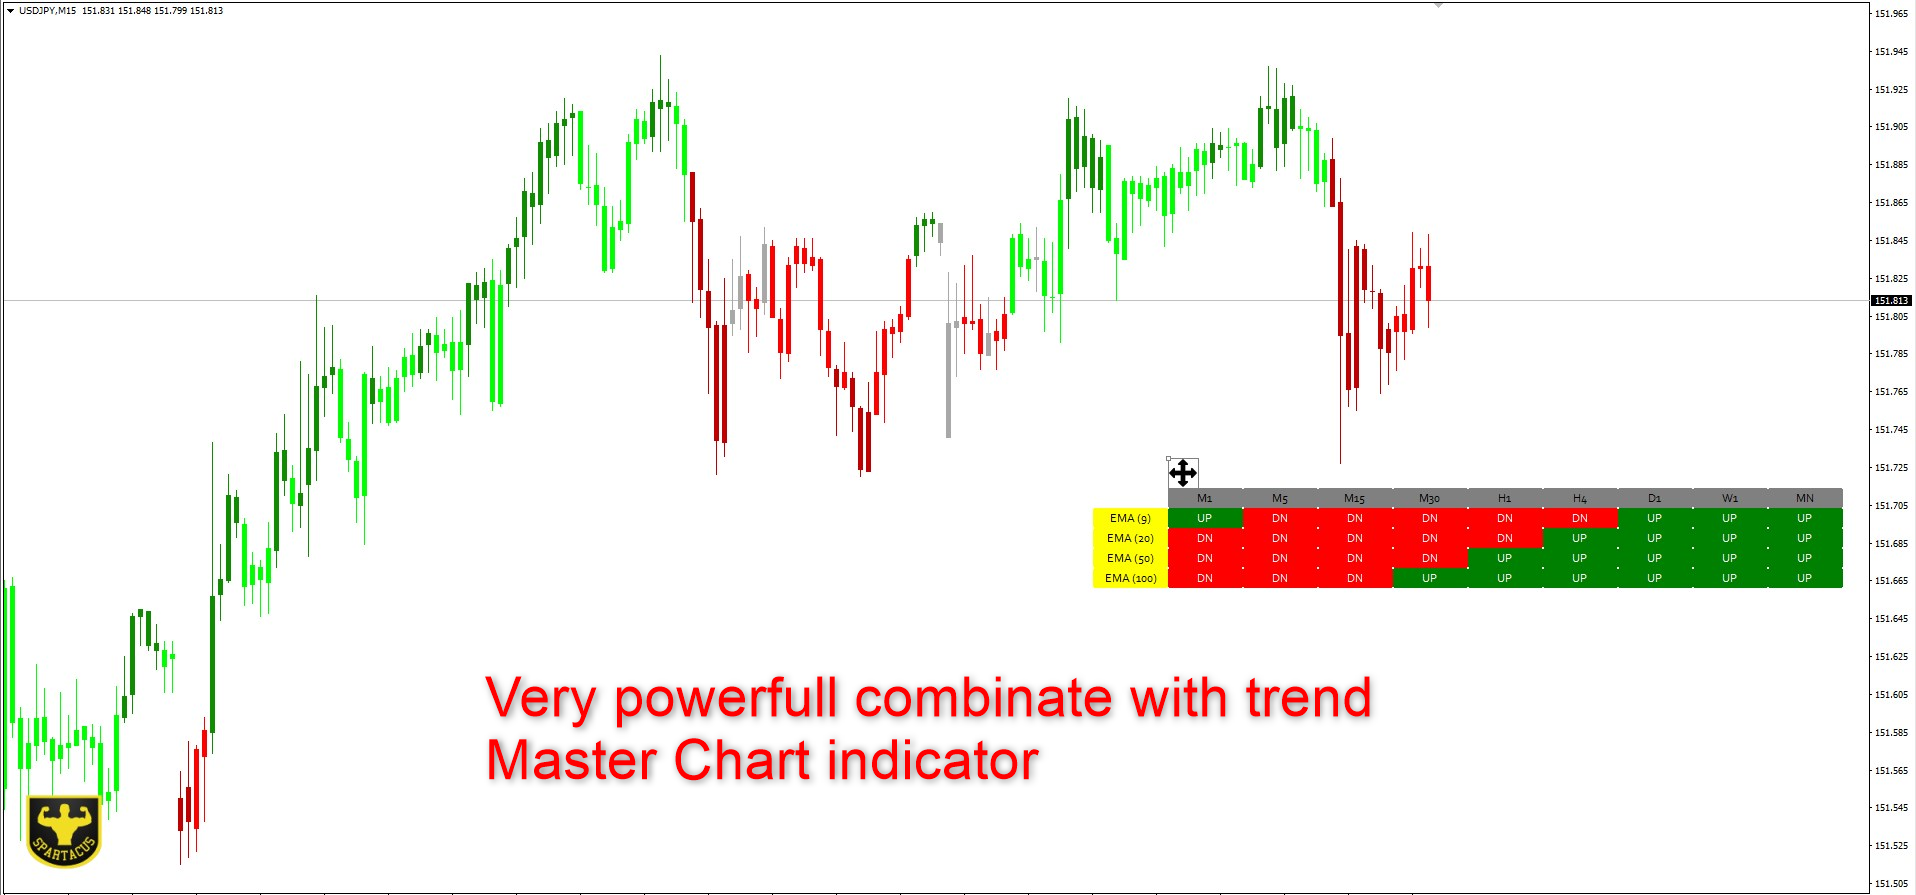
Moving Average Scanner、チャートを変更せずに複数の時間枠にわたる傾向を一目で確認するのに最適なマルチタイムフレーム スキャナーです。
9 つの時間単位にわたって、選択した最大 4 つの移動平均を使用できます。 これは完全に構成可能で、単に「ドラッグ アンド ドロップ」するだけでグラフ上のどこにでも移動できます。
移動平均は 4 つの異なる計算方法で設定できます。 移動平均の数と期間の数に基づいてアラートを設定することもできます。
入力パラメータ:
スクリーナーのレイアウト:
グラフ上に表示されるスキャナーの希望のサイズと表示テキストのサイズを調整できます。
移動平均:
4 つの異なる移動平均期間と 4 つの計算方法 (単純/指数/平滑化および線形加重) を設定できます。
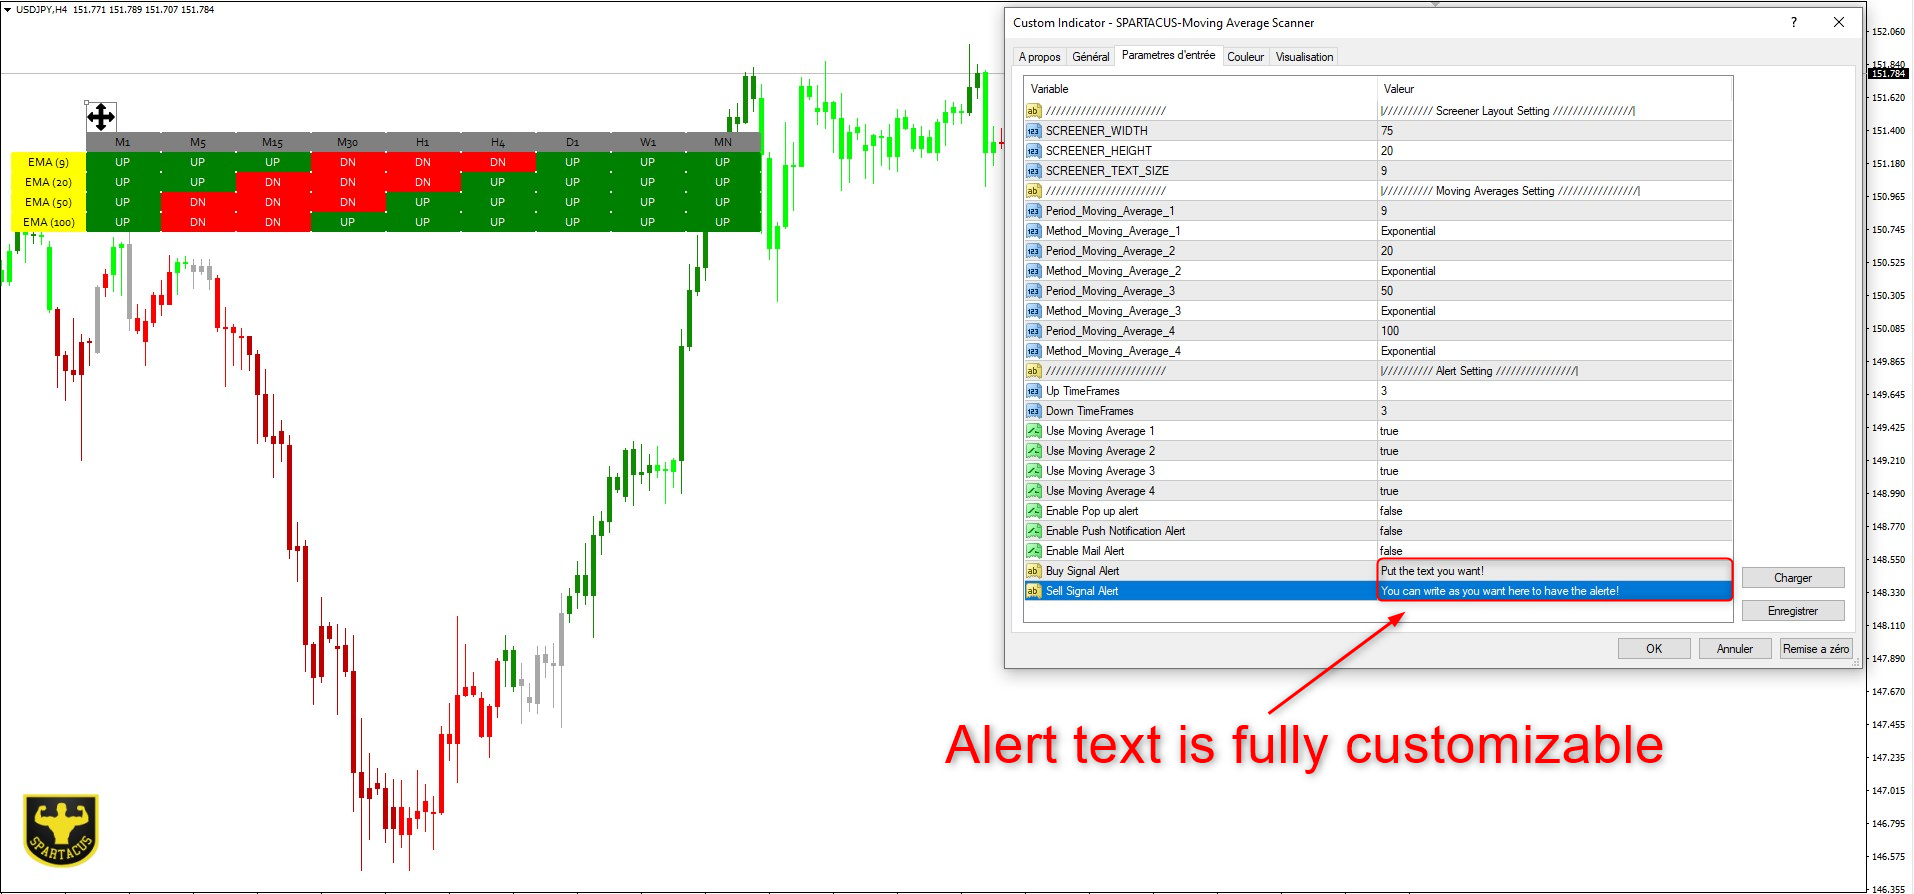
アラート:
アラートを設定するには、アラートをトリガーするために選択した移動平均と組み合わせた希望の時間枠数 (強気/弱気) を選択するだけです。
ポップアップ/プッシュ通知とメールでアラートが可能。 アラートテキストは完全にカスタマイズ可能です。
SPARTACUS©2024