RsiDivTreder
- エキスパート
- Vladimir Utkin
- バージョン: 1.0
- アクティベーション: 5
The Relative Strength Index (RSI) is one of the most important and well-known indicators used by traders worldwide. By its nature, the RSI indicator is an oscillator, meaning it oscillates within a specific range, limited by a maximum value of 100 and a minimum value of 0.
This indicator reflects the "momentum" - the speed and magnitude at which the price movement changes; how strongly the price changes in the direction of its movement. In other words, the RSI indicator shows the strength of the trend and the probability of its reversal.
🔹The stronger the relative upward price movement (greater cumulative length of green candles over a specific period), the closer the indicator value is to 100;
🔹The stronger the relative downward price movement (greater cumulative length of red candles over a specific period), the closer the indicator value is to 0.
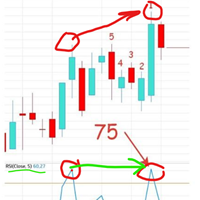
The RSI indicator is based on the analysis of closing prices of candles over a specific period of time and their relative difference (the wicks of the candles are not taken into account when constructing the indicator graph - only closing values are considered). Roughly speaking, the indicator shows how strong the movement is over a certain period of time based on the "strength of the candles" during that period. If it's still unclear, I understand, it can be challenging at first. To make it easier to understand, I will illustrate the described principle on a chart.
In summary, based on the chart, it can be seen that the RSI indicator analyzes the sum of candle lengths (their strength) over a specific period.
IDENTIFYING DIVERGENCE
One of the most reliable trading methods using the RSI indicator is divergence. Divergence is a moment when there is a discrepancy between the values of the indicator and the price, hinting at an imminent trend reversal towards the direction of the indicator value.
For example, "bearish divergence" occurs when price highs are rising, but at the same time, RSI indicator highs are decreasing. This indicates a possible imminent reversal of movement (price will move towards the direction of the indicator values).
"bullish divergence" occurs when price lows are decreasing, but at the same time, RSI indicator lows are increasing. This suggests that a trend reversal is expected in the near future.
VALUES
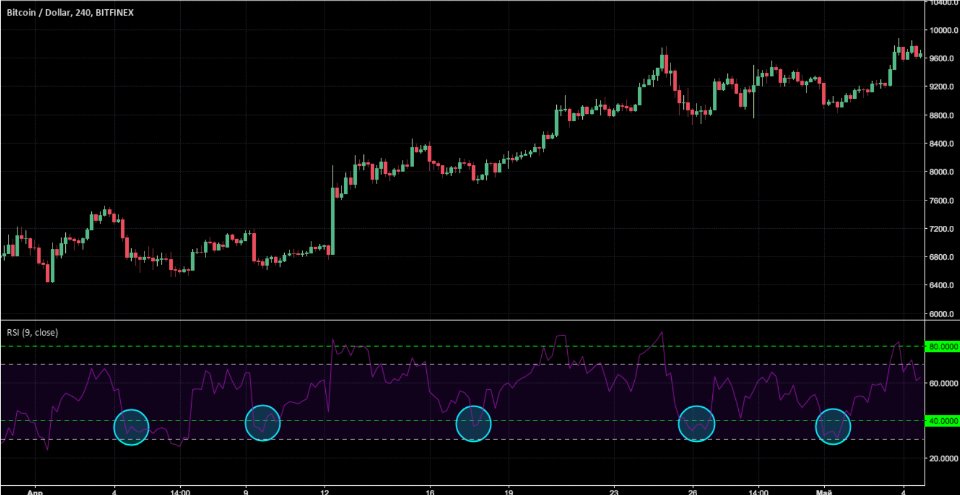
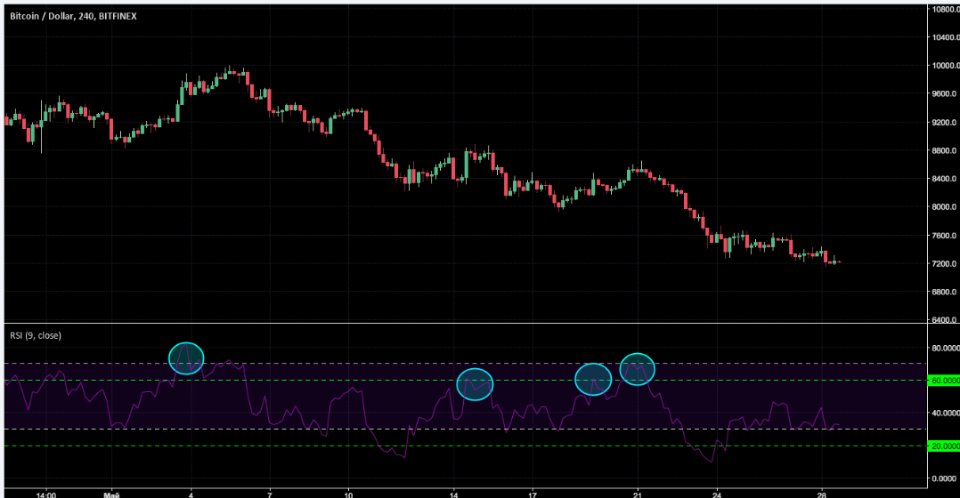
Another parameter that can be customized and different values can be used. Typically, values of 30 (for oversold conditions), 70 (for overbought conditions), and 50 (for trend determination) are commonly used.
However, in some cases, other values can be used. Further explanation:
1) Upward trend. It is advisable to use levels 40 and 80. Previous values of 30 and 70 may give more false signals. Regarding when to buy/sell an asset - only make purchases when the indicator reaches level 40.
2) Downward trend. It is more appropriate to use levels 20 and 60. In this case, only sell when the indicator reaches level 60.
If you found the material helpful and somewhat useful - let me know, I really tried :)
And yes, write in the comments any three indicators you would like to see discussed in the future - I will choose those that are mentioned most frequently and will also analyze them in some way :)
Wishing everyone success and profitable trading decisions! (including with the help of the RSI indicator)
P.S. I am waiting for you in my Telegram channel (for the link, please contact me in private messages if you are interested).
I'm sending a set with the settings. Check the profitability on the screen.
