YK Find Support And Resistance MT5
- インディケータ
- Peechanat Chatsermsak
- バージョン: 1.0
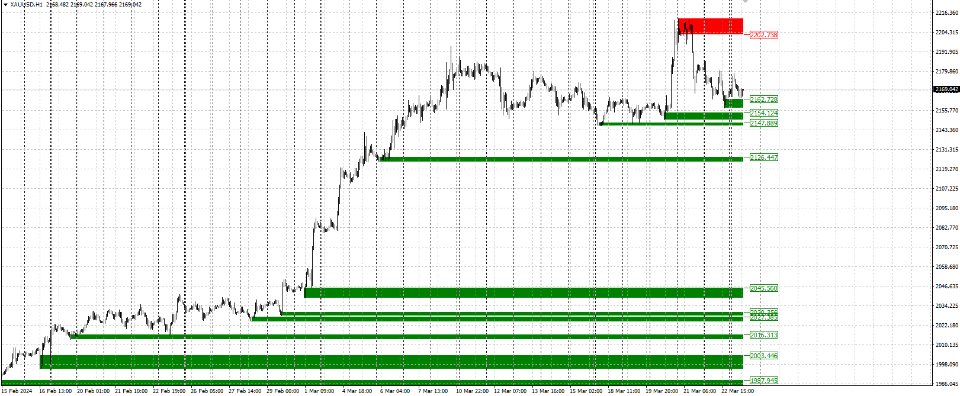
The " YK Find Support And Resistance" indicator is a technical analysis tool used to identify key support and resistance levels on a price chart. Its features and functions are as follows:
1. Displays support and resistance levels using arrow lines and colored bands, with resistance in red and support in green.
2. Can be adjusted to calculate and display results from a specified timeframe using the forced_tf variable. If set to 0, it will use the current timeframe of the chart.
3. Uses the Zig Zag algorithm to find significant high and low points on the chart, with parameters iPeriod, Dev, and Step to determine the precision of the Zig Zag points.
4. Has an option to use narrower price bands (Narrow Bands), which will only consider price ranges close to the close-open points of the candlesticks.
5. Can eliminate support/resistance levels that have been "touched" (Retouch) multiple times, leaving only the truly significant levels.
6. Support/resistance lines are drawn as dotted lines from historical points up to the current price bar, indicating the current significant levels.
7. When significant price changes occur, such as new highs or lows, the support/resistance lines are automatically adjusted to reflect the changes.
In summary, YK Find Support And Resistance is an indicator that helps identify key support and resistance levels in the market. It can be used as a tool to aid in the analysis and decision-making process for opening and closing various orders, in conjunction with other technical and fundamental factors.
อินดิเคเตอร์ "YK Find Support And Resistance" เป็นเครื่องมือวิเคราะห์ทางเทคนิคที่ใช้ระบุแนวรับและแนวต้านสำคัญในกราฟราคา โดยมีคุณสมบัติและการทำงานดังนี้:


