MACD Divergence and TFR for MT5
- インディケータ
- Krzysztof Janusz Stankiewic
- バージョン: 1.1
- アップデート済み: 2 4月 2024
- アクティベーション: 5
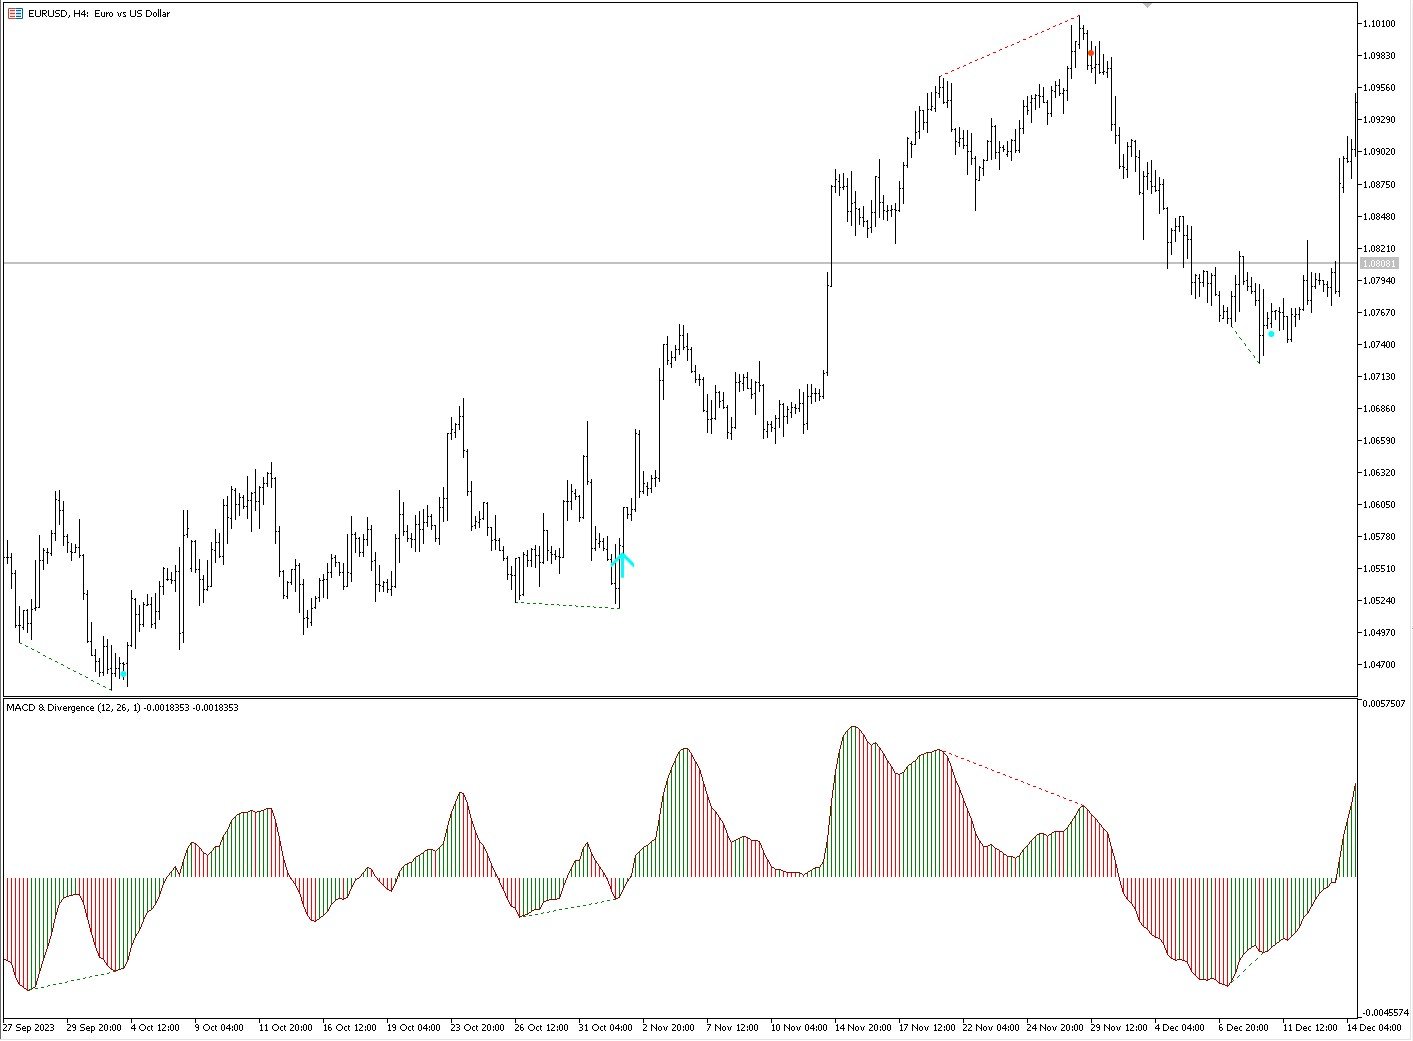
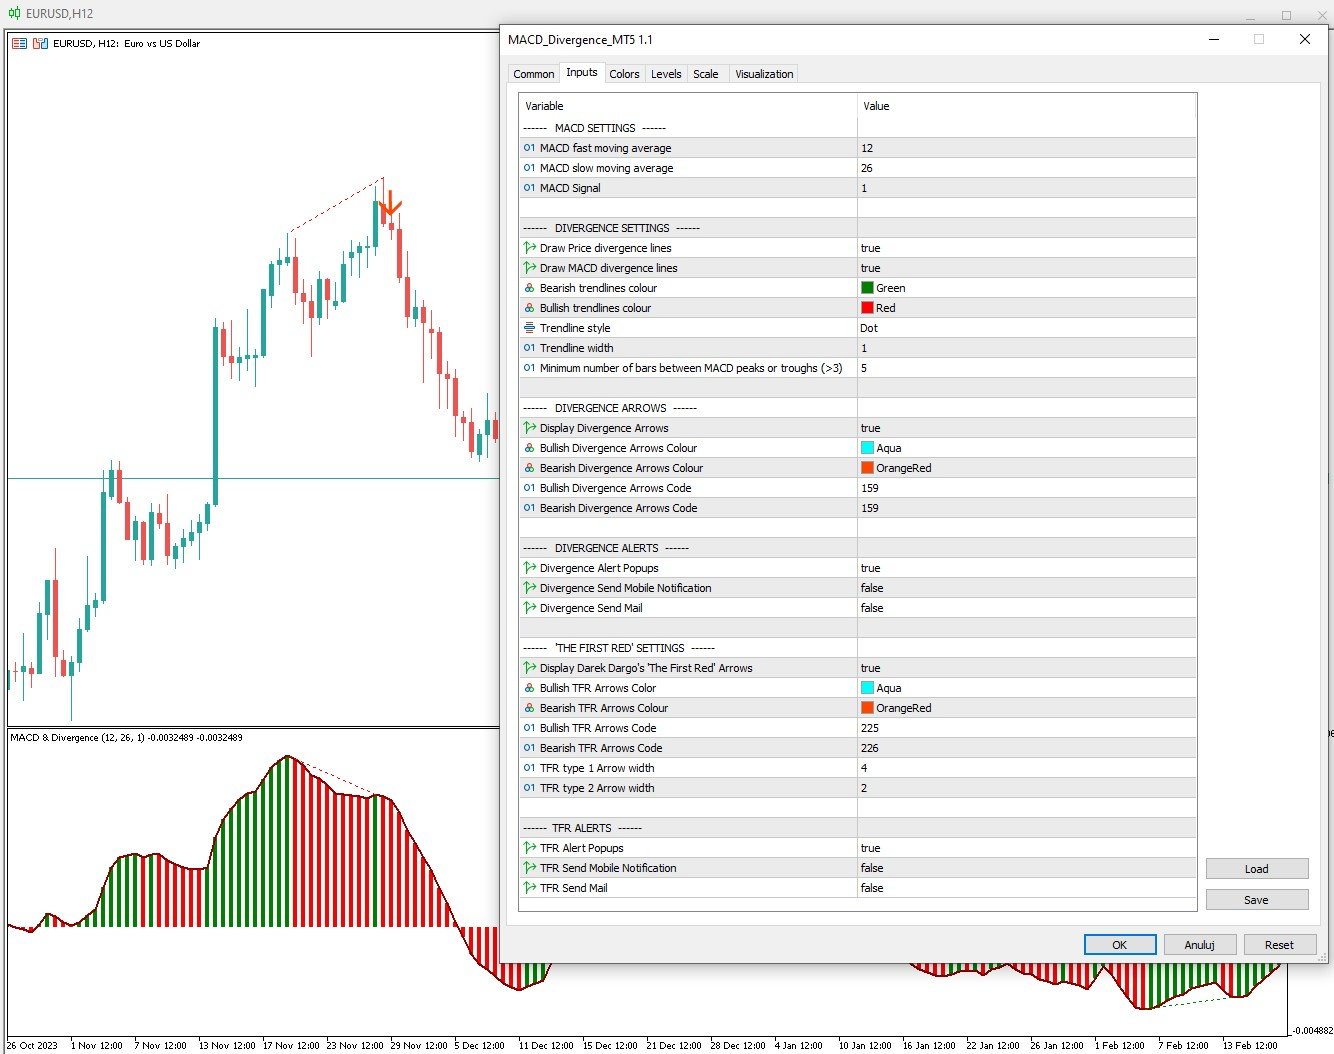
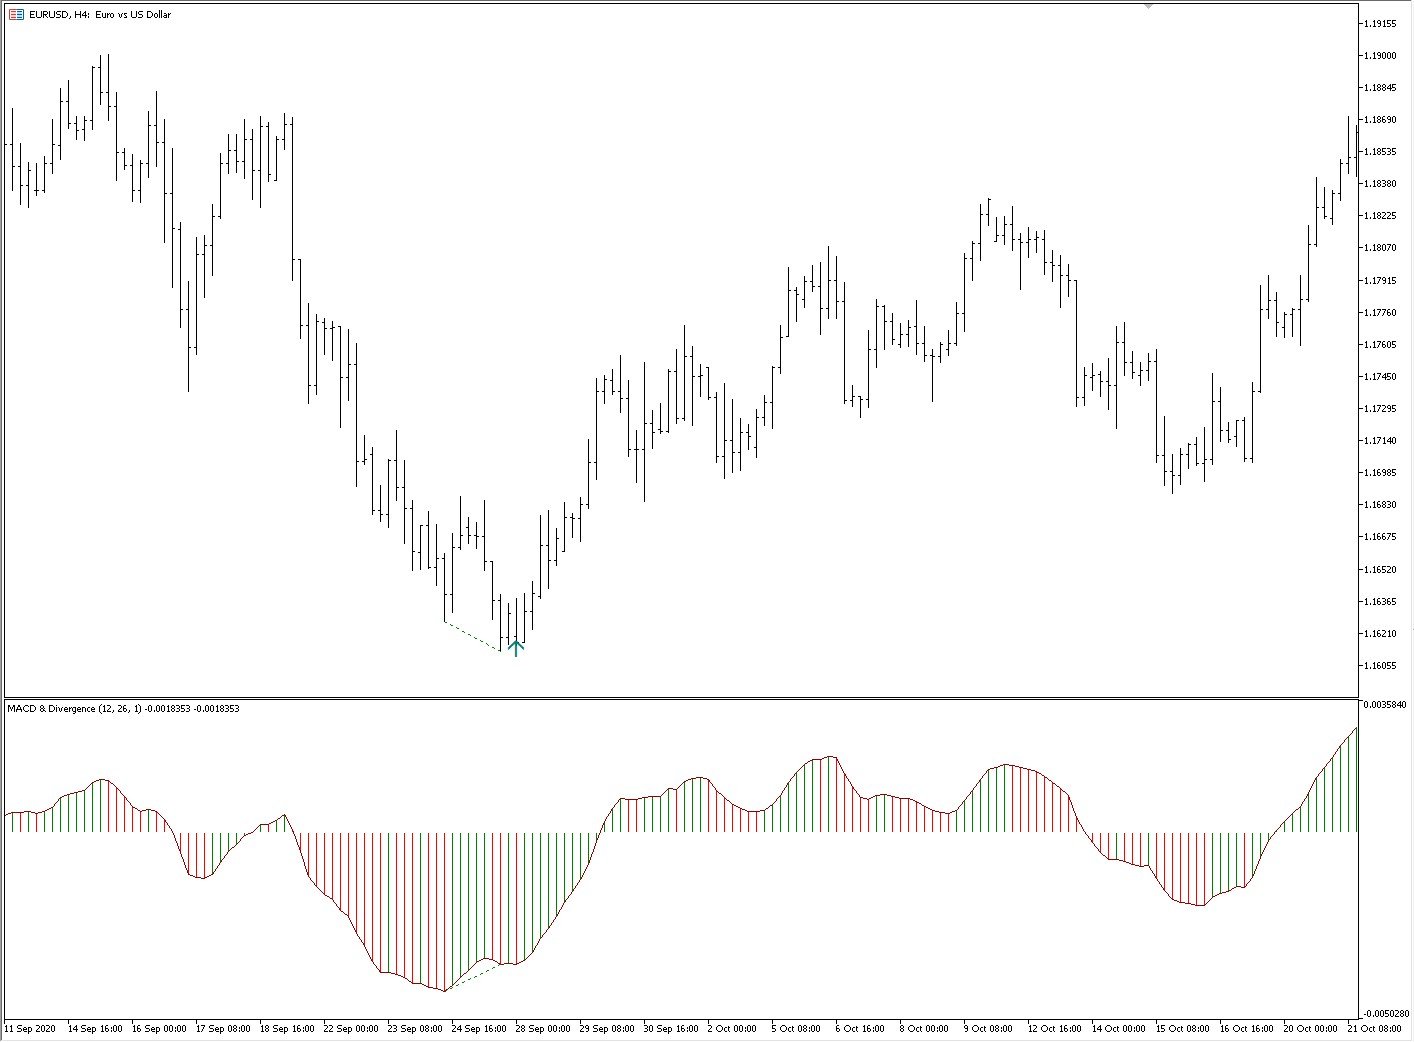
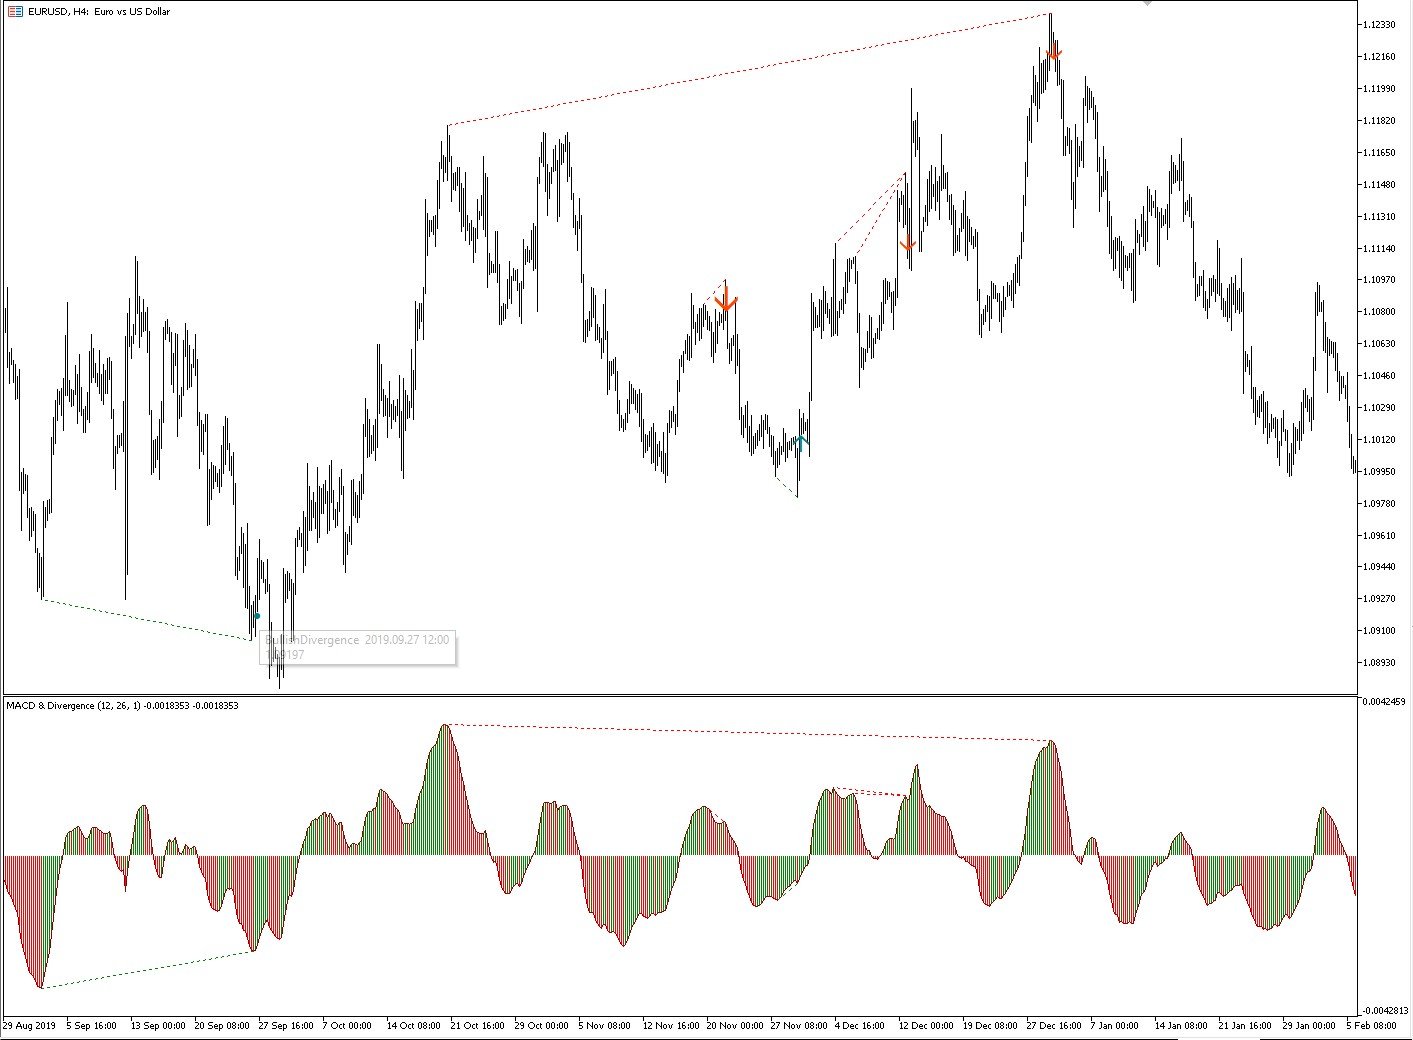
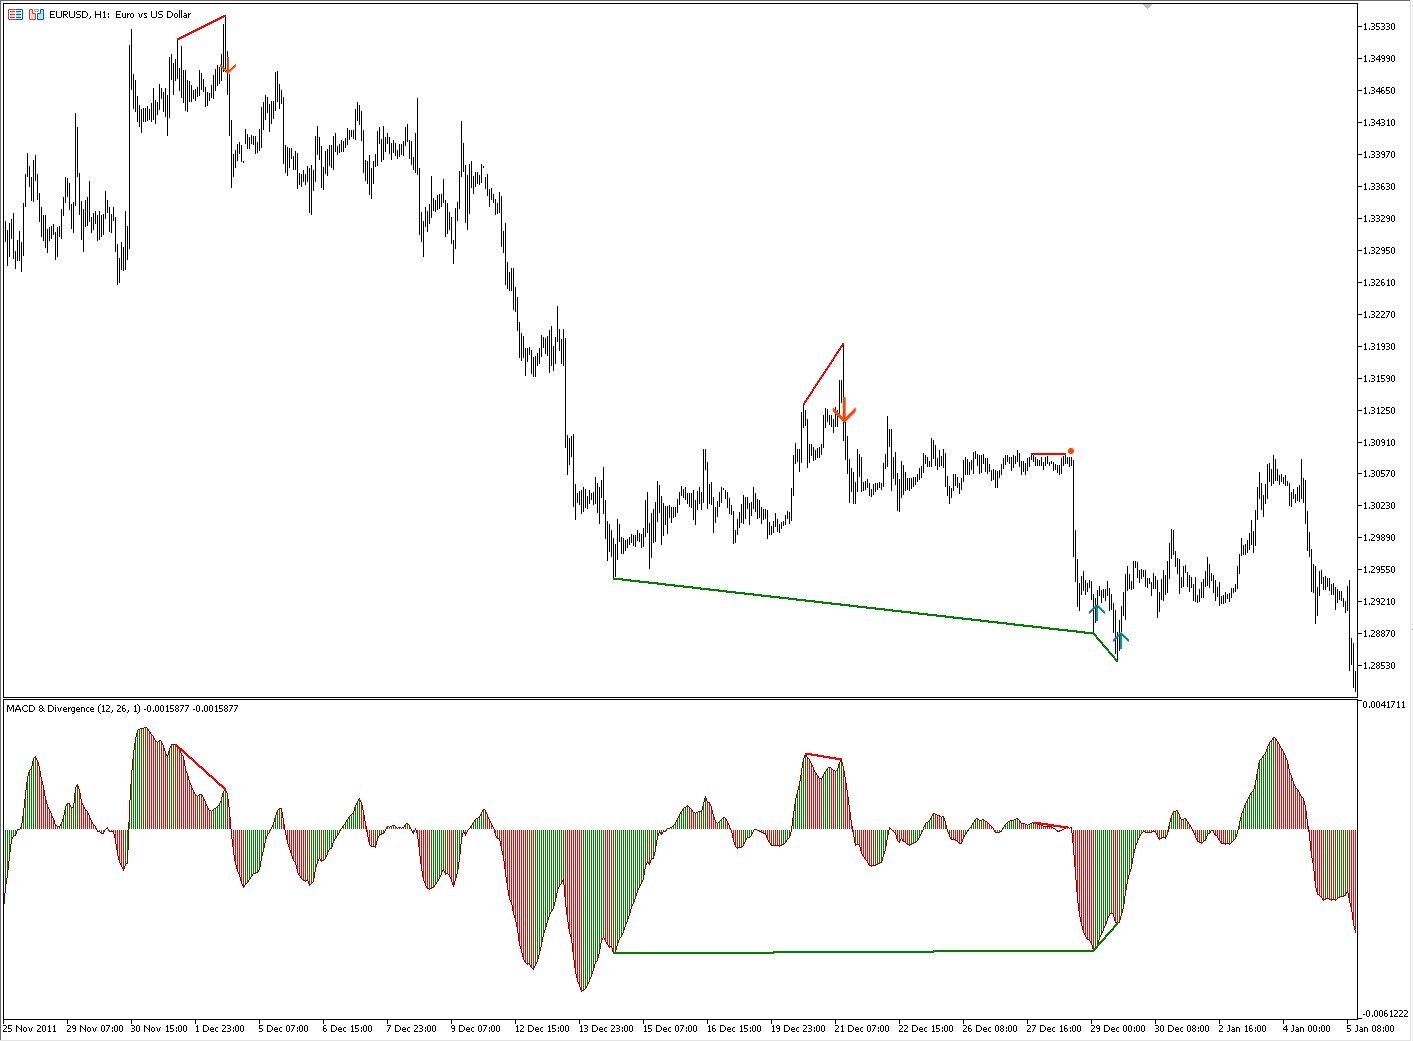
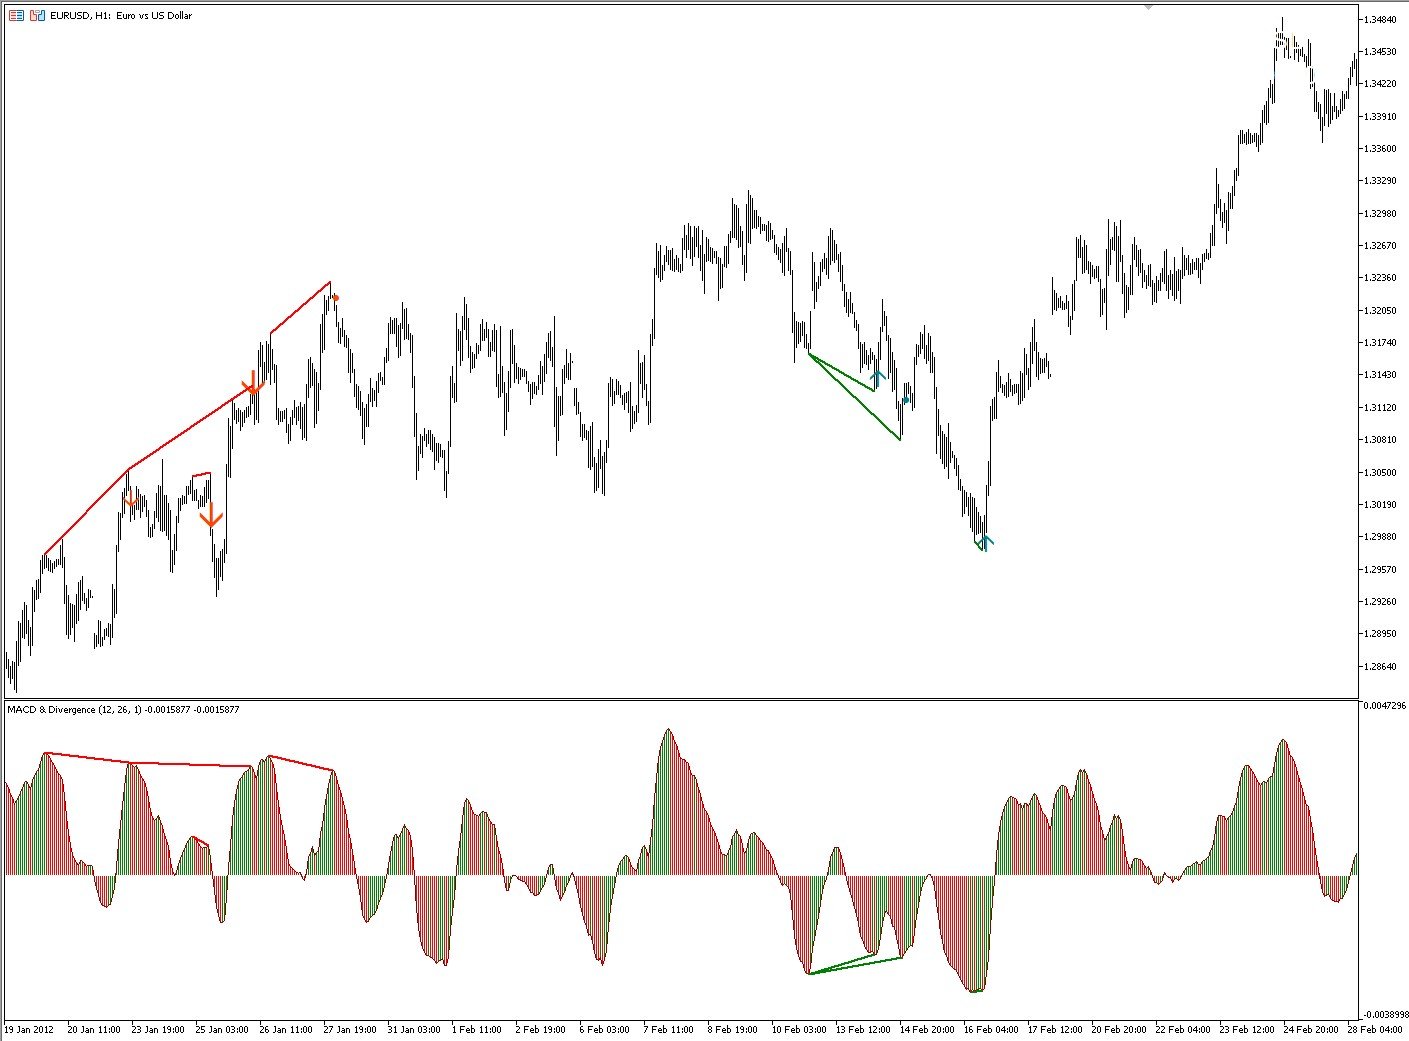
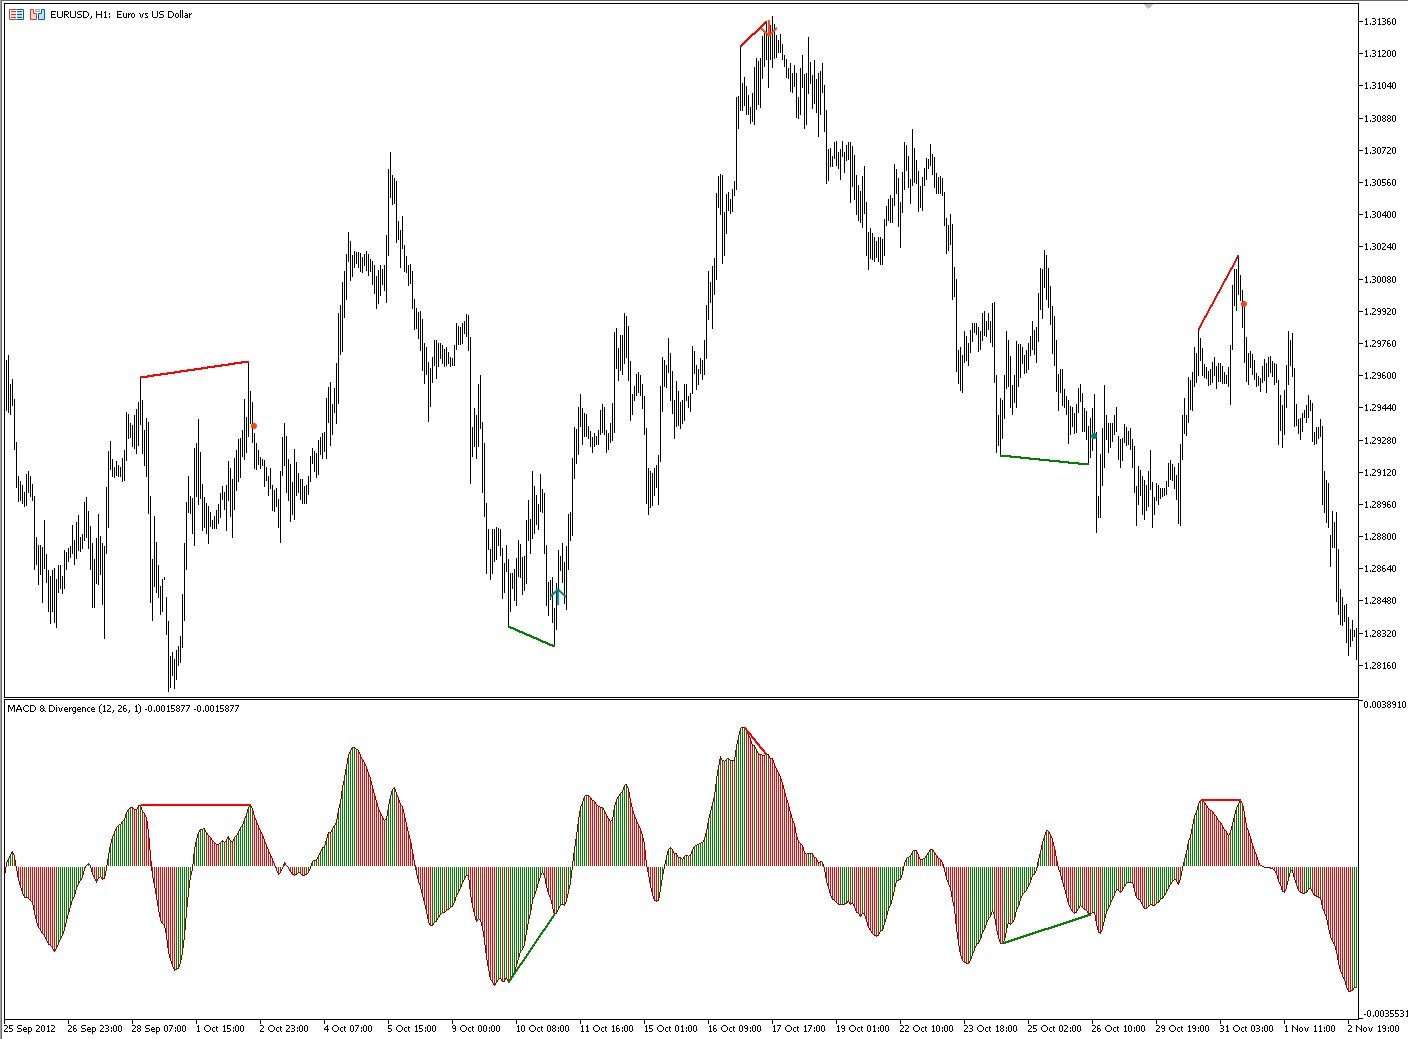
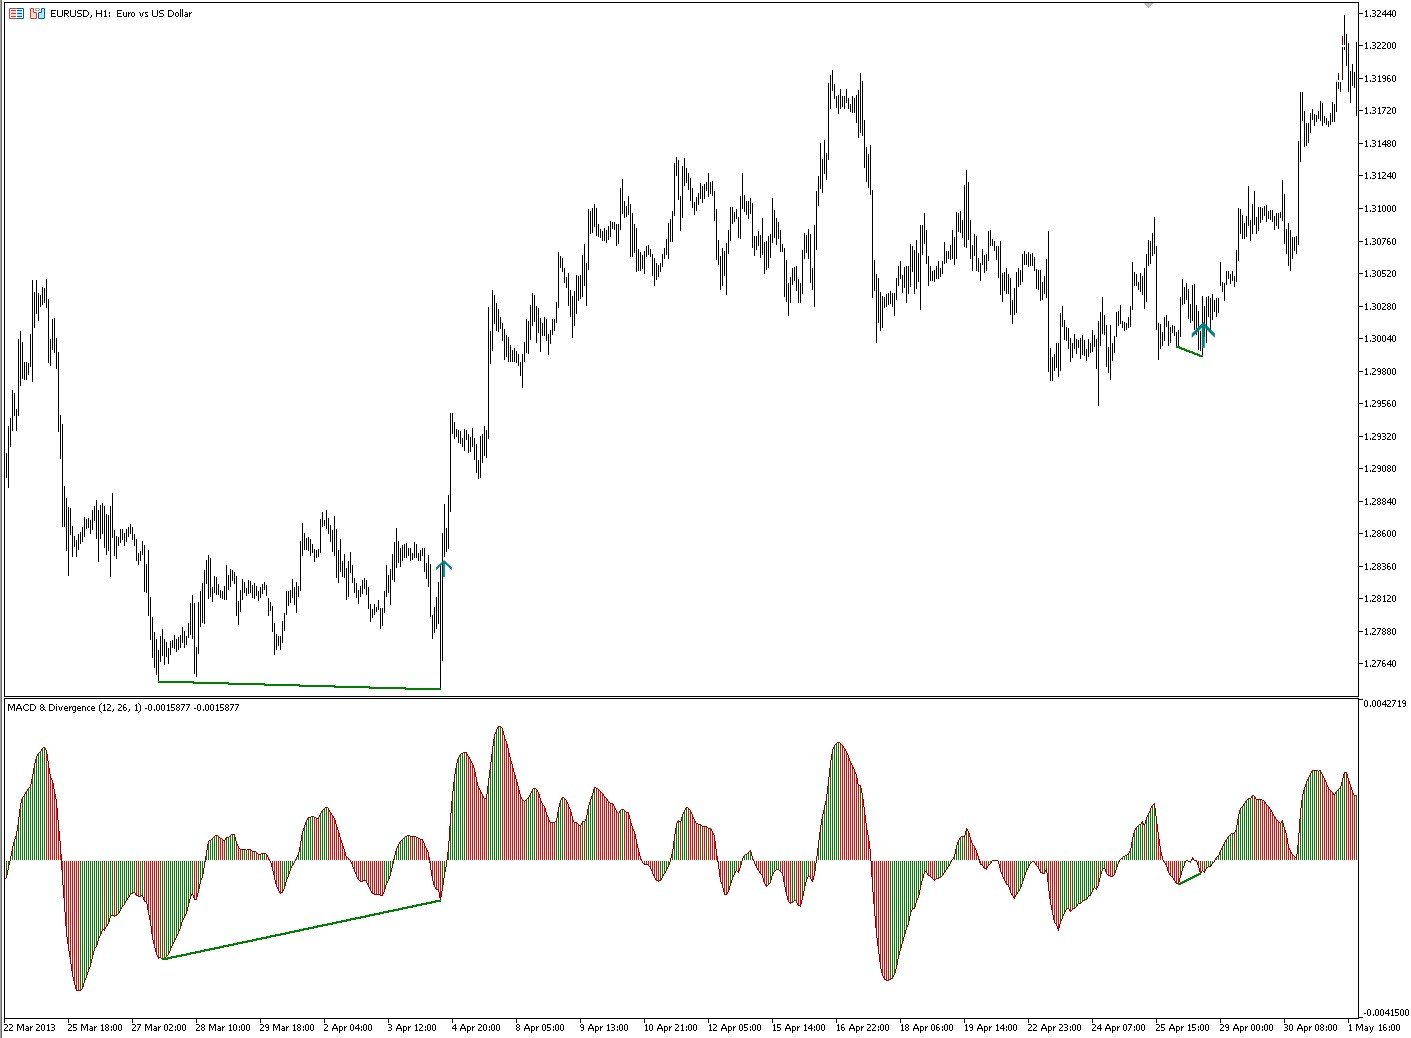
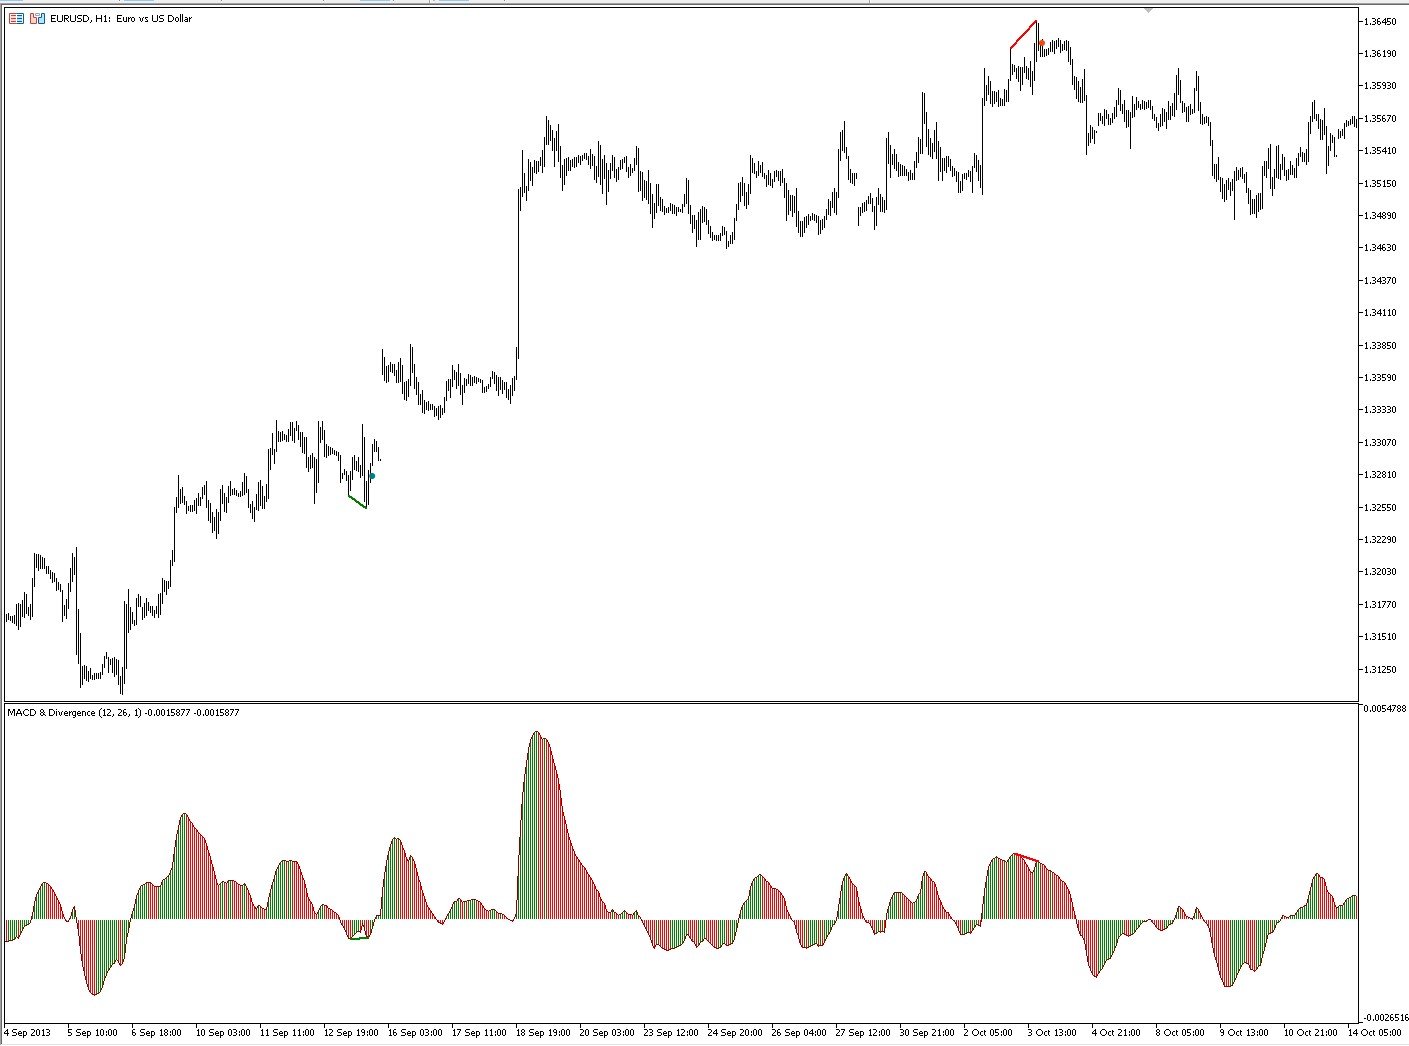
The indicator shows divergence between the slope of lines connecting price and MACD histogram peaks or troughs.
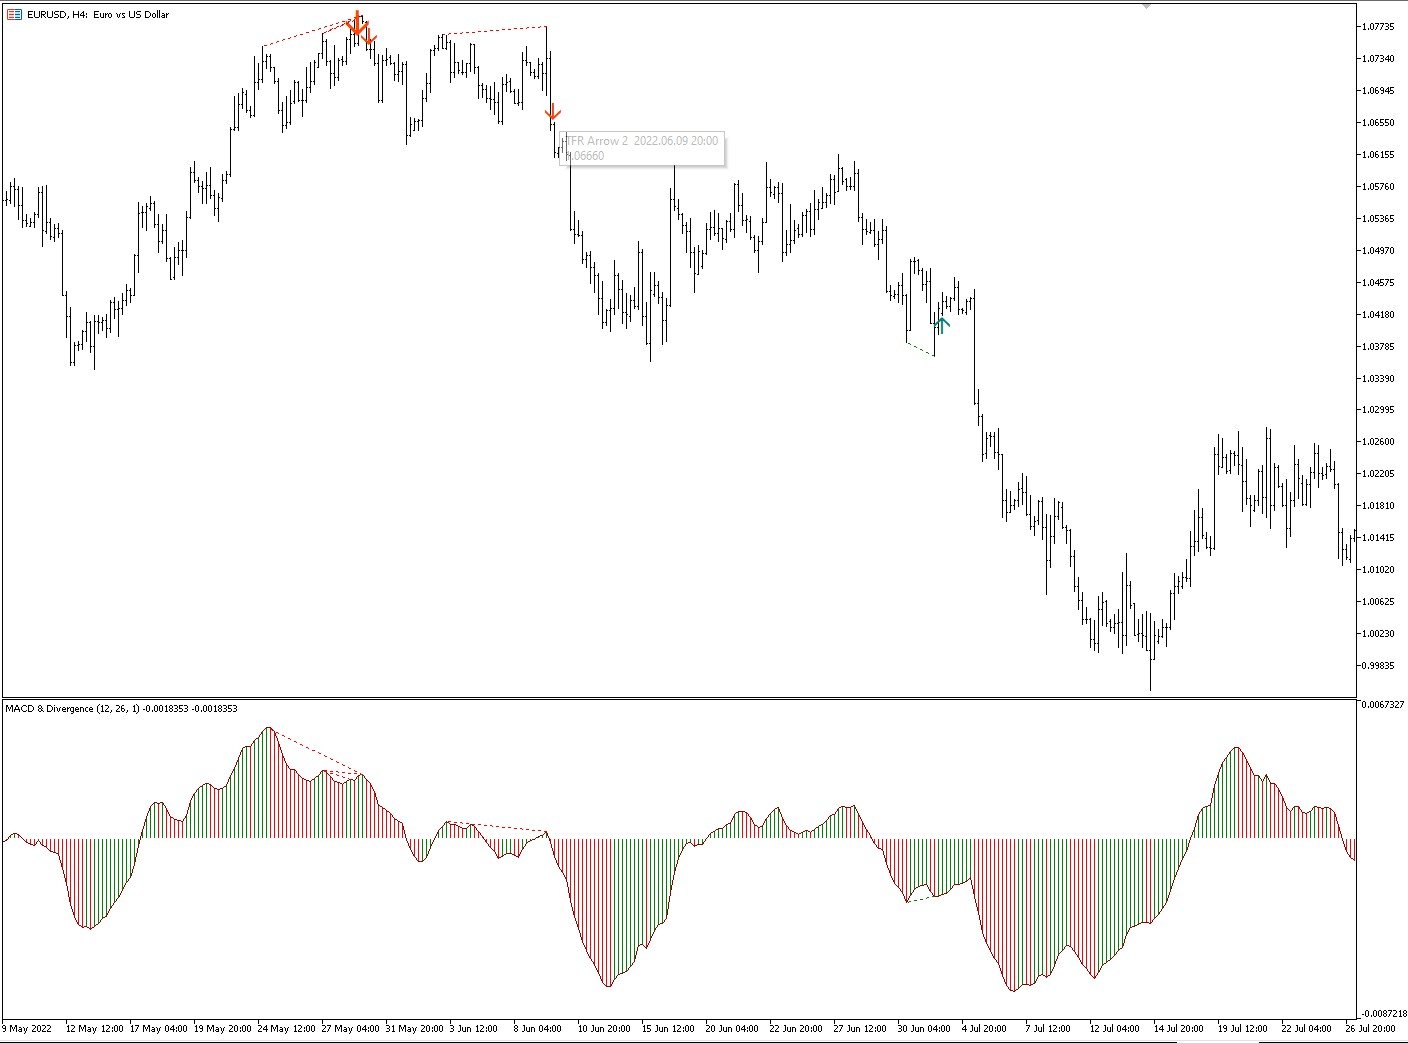
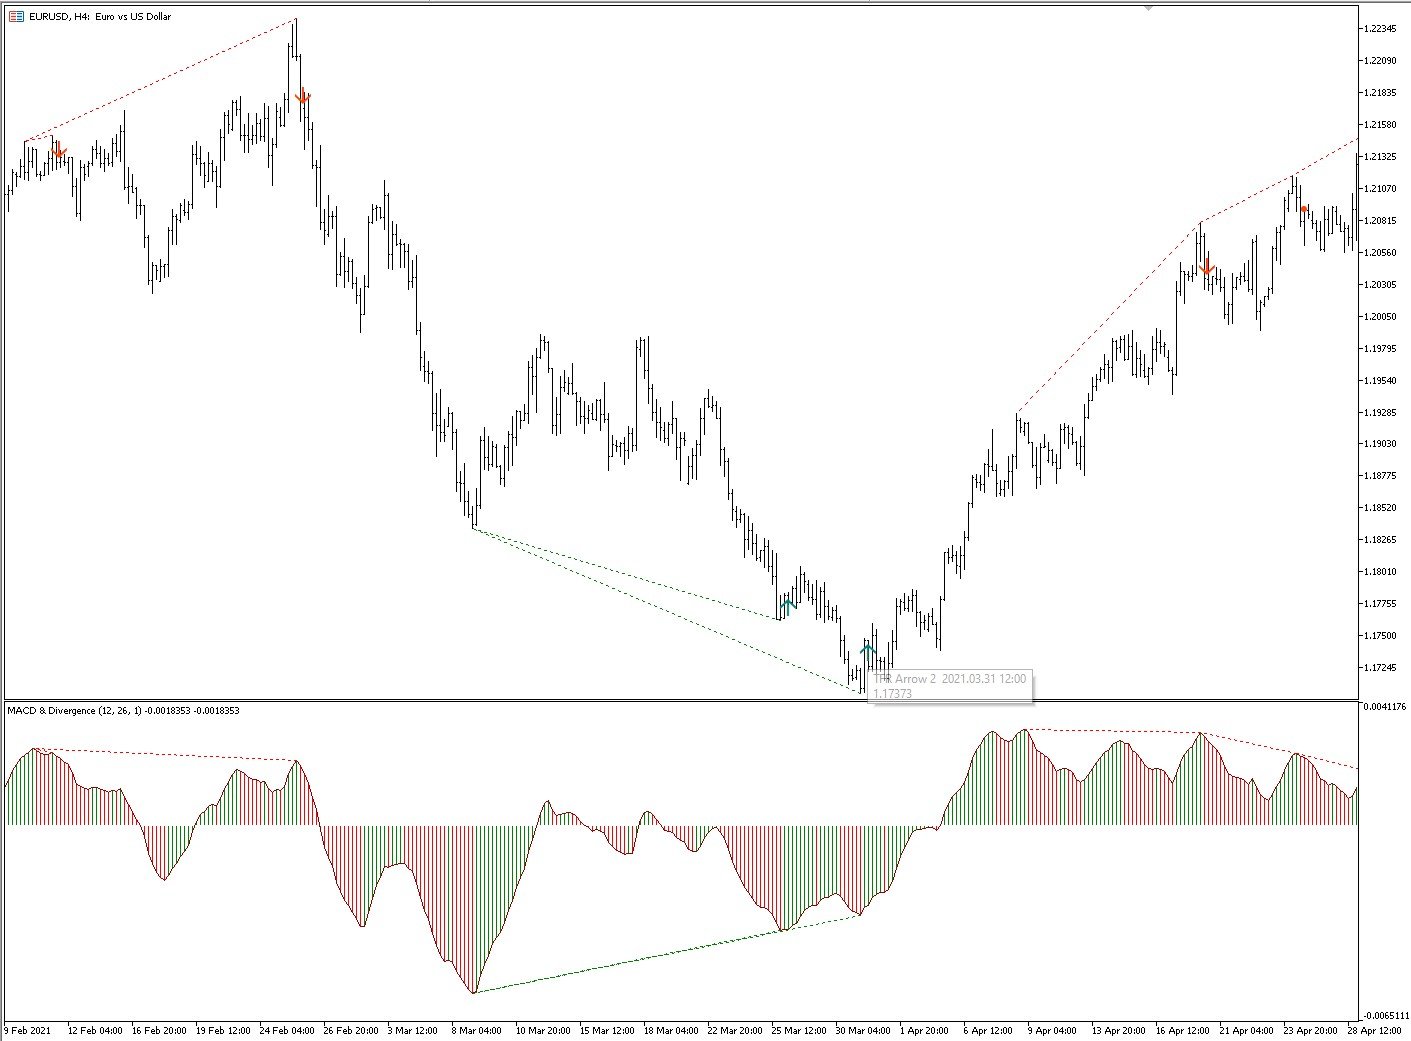
A bullish divergence (actually a convergence) occurs when the lines connecting MACD troughs and the lines connecting the corresponding troughs on the price chart have opposite slopes and are converging. A bearish divergence occurs when the lines connecting MACD peaks and the lines connecting corresponding price peaks have opposite slopes and are diverging.
In such a case, the indicator displays dots located on the chart in the place corresponding to the moment and a price level of the divergence signal occurrence.
The indicator additionally checks whether the divergences are accompanied by a signal related to Darek Dargo’s trading system, called TFR (The First Red). If a divergence and TFR occur together, then the indicator displays directional arrows.
The MACD histogram is two-coloured. The red bar colour occurs when the previous bar was higher. Green when the previous bar was lower. It is assumed that the change of colour from red to green, when the histogram is below the zero line, indicates the moment to consider opening a buying position. Correspondingly, it applies to the moment of sale. Divergence and TFR filter the above signals, reinforcing them.
The MACD histogram in this indicator is a difference of 12 and 26 period exponential moving averages. The signal line does not participate in the pattern.