Semi Log Scale Oscillator Anchored
- インディケータ
- Ryan L Johnson
- バージョン: 1.0
- アクティベーション: 5
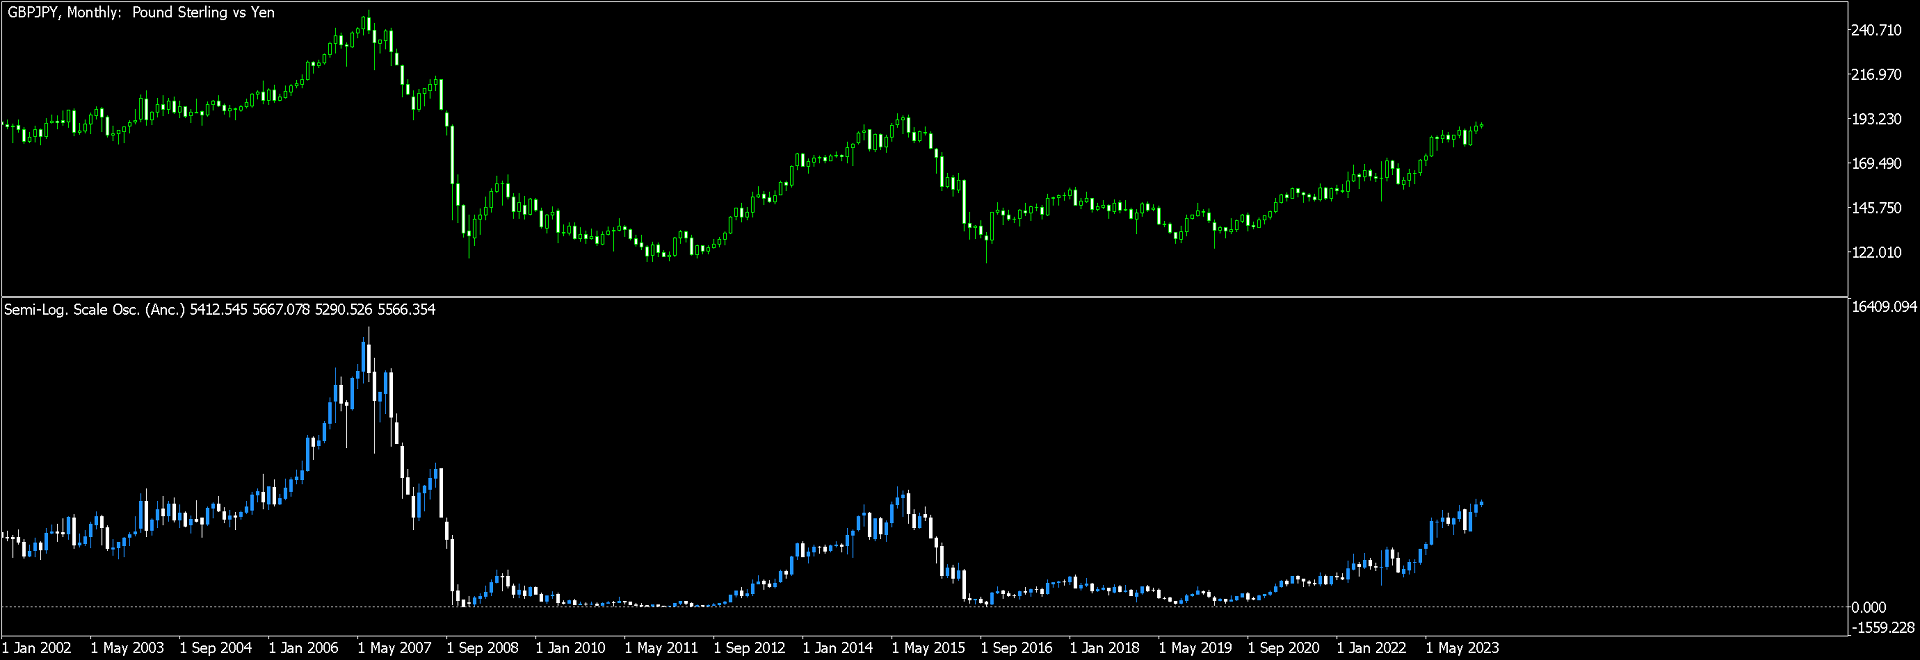
このインジケーターは、固定された片対数スケールのオシレーターです。 対数スケールは、MT5 が価格データをマッピングするのと同じ方法で、時間枠全体で収集された情報をより正確にマッピングするために、プロのデータ サイエンティストによって広く使用されています。 実際、この指標の基礎となるロジックは、海外のバイオテクノロジー科学者から無償で入手したものです。
対数対数グラフでは、x (水平) 軸と y (垂直) 軸の両方に対数値が表示され、通常は上向き、下向き、または平坦な直線が生成されます。 直線は取引市場ではあまり役に立ちません。そのような直線は非常に平滑化されているため、時間の経過とともに表示される実際の価格値は直線の調査から大きく離れているからです。 対照的に、片対数グラフでは 1 つの軸 (通常は y 軸) のみが記録されます。 このような片対数チャートは、時間 (x) 軸が元の形式で維持されると同時に、価格が上昇するにつれて価格増分間の距離が徐々に増加する段階的な y スケールを提供するため、取引市場に適しています。 価格が下がると減少します)。 これにより、低価格のゼロレベルを確立し、より直線的な角度でトレンドを明確に確認し、高価格での増幅された価格スパイクを明確に観察することができます。 したがって、このインジケーターは y 軸のみに片対数スケールを採用します。
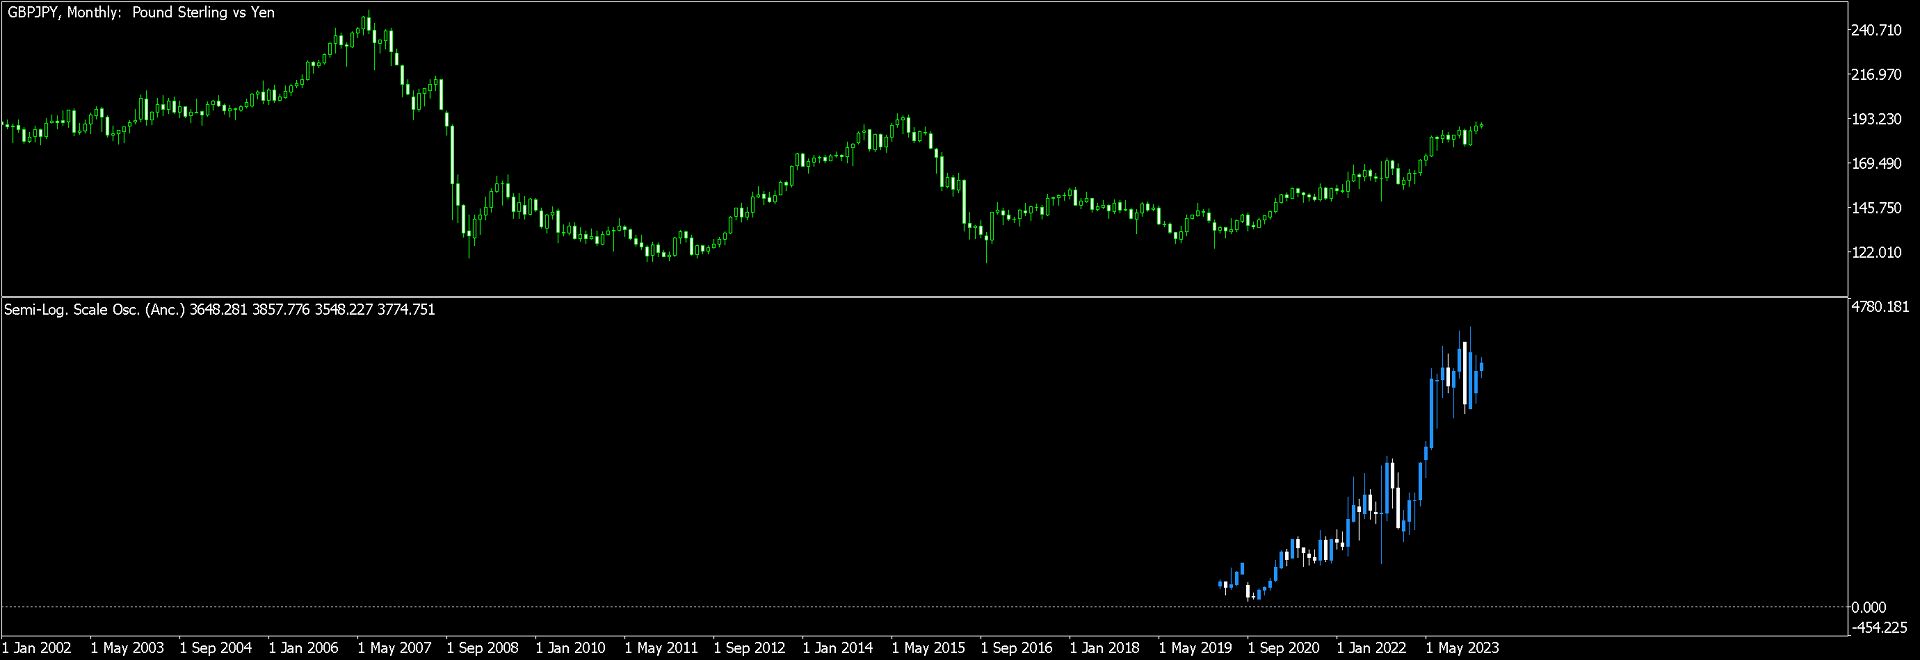
このインジケーターは、価格バーの計算の開始時間を指定できるため、固定されています。 設定は次のとおりです。
Year.Month.Day Hour:Minute - デフォルトは 1970.01.01 00:01 です - デフォルト設定のままにすると、インジケーターは、1970 年が履歴にない場合でも、チャート履歴の最も古い価格バーを自動的に検出します。 インジケーター設定ウィンドウにメモが表示されます。
ログに記録する最初のピップステップのサイズ - デフォルトは 135 です。このデフォルトは MN1 (月次) などのより高い時間枠に適しており、5 は M1 (分) などのより低い時間枠に適しています。 最終的に、最適な設定は、インジケーターをアタッチする時間枠、その時間枠内の価格ボラティリティのレベル、および選択した開始時間によって異なります。 覚えておいてください...片対数式は低値から高値まで計算するため、開始時間は常に大幅な低値でなければなりません。 ここでも、インジケーター設定ウィンドウにメモが表示されます。
「前のインジケーターのデータ」に適用できる標準(組み込み)MT5 インジケーターは、このインジケーターに適用できます。
インジケーター ライン (インジケーター バッファー) は、Expert Advisor ビルダー ソフトウェアまたはカスタム コード化された Expert Advisor で作成された Expert Advisor の iCustom を使用して呼び出すことができます。 対数スケールの始値、高値、安値、終値はバッファです。
空の値はありません。 そして
再塗装は無し。
このインジケーターはライブ市場データがないと読み込まれません。市場は開いている必要があります。
法的免責事項: この投稿のいかなる内容も、取引や投資に関するアドバイスとして解釈されるものではありません。 上記のすべての例は、ここに掲載されているインジケーターの技術的特徴と仮説的な使用法を説明するものにすぎません。