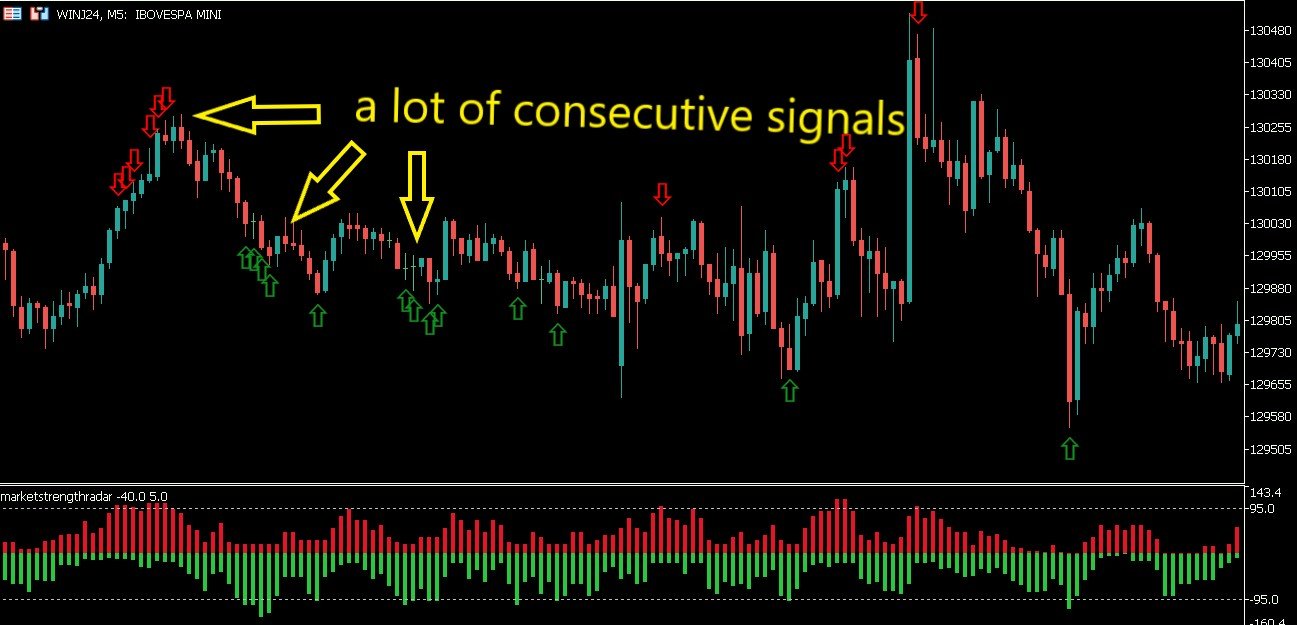
Market Strength Radar
- インディケータ
- OTAVIO AGUIAR CAMPOS Aguiar
- バージョン: 1.0
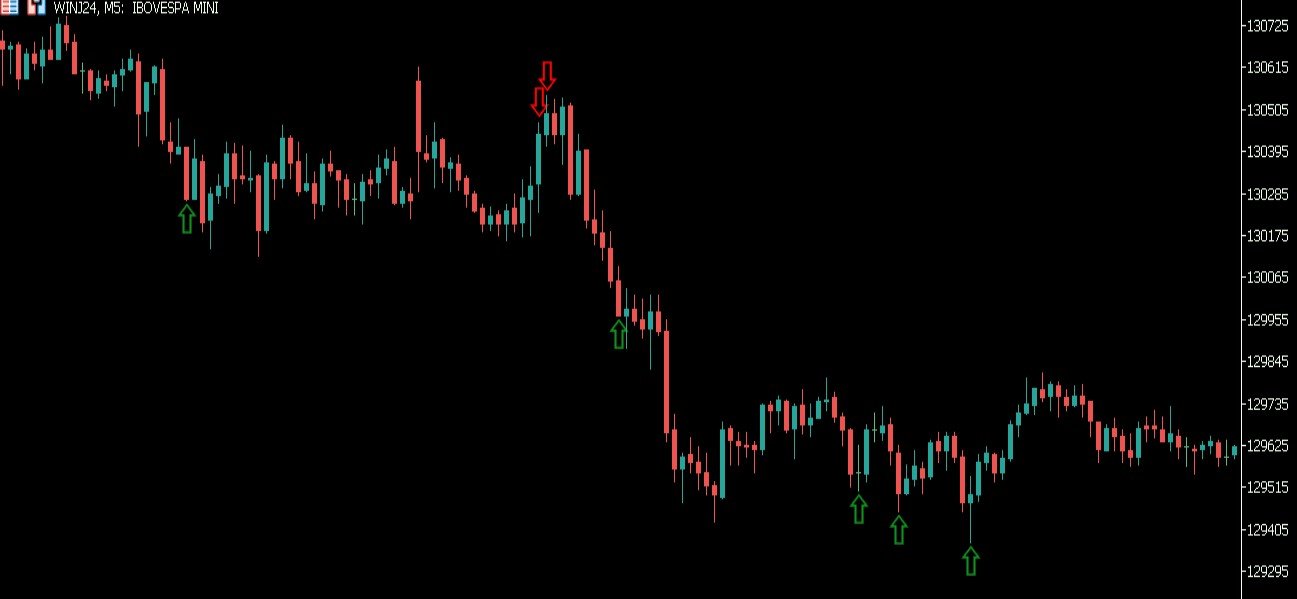
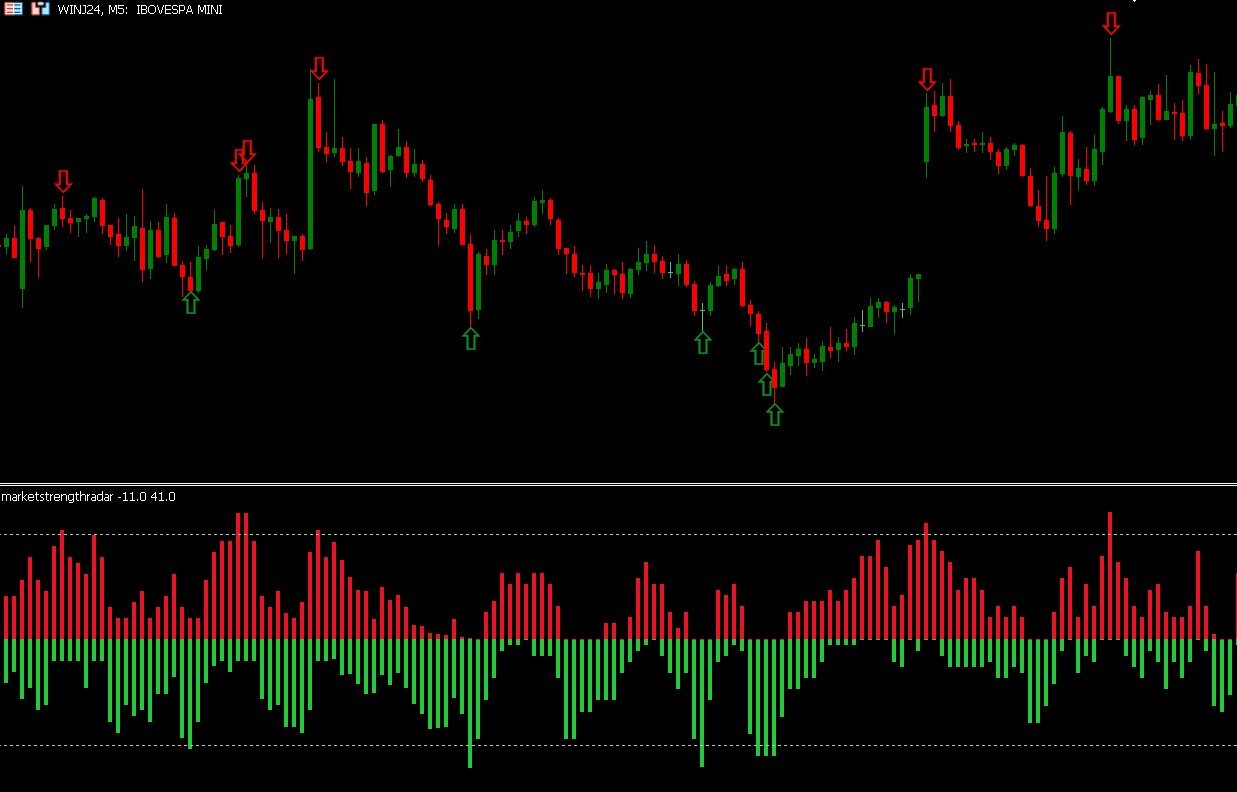
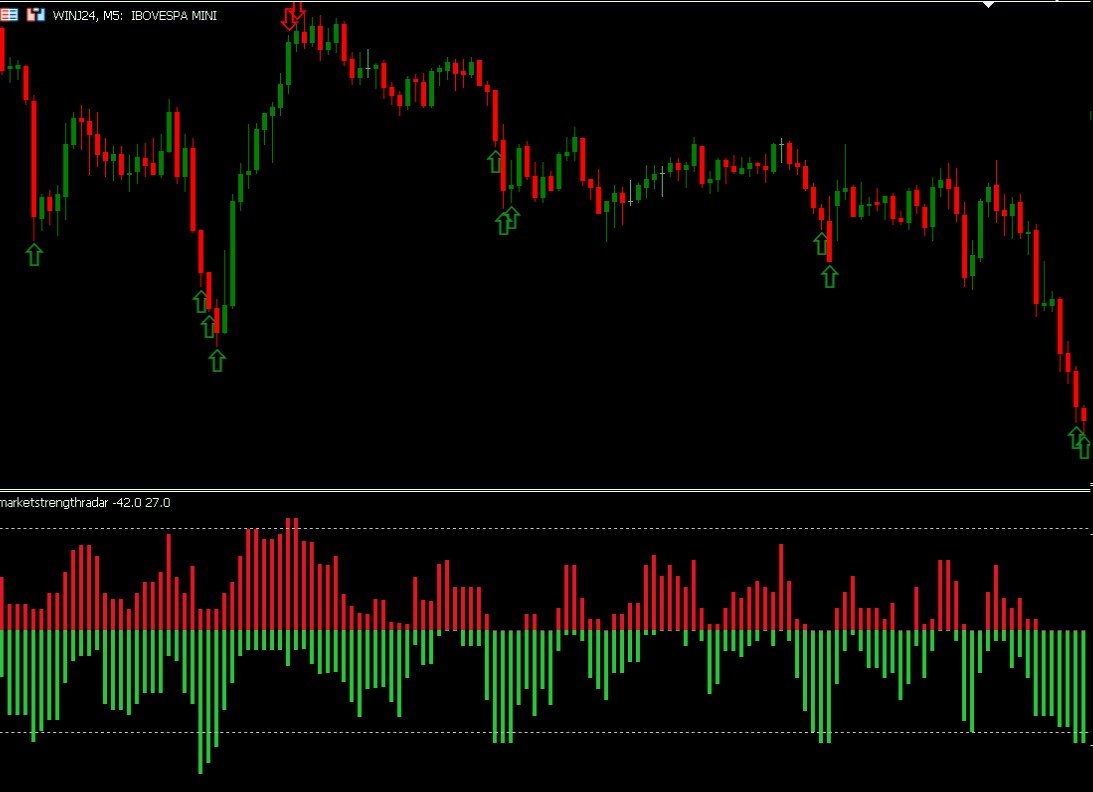
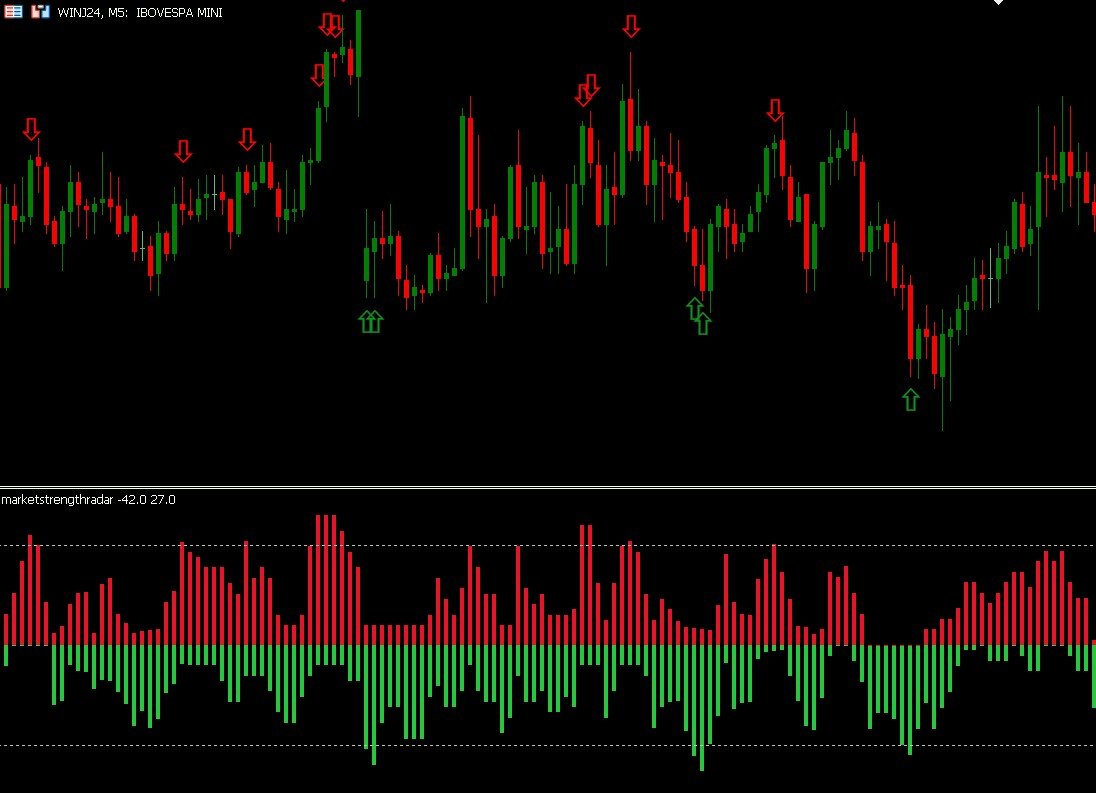
Inicialmente este indicador foi elaborado e pensado para rastrear pontos ou velas onde há força de tendência.
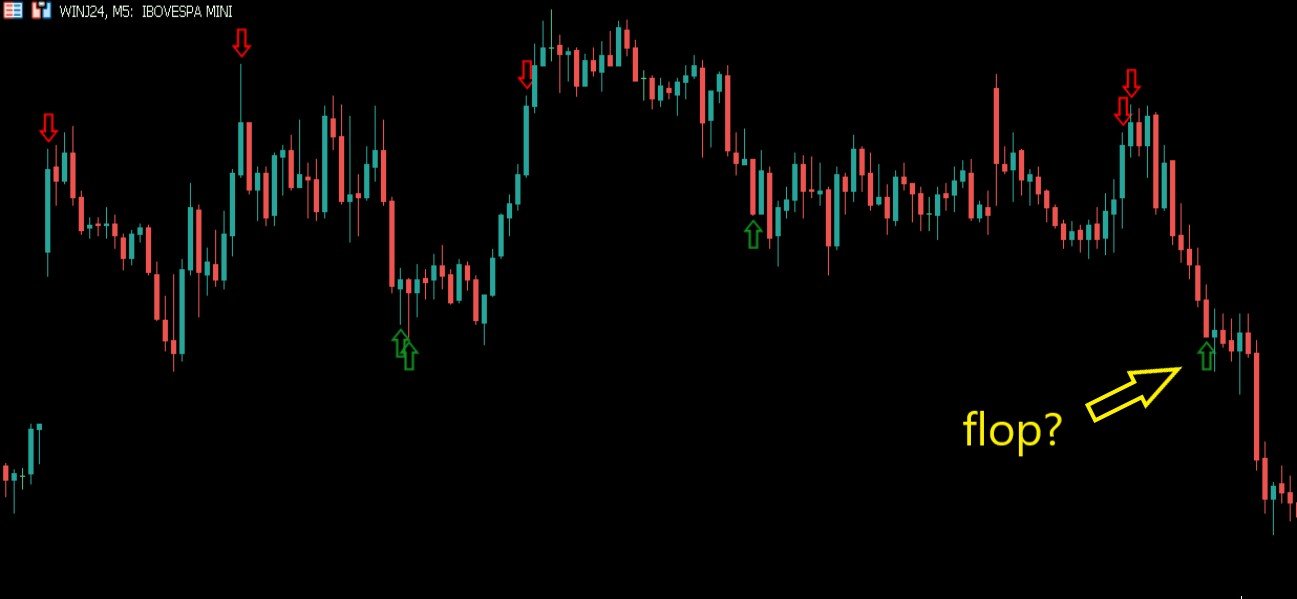
Como nas grandes descobertas, cheguei ao indicador que mostra principalmente velas de reversão, pontos de tensão, alta liquidez, resistência.
O indicador traz simplificação ao gráfico, indicando todos os pontos onde possivelmente teríamos lta´s, ltb´s, médias móveis, bandas, ifr alto.
O indicador não faz o gerenciamento de risco, apenas mostra as velas onde podem ocorrer reversão. Lembrem-se que o sinal não mostra reversão da tendência principal. São pontos de parada, de regressão a média, portanto o gereciamento de risco e trades de scalp podem ser importantes.
Conheça todo o trade system do Radar de Força de Mercado. Vejam nossos vídeos explicativos. Se você comprou o produto entre em contato comigo para receber todos os indicadores do meu Trade System.
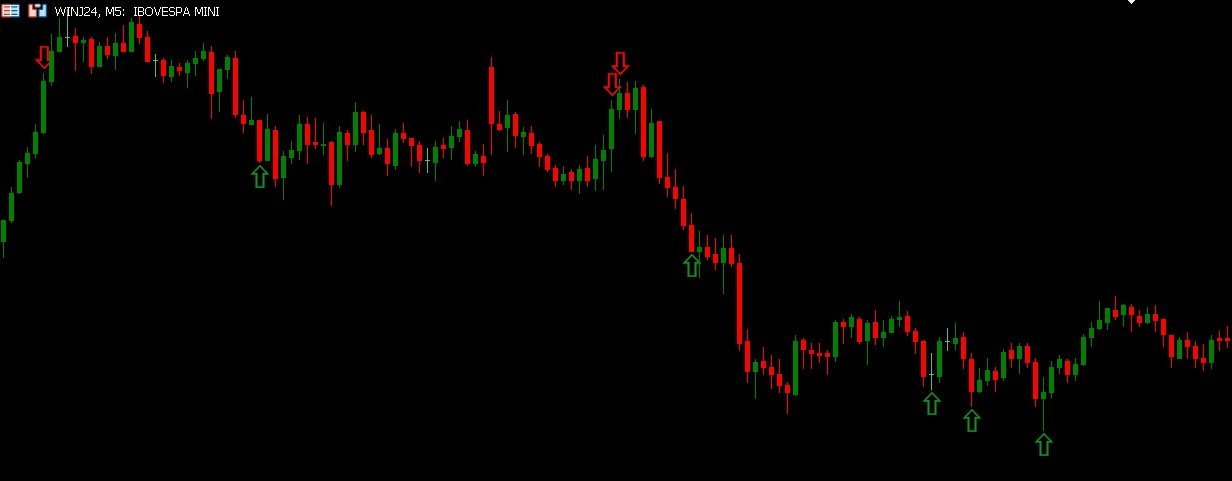
Se desejam um indicador com setas> Market Strength Signal
Parametros:
Definição das médias móveis utilizadas: 200, 144, 72 e 20
Definição do ATR (Average true range): 72
O ATR possibilita que o indicado se adeque a vários mercados e diferentes liquidez.