• 概要
  • レビュー
  • コメント

Midpoint Bands

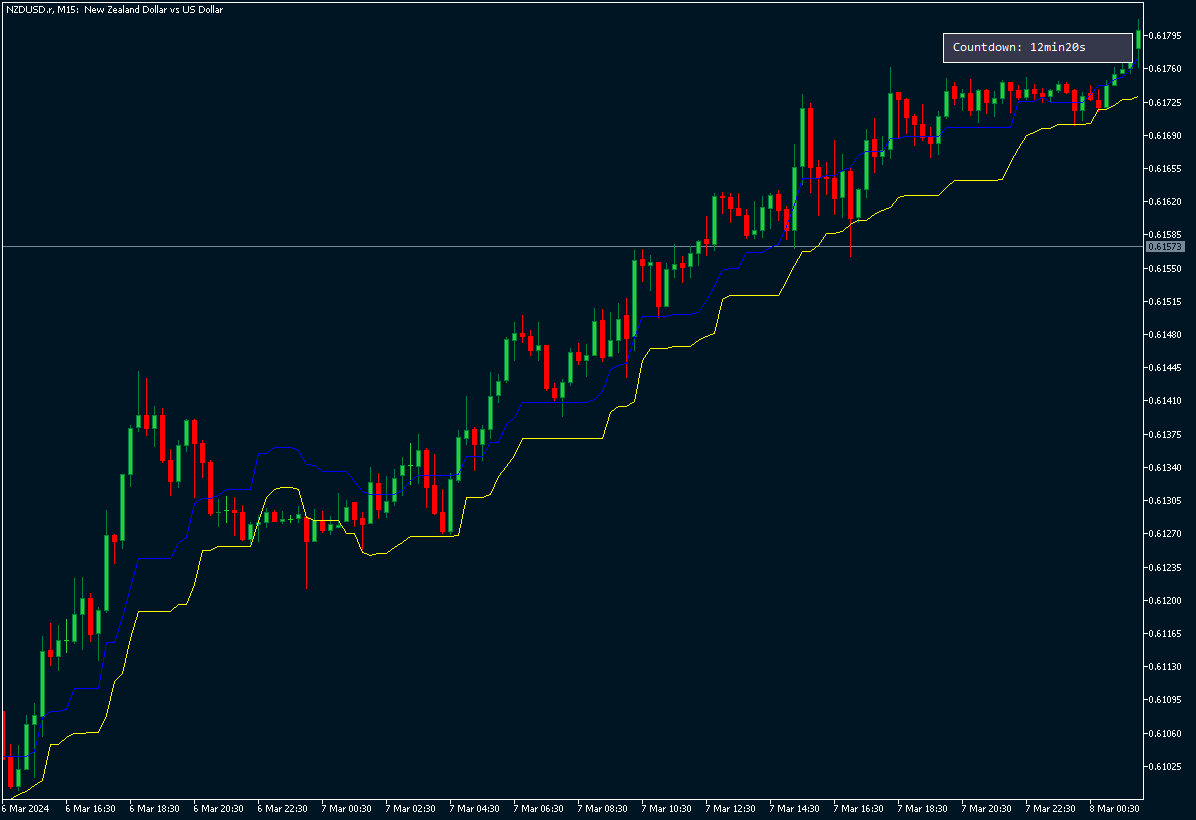
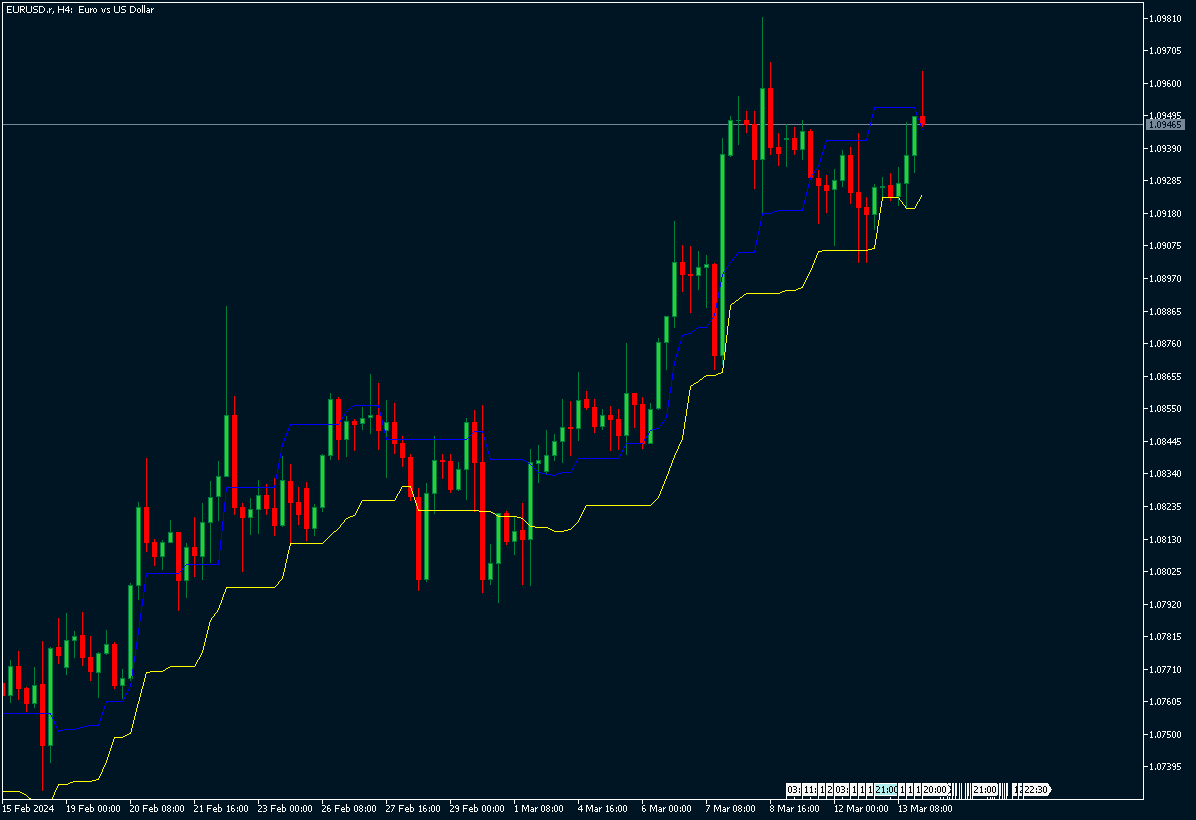
Midpoint Bands is a channel-like indicator that draws two lines on the chart - an upper band and a lower band, pointing out possible reversal levels.


This is one of the indicators used in the Sapphire Strat Maker - EA Builder.


Sapphire Strat Maker - EA Builder: https://www.mql5.com/en/market/product/113907


The bands are simply calculated like this:


Upper Band = (HighestHigh[N-Periods] + LowestHigh[N-Periods])/2 

Lower Band = (LowestLow[N-Periods] + HighestLow[N-Periods])/2

Middle Line = (Upper Band + Lower Band)/2


If you find any bugs, feel free to contact me or leave a comment.


おすすめのプロダクト
Product Description: Adaptive Y-Axis Scaling is a powerful MT5 indicator designed to enhance your trading experience by providing precise control over the Y-axis (price) scaling of your charts. This innovative tool allows you to customize the price scaling by specifying the number of pips from the visible chart's highs and lows. The calculated price range from this input is then used to set the maximum and minimum prices for the open chart, ensuring an optimized and comprehensive view of market
FREE
CYCLE WAVE OSCILLATOR indicator is an indicator based on cyclical price fluctuations. This indicator can help you determine overbought and oversold levels, and help you predict price trends within the cycle. MT4 Version here! You can combine it with our indicators below to make your trading decisions more accurate: Supply Demand Ribbon MT5 Basic Feature: - Three Trend Types: + Zero + Basic + Advanced
FREE
VWAP Cloud
Flavio Javier Jarabeck
4.22 (9)
Do you love VWAP? So you will love the VWAP Cloud . What is it? Is your very well known VWAP indicator plus 3-levels of Standard Deviation plotted on your chart and totally configurable by you. This way you can have real Price Support and Resistance levels. To read more about this just search the web for "VWAP Bands" "VWAP and Standard Deviation". SETTINGS VWAP Timeframe: Hourly, Daily, Weekly or Monthly. VWAP calculation Type. The classical calculation is Typical: (H+L+C)/3 Averaging Period
FREE
If you like to use traditional Moving Averages (like SMAs and EMAs) to provide your trades for dynamic levels of Support and Resistance, you will love the Adaptive Moving Average (AMA). Created in 1995 by Perry Kaufman and presented to the world in his book " Smarter   Trading :  Improving   Performance   in   Changing   Markets ", the Adaptive Moving Average (also known as KAMA - Kaufman Adaptive Moving Average) has the goal to be the perfect companion for following a trend without noise, but s
FREE
O indicador criado por Didi Aguiar, o mestre das Agulhadas! O padrão do indicador é o cruzamento de três médias móveis simples. Média rápida, período 3. Média normalizada, período 8. Média lenta, período 20. Quando as três médias se cruzam próximas o suficiente, acontece a agulhada! Pela posição das médias é possível identificar: Agulhada de compra, agulhada de venda, ponto falso e beijo da mulher aranha. Quer saber mais? Procure pelo site dos robôs oficiais da Dojistar: tradesystembots.co
FREE
The Indicator indicator draws 2 clouds based on Envelopes indicator values. The upper cloud is formed by the upper lines values and the lower cloud by the lowers lines values. The indicator allows to change the Envelopes parameters and the clouds colors the period of the base line and the deviations of each Envelopes instance. The indicator holds 5 buffer index as follow: [0] - Outer values of the upper cloud [1]  - Inner values of the upper cloud [2]  - Base/Center line values [3]  - Inner valu
FREE
ForExp1
Mikhail Sergeev
5 (1)
Удобный трендовый индикатор. Не меняет своих значений. Имеет огромные возможности для настройки. Не требователен к ресурсам компьютера. Создавался для работы в системе BearsHunter. Эксперт МТ5 с использованием данного индикатора: https://www.mql5.com/ru/market/product/30381 Эксперт МТ4 с использованием данного индикатора: https://www.mql5.com/ru/market/product/30383 Параметры: m1_MA_Mode_1 - метод усреднения(0-9). m1_MA_Mode_2 - метод усреднения(0-9). m1_MA_Mode_3 - метод усреднения(0-9). m1
FREE
Adaptive Trend Lines
Henri Salvatore Bigatti
4.71 (21)
This indicator shows the TLH and TLL and some trendlines that allow us to estimate the trend of market.  It also shows the values of the angles of the lines in percentage in points (pip) , the standard deviation, and the trend of each line, and when it breaks the lines of support and resistance (TLH and TLL). And finally, it also shows the points identified as supports and resistances through the fractal algorithm in the graph. The high and low trend lines are supported by the highs and lows, th
FREE
Tillson's T3 moving average was introduced to the world of technical analysis in the article ''A Better Moving Average'', published in the American magazine Technical Analysis of Stock Commodities. Developed by Tim Tillson, analysts and traders of futures markets soon became fascinated with this technique that smoothes the price series while decreasing the lag (lag) typical of trend-following systems.
FREE
Rejection Zones
Paulo Henrique Faquineli Garcia
Este poderoso indicador analisa o gráfico e mostra zonas de Rejeição de Preços! Isto é, locais onde o preço foi, mas não foi aceito pelo mercado! A visualização desta zona de Rejeição, facilita o entendimento do trader na tomada de decisões de onde operar e como operar! O indicador é composto por 4 linhas, sendo classificadas em 2 grupos: Linhas Vermelha e Amarela: Denotam os extremos onde o preço conseguiu chegar, mas não foi aceito! Linhas Laranja e Azul: A partir delas, denotam o Início da
FREE
T he most   Flexible   &   Reliable   Trend-Based Fibonacci indicator   by Safe Trading. This indicator helps you calculate Trend-Based Fibonacci levels base on   the main and retracement trends to predict future price . If you just looking for a simple Fibonacci Retracement indicator, please use  this Free indicator . ### FEATURES ### Auto-calculate up to 7 Trend-Based Fibonacci levels on adjustable frame. Adjust Fibonacci levels as your need. Adjust the start and the end of calculated frame
FREE
This indicator uses a different approach from the previous version to get it's trendlines. This method is derived from Orchard Forex, and the process of making the indicator is demonstrated in there video   https://www.youtube.com/watch?v=mEaiurw56wY&t=1425s . The basic idea behind this indicator is it draws a   tangent line   on the highest levels and lowest levels of the bars used for calculation, while ensuring that the lines don't intersect with the bars in review (alittle confusing? I kno
FREE
Trendy Stocks
Innovicient Limited
5 (2)
Trendy Stock is a price following indicator that uses Stochastic to show when the price is out of the oversold or overbought areas.  The algorithm allows you to stay longer in a trend where the bulls or bears are in control. The indicator changes color immediately the price exits oversold/overbought state. In short, the downtrend [red] bars start to paint when the buying pressure decreases while the uptrend [green] bars form as the buy pressure kicks in.    For MT4 version, follow :: https://www
FREE
Rule Plotter Expert
Francisco Gomes Da Silva
5 (3)
この専門家アドバイザーは、 Rule Plotter インジケーター内で作成された戦略をテストおよび実行するために設計されています。 使用方法: Rule Plotter - プログラミング不要のトレードシステムを作成するツール を無料でダウンロードしてください。 次に、Rule Plotter インジケーターで戦略を開発してください。 最後に、この専門家アドバイザーを使用して作成した戦略を実行してください。 パラメータ: Strategy : Rule Plotter インジケーター内で作成したトレードシステムです。 Lot: 取引量。0に設定すると、専門家アドバイザーは最小取引量で取引します。 Take: 利益を取るティック数。0に設定すると、取引に利益を取らないことを意味します。 Stop: 損失を止めるティック数。0に設定すると、取引に損失を止めないことを意味します。 Magic ID: このパラメータを使用すると、同じアセットでこの専門家アドバイザーの複数のバージョンを実行でき、Magic ID番号だけを変更すればよくなります。 新しいプロジェクトを公開したときに通知を受ける
FREE
Quarter EMA
Jithin Sajan Sajan
5 (2)
Kindly rate and comment about the product for upgradation & Support The 5 EMA is plotted in green color ( Lime ). The 14 EMA is plotted in red color ( Red ). The 20 EMA is plotted in blue color ( Blue ). The 200 EMA is plotted in yellow color ( Yellow ). The Quarter EMA that provided calculates and plots four Exponential Moving Averages (EMAs) on the chart using different periods: 5, 14, 20, and 200. Each EMA is represented by a different color on the chart. Here's a description of each
FREE
Kindly rate and comment about the product for upgradation & Support The   5 EMA   is plotted in   green   color ( Lime ). The  14 EMA  is plotted in  red  color ( Red ). The   20 EMA   is plotted in   blue   color ( Blue ). The  200 EMA  is plotted in  black  color ( Black ). The   200 EMA   is plotted in   yellow   color ( Yellow ). The Quarter EMA that provided calculates and plots four Exponential Moving Averages (EMAs) on the chart using different periods: 5, 14, 20, and 200. Each EMA
FREE
Tomamos 5 medios móviles las unimos en una la cual suavizamos y volvemos a suavizar, resultando un mega suavizador de medios móviles suavizadas. Indicador de mql5 funciona en cualquier broker y para todos los tiempos, siendo el mas optimo el de 5, 15 a mas. Funciona mejor en grupo consigo misma osea poner uno de 14 y otro de 50 y 400,, así se observa mejor su desempeño.
BREAKOUT-SESSION-BOX ASIA LONDON/EU US watch the expectation of a volatile movement above or under the opening range We take the high of the range as Entry for a long trade and SL will be the low of the range and vs. the low of the range as Entry for a short trade and the high for SL The size of the range is the distance to the TP (Take Profit) The range of the opening hours should not be larger than about 1/3 of the average daily range 3 breakout examples are already predefined: Asia, London/E
FREE
The Indicator indicator draws 2 clouds based on Bollinger Bands indicator values. The upper cloud is formed by the upper lines values and the lower cloud by the lowers lines values. The indicator allows to change the Bollinger Bands parameters and the clouds colors the period of the base line and the deviations of each Bollinger Bands instance. The indicator holds 5 buffer index as follow: [0] - Outer values of the upper cloud [1]  - Inner values of the upper cloud [2]  - Base/Center line values
FREE
VWAP Bands Indicator
Hilario Henrique Silva Ribeiro
4.71 (14)
Do you know VWAP Bands? It is an indicator used to identify support and resistance points from the daily VWAP and you can use it to check the best entry and exit points. This indicator does not use the principle of bollinger bands. There is a difference in the calculation method. Use it according to your strategy. See the applications and what results you can get. The indicator is free and can be used on any account.
FREE
The Point-Percent Price Channel (PPPC or PP Price Channel) indicator is designed to display on the chart a channel whose width is specified both as a percentage of the current price and in points. Its appearance is presented on slide 1.             When the market moves up, the upper border of the channel is built at the price of High candles. In this case, the lower boundary follows the upper one at a strictly specified distance. When the price touches the lower border of the channe
FREE
Cybertrade Keltner Channels - MT5 Created by Chester Keltner, this is a volatility indicator used by technical analysis. It is possible to follow the trend of financial asset prices and generate support and resistance patterns. In addition, envelopes are a way of tracking volatility in order to identify opportunities to buy and sell these assets. It works on periods longer than the period visible on the chart. All values ​​are available in the form of buffers to simplify possible automations.
FREE
The Graphic Alignment Context (GAC) Technical Indicator measures the vertical difference of the simple average price of a financial instrument in the context of three different timeframes determined by a defined number of bars or candles (periods) to determine the strength of the buy or sell trend. sale. Ascending average prices indicate Buying strength (1), Descending average prices indicate Selling strength (-1) and any scenario different from the previous two conditions indicates Neutrality
FREE
指数移動平均(ダブルまたはトリプル)エンベロープインジケーターは、金融市場でのトレンドと潜在的な反転ポイントを特定するのに役立つ技術分析ツールです。このインジケーターは、トレーダーがダブル指数移動平均(DEMA)またはトリプル指数移動平均(TEMA)の2つのタイプの指数移動平均から選択できる柔軟性を提供します。 主要な特徴: ダブルまたはトリプル指数:DEMAとTEMAを選択して、分析の好みやニーズに基づいて切り替えます。 カスタマイズ可能なエンベロープ:バンド幅のパラメータを定義し、トレーディングスタイルに合わせてエンベロープの外観を調整できます。 トレンドの識別:エンベロープは市場トレンドを視覚化するのに役立ち、上昇トレンドと下降トレンドを特定しやすくします。 潜在的な反転ポイント:価格がエンベロープに触れることで、潜在的な反転ポイントを示すことがあり、情報を元に判断できます。 ユーザーフレンドリー:このインジケーターはMetaTrader 5プラットフォームで簡単にインストールおよび使用できます。 このインジケーターを今すぐ無料でダウンロードして、MetaTrader 5
FREE
Breadwinner EMA Pro
Isidro Jr Rosalada Dadula
リスク管理に焦点を当てた自動化された外国為替取引 これはAIによって生成された翻訳です。一部のエラーが含まれている可能性があることに注意してください。 (DFX MQL5コミュニティの更新された設定ファイル/設定、以下のリンクを参照) 収益性への規律あるアプローチによるEMAクロスオーバーの力を解き放つ DFXのEMA Pro は、あなたの取引戦略を自動化するために設計された強力で使いやすい外国為替エキスパートアドバイザー(EA)です。これは、堅牢なリスク管理機能とカスタマイズ可能な設定を備えた、実績のあるEMA(指数移動平均)クロスオーバー戦略に基づいて構築されています。 EMA Proが他と異なる点: 戦略的EMAクロスオーバー: シンプルで効果的: EAは2つのEMA、速いEMAと遅いEMAを使用します。速いEMAが遅いEMAを上回ると買いシグナルが生成され、速いEMAが遅いEMAを下回ると売りシグナルが生成されます。このクロスオーバー戦略は、潜在的なトレンドの変化を特定し、その機会を活かすことを目的としています。 タイムフレームのカスタマイズ: EMAクロスオーバー分析のための
INTRODUCTION : The breakout strength meter is a trading tool that is used to identify which currencies are the strongest to breakout, and which currencies are the weakest to breakout. The settings for the indicator are easy, and if you cannot find the settings, please leave a comment The tools are completely free to use Please, if you like the indicator, please leave a comment and rate the indicator in order to develop it
FREE
Price Retest MT5
Suvashish Halder
4.67 (3)
Introducing our exciting new Price Retest indicator! Get instant alerts when the price retests, giving you a powerful edge in your trading strategy. Remember to do your own analysis before making any moves in the market. MT4 Version -  https://www.mql5.com/en/market/product/118031 Here’s a detailed explanation of how the Price Retest indicator works, its components, and how you can incorporate it into your trading strategy: The Price Retest indicator is designed to notify traders when the price
FREE
Good day! I present to you a trading technical indicator for Deriv broker synthetic indices. This indicator ONLY works with the following indices: Boom 300 Index Boom 500 Index Boom 1000 Index Crash 300 Index Crash 500 Index Crash 1000 Index The indicator was created to give signals to open medium-term trades in the direction of Spikes. But you can open trades in the opposite direction to Spikes, at your own risk. Trade only on M1. Other TFs do not guarantee the correct operation of the indic
John Bollinger created this indicator in 2010 as a way to read the original indicator (Bollinger Bands) in a more "technical" way, shown as an oscillator. The typical range of the Bollinger Bands %B is 0 - 0.5 - 1.0, where "0" represents the lower band, the "0.5" the middle band, and "1" the upper band. The line on the indicator represents the Closing prices. As simple as that. SETTINGS Bollinger Bands period of analysis Standard Deviation multiplier Shift Price type to be analyzed If you
FREE
Analyze potential   Covered Call   structures in the Brazilian market. Define where you want the break-even of your structure and see what structure to use. It works for any asset that has authorized series of options on B3 (Brazilian Stock Exchange). Associate the indicator to the asset you want to set up the Covered Call. *** ATENTION *** For the robot to work, the service that consults the authorized series of B3 options must be running on your terminal. Download the utility for free from
FREE
このプロダクトを購入した人は以下も購入しています
指示する     ロシア     -        utilizar con   el indicador の ESP 推奨事項 -   TPSpro トレンド プロフェッショナル版 -   MT5のバージョン 最も重要なことは、将来においても最も重要なことです。 機能のプリンシパル: ゾーンのほとんどは、ベンダーとコンプラドールによってアクティブ化されます。 状況を直感的に把握できるよう、初期の衝動を修正します。 LOGIC AI: MUESTRA zonas (círculos) parabuscar puntos de entrada cuando se activa una plantilla 視覚的に優れた視覚効果があり、最も重要な機能がすべて揃っていることに注意してください。 優れたニベレス/ゾーンの視覚化 (modo MTF) 世界で最も人気のある場所/ゾーンです。これを使用するのに最適な方法です (   TPSproTREND PRO   )。 アルゴリズム プロフェッショナル セパラド パソ ア パソ パラ オペラ それは、オペラハウスやコントラ・デ・エラの指導におい
TPSpro TREND PRO は 、市場を自動的に分析し、トレンドとその各変化に関する情報を提供し、再描画せずに取引にエントリーするためのシグナルを提供するトレンド指標です。 インジケーターは各ローソク足を使用し、個別に分析します。上向きまたは下向きのさまざまな衝撃を指します。通貨、仮想通貨、金属、株、指数の取引への正確なエントリーポイント! バージョンMT5                   インジケーターの完全な説明     RFI LEVELS インジケーター と併用することをお勧めします。 主な機能: レンダリングなしで正確な入力信号! シグナルが表示されると、それは関連性を維持します。これは、シグナルを提供してからそれを変更し、その結果、入金された資金が失われる可能性があるリドローインジケーターとの重要な違いです。より高い確率と精度で市場に参入できるようになりました。矢印が表示された後、ターゲットに到達する (利益確定) か反転シグナルが表示されるまで、ローソク足に色を付ける機能もあります。 STOP-LOSS/TAKE-PROFITゾーンの表示 エントリーポイン
まず第一に、この取引インジケーターは再描画されず、再描画されず、遅延しないことを強調する価値があります。これにより、手動取引とロボット取引の両方に理想的なものになります。 ユーザーマニュアル:設定、入力、戦略。 アトミックアナリストは、価格の強さとモメンタムを利用して市場でより良いエッジを見つけるためのPA価格アクションインジケーターです。ノイズや誤ったシグナルを除去し、取引ポテンシャルを高めるための高度なフィルターを備えています。複雑なインジケーターの複数のレイヤーを使用して、アトミックアナリストはチャートをスキャンし、複雑な数学的計算をシンプルなシグナルと色に変換します。これにより、どのような初心者トレーダーでも理解して使用し、一貫した取引の決定を行うことができます。 「アトミックアナリスト」は、新規および経験豊富なトレーダー向けにカスタマイズされた包括的な取引ソリューションです。プレミアムインジケーターとトップノッチの機能を1つの取引戦略に組み合わせ、すべてのタイプのトレーダーにとって汎用性のある選択肢にします。 デイリートレーディングとスキャルピング戦略:高速で正確な
Atbot
Zaha Feiz
4.91 (35)
AtBot: どのように機能し、どのように使用するか ### どのように機能するか MT5プラットフォーム用の「AtBot」インジケーターは、テクニカル分析ツールの組み合わせを使用して売買シグナルを生成します。単純移動平均(SMA)、指数移動平均(EMA)、および平均真実範囲(ATR)インデックスを統合して取引機会を特定します。さらに、Heikin Ashiキャンドルを使用してシグナルの精度を向上させることもできます。 購入後にレビューを残すと、特別なボーナスギフトを受け取ります。 ### 主な機能: - 再描画なし: シグナルはプロット後に変更されません。 - 再描画なし: シグナルは一貫しており、変更されません。 - 遅延なし: 遅延なくタイムリーなシグナルを提供します。 - 多様な時間枠: あらゆる時間枠で使用可能で、取引戦略に合わせることができます。 ### 操作手順: #### 入力と設定: - firstkey (TrendValue): トレンド検出の感度を調整します。 - Secondkey (SignalValue): 売買シグナル生成の感度を定義します。 - ma
まず第一に、このトレーディングシステムがノンリペイント、ノンリドロー、ノンラグのインジケーターであることを強調する価値がある。これにより、手動取引とロボット取引の両方に理想的なものになっています。 オンラインコース、マニュアル、プリセットのダウンロード。 「スマートトレンドトレーディングシステム MT5」は、新規および経験豊富なトレーダー向けにカスタマイズされた包括的なトレーディングソリューションです。10以上のプレミアムインジケーターを組み合わせ、7つ以上の堅実なトレーディング戦略を備えており、多様な市場状況に対応する多目的な選択肢となっています。 トレンドフォロー戦略:トレンドを効果的に乗り越えるための正確なエントリーとストップロス管理を提供します。 リバーサル戦略:潜在的なトレンドの反転を特定し、トレーダーがレンジ相場を活用できるようにします。 スキャルピング戦略:高速で正確なデイトレードおよび短期取引のために設計されています。 安定性:すべてのインジケーターはノンリペイント、ノンリドロー、ノンラグであり、信頼性の高いシグナルを保証します。 カスタマイズ:個々の取引の嗜好に合わせ
Gold Stuff mt5
Vasiliy Strukov
4.92 (167)
Gold Stuff mt5 は、金専用に設計されたトレンド指標であり、あらゆる金融商品にも使用できます。 インジケーターは再描画せず、遅れません。 推奨時間枠 H1. 設定と個人的なボーナスを得るために、購入後すぐに私に連絡してください!  トレンド スキャナーの強力なサポートを利用して、無料のインジケーターを入手し、プライバシーを守ります。あーみー!   設定 矢印を描く - オンオフ。 チャートに矢印を描く。 アラート - 可聴アラートのオンオフ。 メール通知 - オンオフ。 電子メール通知。 プチ通知 - オンオフ。 プッシュ通知。 次に、色域を調整します。 Gold Stuff mt5 は、金専用に設計されたトレンド指標であり、あらゆる金融商品にも使用できます。 インジケーターは再描画せず、遅れません。 推奨時間枠 H1. 設定と個人的なボーナスを得るために、購入後すぐに私に連絡してください!   設定 矢印を描く - オンオフ。 チャートに矢印を描く。 アラート - 可聴アラートのオンオフ。 メール通知 - オンオフ。 電子メール通知。 プチ通
mql5と Telegramの モーニング・ブリーフィングで、詳細とスクリーンショットを含む毎日のマーケット・アップデートをご覧 ください! FX Power MT5 NGは 、長年の人気を誇る通貨強度計FX Powerの次世代モデルです。 この次世代ストレングスメーターは何を提供するのでしょうか?初代FXパワーの魅力すべて プラス GOLD/XAUの強さ分析 より正確な計算結果 個別に設定可能な分析期間 カスタマイズ可能な計算上限値により、さらに優れたパフォーマンスを実現 もっと見たい人のための特別なマルチインスタンス設定 すべてのチャートでお好みの色を無限に設定可能 数え切れないほどの通知オプションにより、重要なことを見逃すことはありません。 Windows 11とmacOSのスタイルで角を丸くした新しいデザイン 魔法のように動くインジケーターパネル FXパワーの主な機能 すべての主要通貨の強さの完全な履歴 すべての時間枠における通貨の強さの履歴 すべてのブローカーとチャートで同一の計算結果 100%信頼できるリアルタイム計算 -> リペイントなし ドロップダウン・リストから
Quantum Trend Sniper
Bogdan Ion Puscasu
4.8 (49)
ご紹介   クォンタム トレンド スナイパー インジケーターは 、トレンド反転を特定して取引する方法を変革する画期的な MQL5 インジケーターです。 13年以上の取引経験を持つ経験豊富なトレーダーのチームによって開発されました。     クォンタムトレンドスナイパーインジケーター   は、非常に高い精度でトレンドの反転を識別する革新的な方法で、あなたのトレーディングの旅を新たな高みに押し上げるように設計されています。 ***Quantum Trend Sniper Indicatorを購入すると、Quantum Breakout Indicatorを無料で入手できます!*** クォンタム ブレイクアウト インジケーターは、トレンドの反転を特定するとアラートを発し、矢印を示し、3 つのテイクプロフィットレベルを提案します。 初心者トレーダーにもプロのトレーダーにも適しています。 量子EAチャネル:       ここをクリック MT4のバージョン:       ここをクリック 推奨事項: 期間:すべての時間枠。最良の結果を得るには、M
WHY IS OUR FXACCCURATE LS MT5 THE PROFITABLE ? PROTECT YOUR CAPITAL WITH RISK MANAGEMENT Gives entry, stop and target levels from time to time. It finds Trading opportunities by analyzing what the price is doing during established trends. POWERFUL INDICATOR FOR A RELIABLE STRATEGIES We have made these indicators with a lot of years of hard work. It is made at a very advanced level. Established trends provide dozens of trading opportunities, but most trend indicators completely ignore them!
トレンド スクリーナー インジケーターでトレンド取引の力を解き放ちます。ファジー ロジックと複数通貨システムを活用した究極のトレンド取引ソリューションです。 ファジー ロジックを活用した革新的なトレンド インジケーターである Trend Screener を使用して、トレンド取引を向上させます。 これは、13 を超えるプレミアム ツールと機能、および 3 つの取引戦略を組み合わせた強力なトレンド追跡インジケーターであり、Metatrader をトレンド アナライザーにする多用途の選択肢となります。 期間限定オファー : トレンド スクリーナー インジケーターは、わずか 100 ドルで生涯ご利用いただけます。 (元の価格 50$ ) (オファー延長) Trend Screener の 100% 非再描画精度の揺るぎない精度を体験して、取引の決定が過去の価格変動の影響を受けないようにしてください。 マルチタイムフレームおよびマルチ通貨機能の多用途性を解放し、比類のない自信を持って外国為替、商品、暗号通貨、インデックスの世界を取引できるようにします。 Trend Screener の包括的な
このダッシュボードは、選択されたシンボルの最新の利用可能なハーモニックパターンを表示するので、時間を節約し、より効率的に /   MT4バージョン 。 無料インジケーター:   Basic Harmonic Pattern インジケーター列 Symbol : 選択したシンボルが表示されます。 Trend :   強気または弱気 Pattern : パターンの種類(ガートレー、バタフライ、バット、カニ、サメ、サイファー、ABCD) Entry : エントリー価格 SL: ストップロス価格 TP1: 1回目の利食い価格 TP2: 2回目の利食い価格 TP3:   3回目の利食い価格 Current price :   現在値 Age (in bars):    最後に描画されたパターンの年齢 主な入力項目 Symbols:   "28 Major Currency Pairs "または "Selected Symbols "から選択。 Selected Symbols:   カンマで区切られた監視したいシンボル("EURUSD,GBPUSD,XAUUSD")。ブローカーが
まず第一に、この取引ツールはノンリペイント、ノンリドロー、ノンラグの指標であり、プロの取引に理想的ですことを強調する価値があります。 オンラインコース、ユーザーマニュアル、デモ。 スマートプライスアクションコンセプトインジケーターは、新米から経験豊富なトレーダーまで、非常 に強力なツールです。Inner Circle Trader AnalysisやSmart Money Concepts Trading Strategiesなど、20以上の有用な指標を1つに組み合わせています。このインジケーターはスマートマネーコンセプトに焦点を当て、大手機関の取引方法を提供し、彼らの動きを予測するのに役立ちます。 特に、流動性分析に優れており、機関がどのように取引しているかを理解しやすくしています。市場のトレンドを予測し、価格の動きを慎重に分析するのに優れています。機関の戦略とトレードを合わせることで、市場の動向についてより正確な予測ができます。このインジケーターは多目的であり、市場構造を分析し、重要な注文ブロックを特定し、さまざまなパターンを認識するのに優れています。 このインジ
これはMT5のインジケーターで、再描画なしで取引に参入するための正確なシグナルを提供します。 外国為替、暗号通貨、金属、株式、インデックスなど、あらゆる金融資産に適用できます。かなり正確な見積もりを提供し、取引を開始して終了するのに最適な時期を教えてくれます。1つのシグナルを処理しただけでインジケーターの元が取れた例の 動画 (6:22)をご覧ください。Entry PointsPro インジケーターの助けを借りたほとんどのトレーダーの最初の1週間の結果が改善しています。 Telegramグループ に登録してください。Entry Points Proインジケーターのメリットは次の通りです。 再描画のないエントリーシグナル 再描画されるインジケーターでは一度表示されたシグナルが削除されて大きな金銭的損失につながることがありますが、これと異なり、表示されて確認されたシグナルは消えることがありません。 エラーなしの取引開始 インジケーターアルゴリズムによって取引を開始する(資産を売買する)理想的な瞬間を見つけることができます。それを使用するすべてのトレーダーの成功率が向上します。
現在33%オフ 初心者にもエキスパートトレーダーにも最適なソリューション このインジケーターは独自の機能と新しい公式を多数内蔵しており、ユニークで高品質かつ手頃な取引ツールです。このアップデートでは、2つの時間枠ゾーンを表示できるようになります。より長いTFだけでなく、チャートTFとより長いTF(ネストゾーンを表示)の両方を表示できます。すべてのSupply Demandトレーダーの皆さんのお気に召すはずです。:) 重要情報の公開 Advanced Supply Demandの可能性を最大化するには、 https://www.mql5.com/ja/blogs/post/720245 にアクセスしてください。   エントリーまたはターゲットの正確なトリガーポイントを正確に特定できれば取引がどのように改善されるか想像してみてください。新しい基盤となるアルゴリズムに基づいて構築されているため、買い手と売り手の間の潜在的な不均衡をさらに簡単に特定できます。これは、最も強い需要と供給のゾーンと、過去のパフォーマンス(古いゾーンを表示)がグラフィカルに表現されるためです。これらの機能は、最適
ATrend: その仕組みと使い方 仕組み MT5プラットフォーム向けの「ATREND」インジケーターは、テクニカル分析手法の組み合わせを利用して、トレーダーに堅牢な買いと売りのシグナルを提供するように設計されています。このインジケーターは主に、ボラティリティ測定のために平均真の範囲(ATR)を活用し、潜在的な市場動向を特定するためのトレンド検出アルゴリズムを併用しています。 購入後にメッセージを残すと、特別なボーナスギフトが贈呈されます。 30ドルの価格で残り8部 主な特徴: - ダイナミックなトレンド検出: インジケーターは市場トレンドを評価し、シグナルを適宜調整することで、トレーダーが優位な市場環境に合わせて戦略を立てるのを支援します。     - ボラティリティ測定: ATRを使用することで、インジケーターは最適なストップロス(SL)とテイクプロフィット(TP)レベルを決定するために不可欠な市場ボラティリティを測定します。 - シグナルの視覚化: インジケーターは、チャート上に買いと売りのシグナルを視覚的に表示することで、トレーダーの意思決定を強化します。 操作手順 入力
Auto Order Block with break of structure based on ICT and Smart Money Concepts (SMC) Futures Break of Structure ( BoS )             Order block ( OB )            Higher time frame Order block / Point of Interest ( POI )    shown on current chart           Fair value Gap ( FVG ) / Imbalance   -  MTF      ( Multi Time Frame )    HH/LL/HL/LH  -  MTF      ( Multi Time Frame )  Choch  MTF      ( Multi Time Frame )  Volume Imbalance     ,  MTF          vIMB Gap’s Power of 3 Equal High
TPA True Price Action indicator reveals the true price action of the market makers through 100% non-repainting signals strictly at the close of a candle! TPA shows entries and re-entries, every time the bulls are definitely stronger than the bears and vice versa. Not to confuse with red/green candles. The shift of power gets confirmed at the earliest stage and is ONE exit strategy of several. There are available now two free parts of the TPA User Guide for our customers. The first "The Basics"
The AT Forex Indicator MT5 is a sophisticated trading tool designed to provide traders with a comprehensive analysis of multiple currency pairs. This powerful indicator simplifies the complex nature of the forex market, making it accessible for both novice and experienced traders. AT Forex Indicator uses advanced algorithms to detect trends, patterns and is an essential tool for traders aiming to enhance their forex trading performance. With its robust features, ease of use, and reliable signal
ICT, SMC, SMART MONEY CONCEPTS, SMART MONEY, Smart Money Concept, Support and Resistance, Trend Analysis, Price Action, Market Structure, Order Blocks, BOS/CHoCH,   Breaker Blocks ,  Momentum Shift,   Supply&Demand Zone/Order Blocks , Strong Imbalance,   HH/LL/HL/LH,    Fair Value Gap, FVG,  Premium  &   Discount   Zones, Fibonacci Retracement, OTE, Buy Side Liquidity, Sell Side Liquidity, BSL/SSL Taken, Equal Highs & Lows, MTF Dashboard, Multiple Time Frame, BigBar, HTF OB, HTF Market Structure
WHY IS OUR FXACCCURATE TCT MT5 THE PROFITABLE ? Gives entry, stop and target levels from time to time. It finds Trading opportunities by analyzing what the price is doing during established trends. We have made these indicators with a lot of years of hard work. It is made at a very advanced level. Established trends provide dozens of trading opportunities, but most trend indicators completely ignore them! The trend reveals trading indicator represents an average of 10 different trades per trend
スイングトレーディング は、トレンドの方向のスイングと可能な反転スイングを検出するように設計された最初のインジケーターです。トレーディングの文献で広く説明されているベースラインスイングトレーディングアプローチを使用します。インディケータは、いくつかの価格と時間のベクトルを調査して、全体的なトレンドの方向を追跡し、市場が売られ過ぎまたは買われ過ぎて修正の準備ができている状況を検出します。 [ インストールガイド | 更新ガイド | トラブルシューティング | よくある質問 | すべての製品 ] むち打ちを起こさずに市場スイングの利益 インジケーターは常にトレンドの方向を表示します 色付きの価格帯は機会のベースラインを表します 色付きのダッシュは、可能な反転スイングを表します この指標は、独自の品質とパフォーマンスを分析します 複数時間枠のダッシュボードを実装します カスタマイズ可能なトレンドおよびスイング期間 電子メール/サウンド/プッシュアラートを実装します インジケータは再描画またはバックペインティングではありません Swing Tradingとは Swing Tradi
トレンド検出インジケーターはあらゆる戦略を補完し、独立したツールとしても使用できます。 インジケーターの操作に関する推奨事項、コメント   #8   でダウンロードできます 利点 使いやすく、不要な情報でチャートを過負荷にしません。 あらゆる戦略のフィルターとして使用できます。 利益を得るのとストップロスを設定するの両方に使用できる動的なサポートとレジスタンスのレベルが組み込まれています。 ローソク足が閉じた後、インジケーターの色は変わりません。  株式市場、指数、石油、金、およびすべての時間枠で機能します。 トースト通知、電子メール通知、プッシュ通知、サウンドアラートの機能があります。 私の他の開発はここで見つけることができます: https://www.mql5.com/ja/users/mechanic/seller 入力パラメータ Alert-オン/オフ。アラート; Push Notification-オン/オフ。プッシュ通知; Mail-オン/オフ電子メール通知; Fibo 1,2,3,4,5,6,7,11,21,31,41,51,61,71-動的サポートと抵抗
Was: $249  Now: $99   Market Profile defines a number of day types that can help the trader to determine market behaviour. A key feature is the Value Area, representing the range of price action where 70% of trading took place. Understanding the Value Area can give traders valuable insight into market direction and establish the higher odds trade. It is an excellent addition to any system you may be using. Inspired by Jim Dalton’s book “Mind Over Markets”, this indicator is designed to suit the
MetaForecast M5
Vahidreza Heidar Gholami
5 (2)
MetaForecastは、価格データのハーモニクスに基づいて、どんな市場の未来を予測し視覚化します。市場が常に予測可能ではありませんが、価格にパターンがある場合、MetaForecastは可能な限り正確な未来を予測できます。他の類似製品と比較して、MetaForecastは市場のトレンドを分析することでより正確な結果を生成することができます。 入力パラメータ Past size (過去のサイズ) MetaForecastが将来の予測を生成するために使用するバーの数を指定します。モデルは選択したバー上に描かれた黄色の線で表されます。 Future size (将来のサイズ) 予測すべき将来のバーの数を指定します。予測された将来は、ピンクの線で表示され、その上に青い回帰線が描かれます。 Degree (程度) この入力は、MetaForecastが市場で行う分析のレベルを決定します。 Degree 説明  0 Degree 0の場合、価格の全てのピークや谷、そして詳細をカバーするために、「Past size」の入力に大きな値を使用することが推奨されています。  1 (推奨) Degr
Was: $299  Now: $99   Supply Demand uses previous price action to identify potential imbalances between buyers and sellers. The key is to identify the better odds zones, not just the untouched ones. Blahtech Supply Demand indicator delivers functionality previously unavailable on any trading platform. This 4-in-1 indicator not only highlights the higher probability zones using a multi-criteria strength engine, but also combines it with multi-timeframe trend analysis, previously confirmed swings
** All Symbols x All Timeframes scan just by pressing scanner button ** *** Contact me  to send you instruction and add you in "123 scanner group" for sharing or seeing experiences with other users. After 17 years of experience in the markets and programming, Winner indicator is ready. I would like to share with you! Introduction The 123 Pattern Scanner indicator with a special enhanced algorithm is a very repetitive common pattern finder with a high success rate . Interestingly, this Winner in
FX Volume MT5
Daniel Stein
4.93 (14)
mql5と Telegramの モーニング・ブリーフィングで、詳細とスクリーンショットを含む毎日のマーケット・アップデートをご覧 ください! FX Volumeは、ブローカーの視点から市場のセンチメントをリアルに洞察する、最初で唯一の出来高インジケーターです。 ブローカーのような機関投資家が外国為替市場でどのようなポジションをとっているか、COTレポートよりもはるかに速く、素晴らしい洞察を提供します。 この情報をチャート上で直接見ることは、あなたの取引にとって真のゲームチェンジャーであり、画期的なソリューションです。 以下のようなユニークなマーケットデータ洞察から利益を得てください。 比率は 、通貨のロングポジションとショートポジションの比率をパーセントで表示します。 比率の変化は 、選択した期間内のロング比率とその変化率を表示します。 Volumes Totalは 、通貨の取引量(ロングとショート)の合計をロット単位で表示します。 Volumes Long :全通貨のロングポジションの取引量を表示します。 Volumes(ショート )は、全通貨のショートポジションの取引量を表示
Stratos Pali Indicator is a revolutionary tool designed to enhance your trading strategy by accurately identifying market trends. This sophisticated indicator uses a unique algorithm to generate a complete histogram, which records when the trend is Long or Short. When a trend reversal occurs, an arrow appears, indicating the new direction of the trend. Important Information Revealed Leave a review and contact me via mql5 message to receive My Top 5 set files for Stratos Pali at no cost ! Do
Gartley Hunter Multi - An indicator for searching for harmonic patterns simultaneously on dozens of trading instruments and on all possible timeframes. Manual (Be sure to read before purchasing) | Version for MT4 Advantages 1. Patterns: Gartley, Butterfly, Shark, Crab. Bat, Alternate Bat, Deep Crab, Cypher 2. Simultaneous search for patterns on dozens of trading instruments and on all possible timeframes 3. Search for patterns of all possible sizes. From the smallest to the largest 4. A
IX Powerは 、FX Powerの無敵の精度をついにFX以外のシンボルにも提供します。 お気に入りの指数、株式、コモディティ、ETF、さらには暗号通貨の短期、中期、長期のトレンドの強さを正確に判断します。 お使いの端末が提供する すべてを分析する ことができます。ぜひお試しいただき、取引 タイミングが大幅に改善 されることをご体験ください。 IXパワーの主な特徴 100%正確で再描画されない計算結果 - ターミナルで利用可能なすべての取引シンボルに対して 予め設定され、さらに個別に設定可能な強度分析期間のドロップダウン選択 Eメール、メッセージ、モバイル通知による無数の通知オプション EAリクエストのためのアクセス可能なバッファ カスタマイズ可能な計算制限により、さらに優れたパフォーマンスを実現 もっと見たい人のための特別なマルチインスタンス設定 すべてのチャートでお好みの色を無限に設定可能 Windows 11とmacOSのスタイルで角を丸くした新しいパネルデザイン サブ・ウィンドウとメイン・チャートの間をシームレスに移動する、魔法のように動くイン
作者のその他のプロダクト
Bollinger Bands Percentage
Emanuel Cavalcante Amorim Filho
Bollinger Bands %  or Bollinger Bands Percentage is one of the indicators used in the Sapphire Strat Maker - EA Builder . It is calculated using the following formula: Perc = (CLOSE_PRICE - LOWER_BOLLINGER) / (UPPER_BOLLINGER - LOWER_BOLLINGER) * 100 Thus, by taking the difference between closing price to the lower band and dividing it by the difference of the upper and the lower price levels of a Bollinger Bands indicator, we can calculate this indicator. It shows how far the price is f
FREE
Sapphire Strat Maker Alt
Emanuel Cavalcante Amorim Filho
Sapphire Strat Maker Alt   is an EA builder ( Expert Advisor Builder) . With it you can easily create new strategies and optimize them to find the bests parameters to improve your results at maximum. The objective is to bring the capabilities of MQL5 to everyone, even if you don't know how to code. Check out   the Pro Version   clicking here - Sapphire Strat Maker . With this Expert Advisor you can create strategies by combining the indicators provided by the EA. A few of the functionalities a
FREE
Simple Candle Countdown
Emanuel Cavalcante Amorim Filho
Simple candle countdown - never again miss how much time is left to open a new bar! This indicator doesn't plot any line on the chart - it uses only objects and calculates the time left to open a new bar. You can set custom colors for the panel background and border and for the text color. Simple as that, the indicator is ready to use. If you find any bugs, feel free to contact me. 
FREE
Sapphire Strat Maker
Emanuel Cavalcante Amorim Filho
Sapphire Strat Maker  is an EA builder ( Expert Advisor Builder or Strategy Maker)  designed to make the creation of trading strategies easier . The goal is to provide the most intuitive, functional and fast environment to test and execute new strategies. Check out the free version here - Sapphire Strat Maker Alt . With this Expert Advisor you can create thousands of strategies by combining the indicators (30+ indicators are available) provided by the EA or by using custom indicators. A few of t
Emerald EA Builder
Emanuel Cavalcante Amorim Filho
Welcome to Emerald - EA Builder! Emerald - EA Builder is a simple, effective, fast and powerful expert advisor for you to build and automatize your strategies in Metatrader 5 for every single financial instrument (forex, stocks, futures). Blog posts about the EA: FAQ - Frequently Asked Questions  (latest update: jun 25, 2024) Emerald EA Builder - An introduction to a strategy maker If you don't know how to code, this EA simplifies the process and let's you create as many strategies as yo
フィルタ:
レビューなし
レビューに返信