Features:
1- Get OB/OS Levels from Golden MA Levels
2- Wait for Buy/Sell Start Level Cross
3- Optional: Should price cross Mid Level in earlier bars
4- Optional: Crossing bar High/Medium Volume
5- Optional: MA Stacked to check up/down trend for current TF
6- Optional: NRTR higher timeframes aligned Check
Detailed blog post explained: https://www.mql5.com/en/blogs/post/758457
Levels with Buffers available here: Golden MA Levels Indicator: https://www.mql5.com/en/market/product/119515
Trend Plus Trendplus Indicator Time Frame: Suitable for any time frame. Purpose: Trend Prediction. Blue and red candle indicate the buy and sell call respectively. Buy: When the blue candle is formed buy call is initiated. close the buy trades when the next red candle will formed. Sell: When the Red candle is formed Sell call is initiated. close the Sell trades when the next blue candle will formed. Happy trade!!
Free automatic Fibonacci is an indicator that automatically plots a Fibonacci retracement based on the number of bars you select on the BarsToScan setting in the indicator. The Fibonacci is automatically updated in real time as new highest and lowest values appears amongst the selected bars. You can select which level values to be displayed in the indicator settings. You can also select the color of the levels thus enabling the trader to be able to attach the indicator several times with differe
This indicator has been created for finding the probable reversal points of the symbol price. A small candlestick reversal pattern is used it its operation in conjunction with a filter of extremums. The indicator is not redrawn! If the extremum filter is disabled, the indicator shows all points that have a pattern. If the extremum filter is enabled, the condition works – if the history Previous bars 1 candles back contains higher candles and they are farther than the Previous bars 2 candle, such
Stochastic Full View show all 29 major and minor pairs Stochastic indicator live value,traders can view all 29 pairs Stochastic indicator live value with all 9 timeframes just attached it on ANY ONE Chart, traders can see all the 9 timeframe overbought signal and oversell signal just on ONE Chart Stochastic Full View show the overbought value and oversell value with highlight background color and font color,you can attach this utility on any pair and any timeframe, traders can
The Volume Weighted ATR indicator is a helpful tool for measuring market activity. It is based on the idea of the Volume-Weighted ATR. Combining these two elements helps identify potential turning points or breakout opportunities. The indicator for the classification of the activity of the market uses the moving average and its multiples. Accordingly, where the VWATR bar is located (relative to the moving average), it is labelled as ultra-low, low, average, high, very high or ultra high. Th
Market Profile 3 MetaTrader 4 indicator — is a classic Market Profile implementation that can show the price density over time, outlining the most important price levels, value area, and control value of a given trading session. This indicator can be attached to timeframes between M1 and D1 and will show the Market Profile for daily, weekly, monthly, or even intraday sessions. Lower timeframes offer higher precision. Higher timeframes are recommended for better visibility. It is also possible t
Check my paid tools they work great and I share Ea's based on them for free please r ate
The Dual Timeframe RSI (Relative Strength Index) indicator is a novel trading tool that allows traders to monitor RSI readings from two different timeframes on a single chart. This dual perspective enables traders to identify potential trend confirmations and divergences more effectively. For instance, a trader might use a 1-hour RSI alongside a daily RSI to ensure that short-term trades align with the bro
MASi Three Screens is based on the trading strategy by Dr. Alexander Elder. This indicator is a collection of algorithms. Algorithms are based on the analysis of charts of several timeframes. You can apply any of the provided algorithms.
List of versions of algorithms:
ThreeScreens v1.0 - A simple implementation, with analysis of the MACD line; ThreeScreens v1.1 - A simple implementation, with analysis of the MACD histogram; ThreeScreens v1.2 - Combines the first two algorithms
Scalping indicator. It takes into account volatility, price movement in the local interval and the direction of the current trend. Recommended timeframe - M5. Advantages: Low volatility when a signal appears ensures minimal movement against an open position. The indicator does not redraw its signals. There are alert signals. It is a great tool for day trading.
Settings: Name Description Period Indicator period Range of each bar in the period (pp.) The maximum size of each candle in the indicat
The indicator displays overbought and oversold levels, calculating them using the Fibonacci golden ratio formula.
It enables both trend-following and counter-trend trading, accommodating breakouts and rebounds from these levels.
It operates on all timeframes, across various currency pairs, metals, and cryptocurrencies.
Suitable for binary options trading.
Key Features: Based on the Fibonacci golden ratio Shows overbought and oversold levels Suitable for market and pending orders Sim
This Weis Wave Volume indicator is a tool to help traders identify the current price trend. Understanding volume can provide insight into a market's behavior to help you determine its overall health. The most important rule is this: volume precedes price. Typically, before a market price moves, volume comes into play. It has 2 main colors histogram which are green and red. – Green indicates an upward wave. The more the price increases, the bigger the green volume gets. – The red color shows a d
Are you tired of drawing trendlines every time you're analyzing charts? Or perhaps you would like more consistency in your technical analysis. Then this is for you. This indicator will draw trend lines automatically when dropped on a chart. How it works Works similar to standard deviation channel found on mt4 and mt5. It has 2 parameters: 1. Starting Bar 2. Number of bars for calculation The starting bar is the bar which drawing of the trend lines will begin, while the number of bars for c
Footmarks Pro Footmarks Pro is a MetaTrader 4 Essential Indicator that create round number or sweetspot on chart with "Button". Parameter Indicator Name - Footmarks Pro Pair Selection - 250 points / 500 points / 1000 points Sweetspot Setting Sweetspot Line Color Sweetspot Line Style Sweetspot Line Thickness Sweetspot Button Setting Button Axis-X Button Axis-Y Thanks...
Rainbow MT4 is a technical indicator based on Moving average with period 34 and very easy to use. When price crosses above MA and MA changes color to green, it’s a signal to buy. When price crosses below MA and MA changes color to red, it’s a signal to sell. The Expert advisor ( Rainbow EA MT4) based on Rainbow MT4 indicator, as you can see in the short video below is now available here .
FOLLOW THE LINE GET THE FULL VERSION HERE: https://www.mql5.com/en/market/product/36024 This indicator obeys the popular maxim that: "THE TREND IS YOUR FRIEND" It paints a GREEN line for BUY and also paints a RED line for SELL. It gives alarms and alerts of all kinds. IT DOES NOT REPAINT and can be used for all currency pairs and timeframes. Yes, as easy and simple as that. Even a newbie can use it to make great and reliable trades. NB: For best results, get my other premium indicators for more
このインジケーターは次のレベルを描画します。
毎日のオープンライン: 下は弱気相場、上は強気相場です。 1 日の平均値の高値と安値 アジア市場の高低 昨日の高値と安値 これらのレベルは、誰もが注意を払う必要がある強力なサポートとレジスタンスのレベルです。
始めるのに時間を使わなかったのなら! 価格がこれらのレベルに近い場合は注意が必要です。
より簡単に取引をお楽しみください! Kono injikētā wa tsugi no reberu o byōga shimasu. Mainichi no ōpunrain: Shita wa yowaki sōba,-jō wa tsuyoki sōbadesu. 1-Nichi no heikinchi no takane to yasune Ajia ichiba no takahiku kinō no takane to yasune korera no reberu wa, daremoga chūiwoharau hitsuyō ga aru kyōryokuna sapōto to rejisutansu no re
Diversify the risk in your trading account by combining our Expert Advisors. Build your own custom trading system here: Simple Forex Trading Strategies
The expert advisor opens trades when RSI indicator enter in oversold or overbought areas. The Stop Loss, Take Profit, and Trailing Stop are calculated based on the ATR indicator. The recommended currency pair is EURGBP and the recommended timeframe to operate and to do backtests is H4. This Expert Advisor can be profitable in any TimeFrame a
The ProfileVolumesMarket indicator calculates tick volume on each price level in a selected range. Volume is vital when determining strength and therefore significance of price levels. The calculation range is set by a trader by means of moving two vertical lines. Thus the indicator allows to track important levels on different steps of a symbol price formation. A histogram of volume profile can be displayed on the chart (or removed from the chart) if you press "ON" ("OFF") button. When you chan
QuantumAlert RSI Navigator is a free indicator available for MT4/MT5 platforms, its work is to provide "alerts" when the market is inside "overbought and oversold" regions in the form of "buy or sell" signals. This indicator comes with many customization options mentioned in the parameter section below, user can customise these parameters as needful. Join our MQL5 group , where we share important news and updates. You are also welcome to join our private channel as well, contact me for the pri
First of all, it is worth highlighting here that this Trading Indicator is Non Repainting, Non Redrawing and Non Lagging, which makes it ideal for manual trading. Never repaint and recalculate Once an arrow appears it never disappears, the signal comes at the opening of the new candle You will now be more profitable with this indicator You can do swing trading or scalping trading The indicator helps you identify the trend Can be optimized across all pairs and time frames Blue arrow is for buyin
Head and Shoulders Pattern Indicator - Your Key to Recognizing Trend Reversals Unlock the power of pattern recognition with the "Head and Shoulders Pattern Indicator." This cutting-edge tool, designed for MetaTrader, is your trusted ally in identifying one of the most powerful chart patterns in technical analysis. Whether you're a novice or an experienced trader, this indicator simplifies the process of spotting the Head and Shoulders pattern, allowing you to make informed trading decisions. Key
Server Time On Chart is a simple indicator that shows the time of the broker's server with hours, minutes and seconds in the lower left corner of the chart's. Within the inputs you can only change the size of the font and the color you want depending on your taste. You can see more of my publications here: https://www.mql5.com/en/users/joaquinmetayer/seller
Free informative Indicator-helper. It'll be usefull for traders who trade many symbols or using grid systems (Averaging or Martingale). Indicator counts drawdown as percent and currency separate. It has a number of settings: Count deposite drawdown according equity value and send e-mail or notifications to user if DD more than set; Sending e-mail when max open orders reached; Shows price and remaining pips amount before MarginCall on current chart and Account generally; Display summary trade lot
Script to load on chart the orders, starting from "Signal history report" downloaded from MQL5. If you found a good signal on "Signals" section of this site and you want to see the history orders on chart, you can do it, following this steps: - Download the csv file of history orders - Copy file in the common folder - Launch the script and set the input that are: - Report type (MT4 or MT5) - File name - Delimiter (default is ;) - Name of symbol to load (if symbol on file is for example EURUSDi,
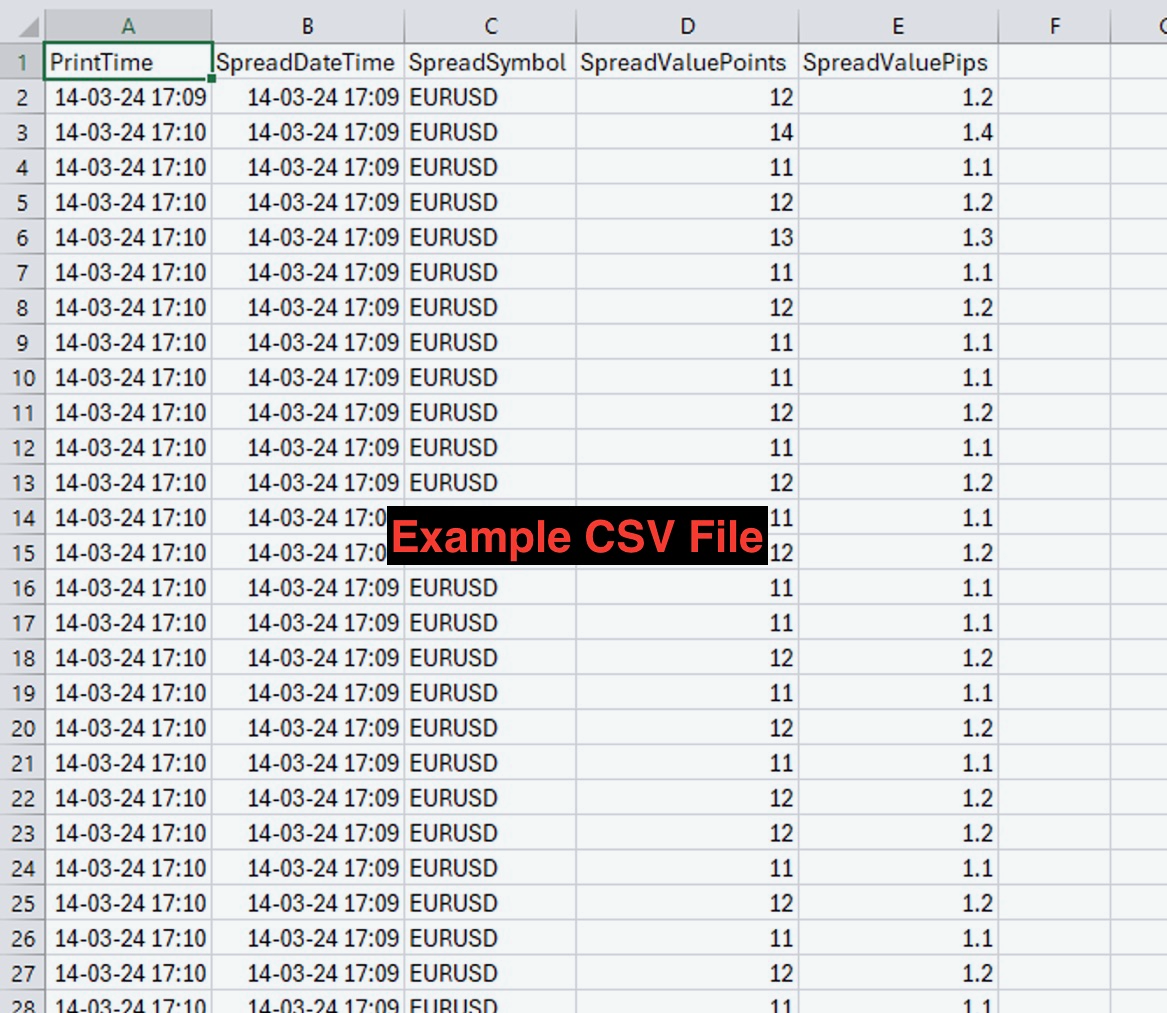
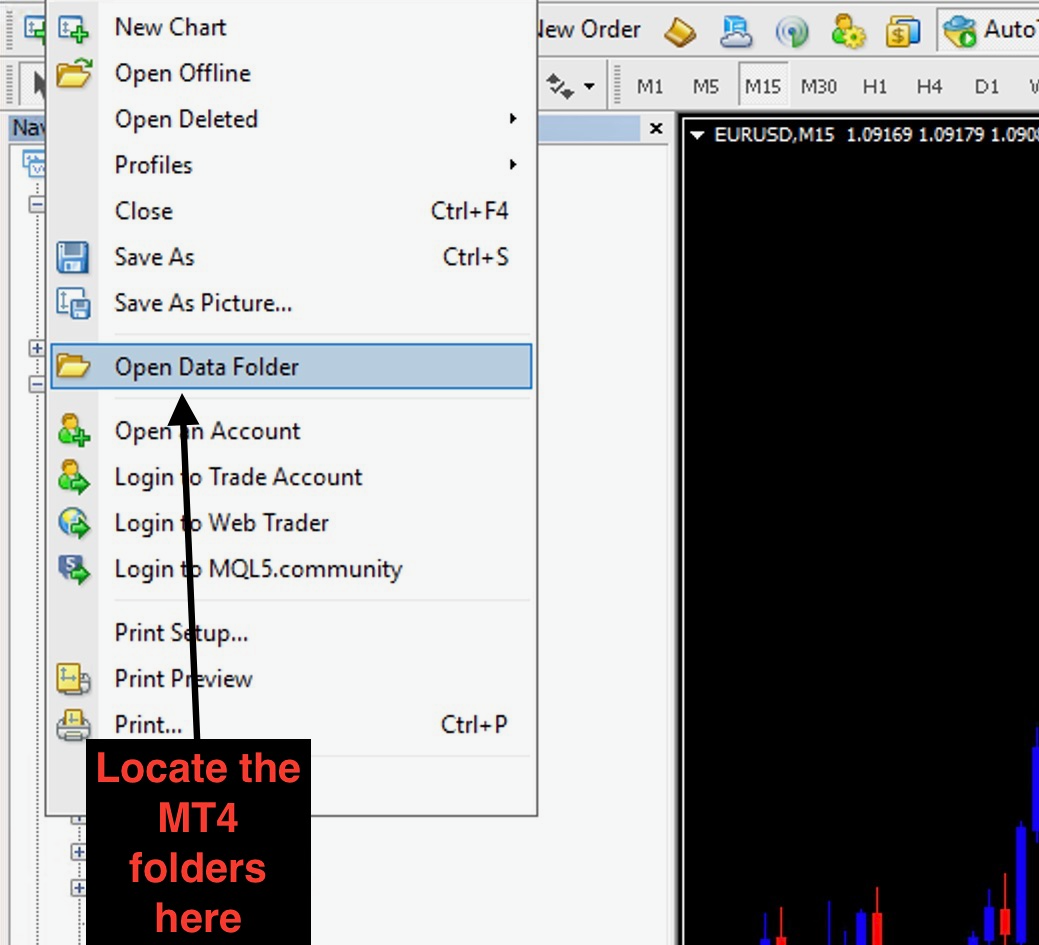
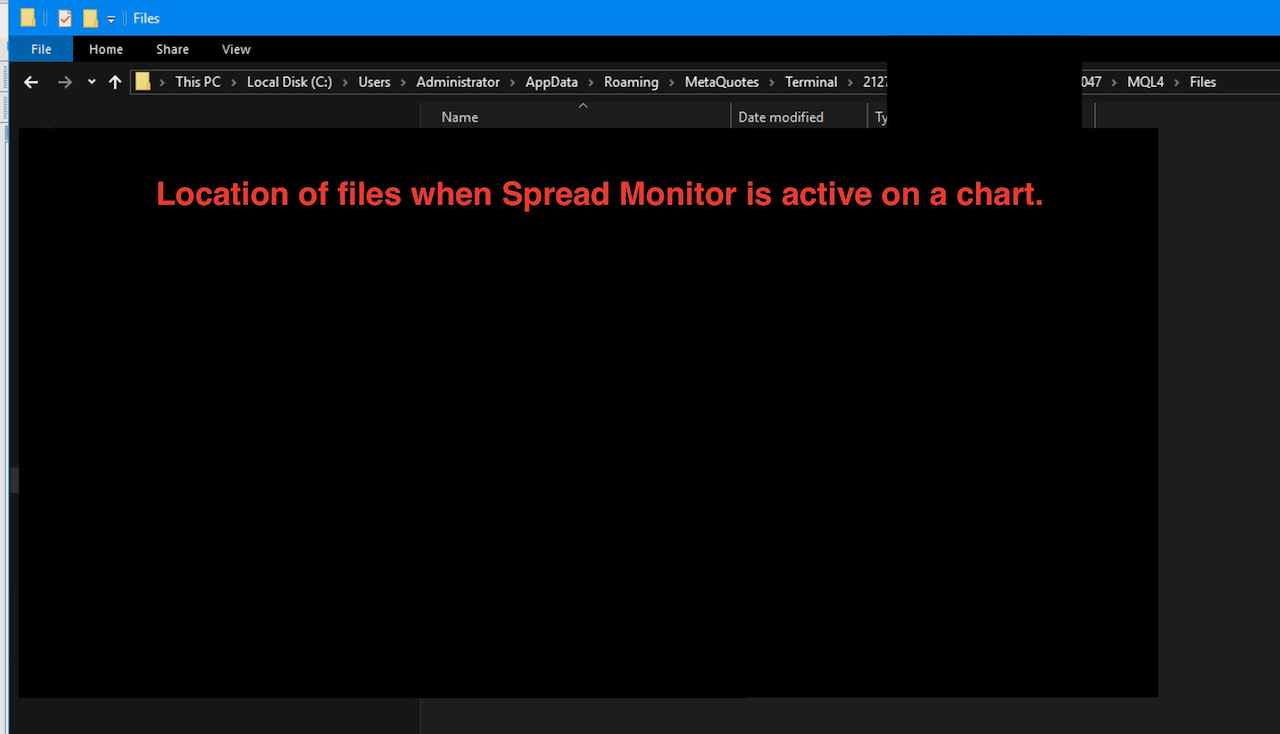
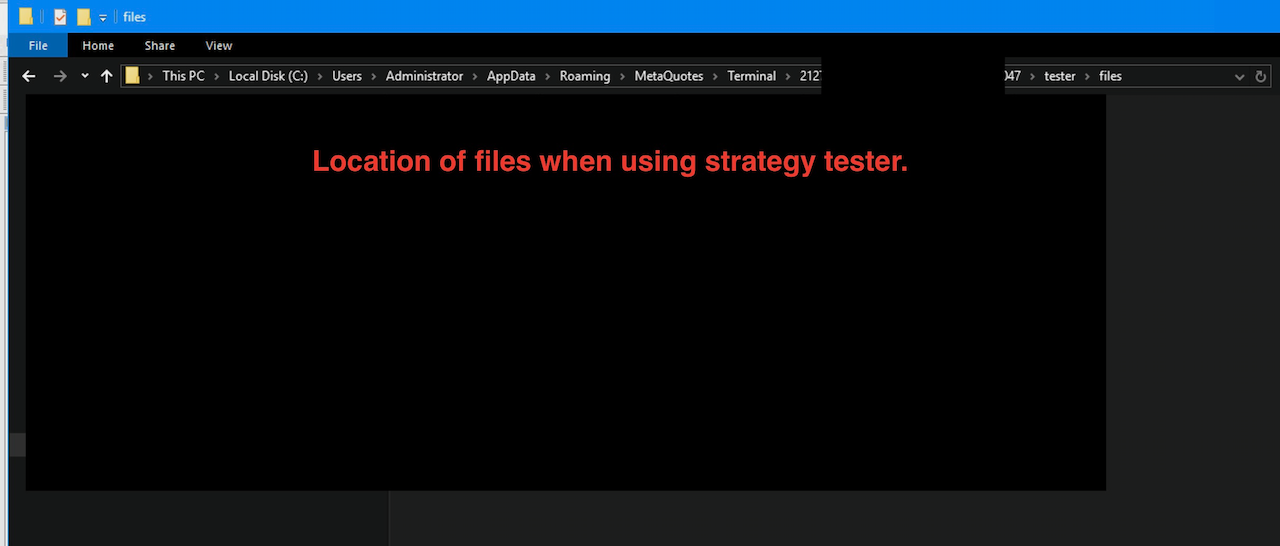
This indicator displays the historical bid and ask prices on the chart. This is an extremely useful tool for watching the spread rise and fall, as well as watching to see whether or not the bid and ask prices are converging or diverging. This tool will allow you to enter the market at just the right time. This indicator will help you stay out of the market when the spread begins to rise and help you get into the market as the spread begins to fall again.
ON SALE FOR FREE, GET IT FREE FOR A LIM
ET1 for MT4 is new and completely free!! ET1 for MT4 v4.20 Updated!! Now use on XAUUSD(Gold)!! The success rate is more than 75% !!!
important update: Merge ET9 's breakout strategy
Warning!! You can use ET1 completely free, but we do not guarantee ET1 stability, It is recommended that the more powerful ET9 for MT4 version includes the ET1 strategy and guarantees complete and stable returns.
The Best Expert Advisor on XAUUSD any timeframes ET9 for MT4 Updated v4.70 !! https://www.m
Tired of complex order placement and manual calculations? Trade Dashboard is your solution. With its user-friendly interface, placing orders becomes effortless, by a single click, you can open trades, set stop loss and take profit levels, manage trade lot size, and calculate risk to reward ratios, allowing you to only focus on your strategy. Say goodbye to manual calculations and streamline your trading experience with Trade Dashboard. Download Demo Version right now.
You can find Details
The product will copy all telegram signal to MT4 ( which you are member ) , also it can work as remote copier. Easy to set up, copy order instant, can work with almost signal formats, image signal, s upport to translate other language to English Work with all type of channel or group, even channel have "Restrict Saving Content", work with multi channel, multi MT5 Work as remote copier: with signal have ticket number, it will copy exactly via ticket number. Support to backtest signal. How to
これは、トレンドラインPROインジケーターの自動パラメータオプティマイザです 簡単かつ迅速に、あなたのお気に入りのトレンドラインプロインジケーターに最適なパラメータを選択します。 最適化には数秒しかかかりません。 オプティマイザでは、振幅、TP1-TP3、StopLoss、および選択した履歴セクション(日)の時間フィルタとHTFフィルタの値など、各ペアと期間に最適なパラメータを見つ
異なる時間枠を最適化するには、異なる範囲の履歴が必要です:
M5-M15計算範囲パラメータ(日)=60(三ヶ月)を設定します。 M30-H1計算範囲パラメータ(日)=120(6ヶ月)を設定します。 H4パラメータの計算範囲(日数)を設定する=240(1年) D1-W1パラメータ計算範囲(日)=720(三年)を設定します。 MN1パラメータ計算範囲(日)=1200(五年)を設定します。 最適化後、パラメータはmql4>Files>T R E N D Lineoptimizedsettingsフォルダ内の既製のセットファイルに自動的に保存されます
オプティマイザユーティリティの使用方法
Summer 50% discount ($199 -> $99) Advanced trading tool: One click smart orders that execute under your conditions Developed by trader for trading community: position size calculator (lot size), open position after price action, strategy builder, set and forget trading, mobile notifications...
Risk Management - Risk percentage position size calculator, gain percentage, target risk reward ratio, spread and commissions are included in calculations 7 Advanced order types - Set and forget tra
Summer 40% discount ($149 -> $88) Everything for chart Technical Analysis indicator mt4 in one tool Draw your supply demand zone with rectangle and support resistance with trendline and get alerts to mobile phone or email alert - Risk reward indicator Video tutorials, manuals, DEMO download here . Find contacts on my profile .
1. Extended rectangles and trendlines Object will be extended to the right edge of the chart when price will draw new candles on chart. This is rectangle extend
This EA Utility allows you to manage (with advanced filtering) unlimited open orders (manual or EA) with 16 trailing stop methods: fixed, percent, ATR Exit, Chandelier Exit, Moving Average, Candle High Low Exit, Bollinger Bands, Parabolic, Envelope, Fractal, Ichimoku Kijun-Sen, Alligator, Exit After X Minutes or Bars, RSI and Stochastic. The trailing stop can be either real or virtual, and you can exit fully or with a partial close percent on touch or bar close.
Moreover, you can add (overr
Let Your Ideas Earn For You.
Convert your Ideas and Strategies in to automated trading bots directly on MT4. Visual Strategy Builder with Instant Results on the chart. This One of a kind strategy builder, allows you to specify rules and visually see the signals based on those rule as you create them. Visit the link for Group, User Manual, Video Examples
Why Use LBM
LBM is an essential tool for traders of all levels. It allows traders to create strategies quickly and easily, and to test th
Comprehensive on chart trade panel with the unique ability to be controllable from mobile as well. Plus has a library of downloadable configuration, e.g. exit rules, extra panel buttons, pending order setup and more. Please see our product video. Works with all symbols not just currency pairs. Features On chart panel plus controllable from free app for Windows, iPhone and Android Built-in script engine with library of downloadable configuration, e.g. add 'Close All Trades in Profit' button, exit
KT Equity Protector EA consistently monitors the account equity and closes all the market and pending orders once the account equity reached a fixed equity stop loss or profit target. After closing all trading positions, the EA can close all open charts to stop other expert advisors from opening more trading positions.
Equity Stop-Loss
If your current account balance is $5000 and you set an equity stop loss at $500. In this case, the KT Equity Protector will close all the active and pending
Smart Copy is an Easy-to-Use EA that supports Multi Copying Metatrader4 and Metatrader5 and Local/Remote Copying. (Remote Version is coming soon)
Free version is available on Smart Copy Local Free MT4
Specifications :
Real Time, Multi Terminal - Multi Account - MT4/MT5 trade copying Copy from netting to hedge and hedge to netting is supported.
Fast and instant copy
All settings are input visually. Easy modifying symbol names, prefix, suffix Enable/Disable co
The added video will show you the full functionality, effectiveness, and simplicity of this trade manager. Drag and Drop Trade Manager. Draw your entry and have the tool calculate the rest. Advanced targeting and close portions of a trade directly available in tool (manage trades while you sleep). Market order or limit order on either side with factored spread. Just draw the entry, the tool does the rest. Hotkey setup to make it simple. Draw where you want to enter, and the stop loss, the tool c
« Trade Sync » — Really fast copying and precise synchronization of trades. Simple installation and configuration of the application within 5 seconds allows you to copy trades between different MetaTrader terminals installed on one Windows PC or Windows VPS at maximum speed. «Trade Sync» contains a large number of options for customizing the application to your specific needs and allows you to cope with even complex user tasks. Separate use: Trade Sync MT4 - allows you to copy (Мt4 > Мt4), Trade
The product will copy all Discord signal to MT4 ( which you are member ) , also it can work as remote copier. Easy to set up. Work with almost signal formats, support to translate other language to English Work with multi channel, multi MT4. Work with Image signal. Copy order instant, auto detect symbol. Work as remote copier: with signal have ticket number, it will copy exactly via ticket number.
How to setup and guide: Let read all details about setup and download Discord To MetaTrade
Auto Trade Copier is designed to copy trades to multiple MT4, MT5 and cTrader accounts/terminals with 100% accuracy. The provider and receiver accounts must be on the same PC/VPS. With this tool, you can copy trades to receiver accounts on the same PC/VPS. All trading actions will be copied from provider to receiver perfectly. This version can be used on MT4 accounts only. For MT5 accounts, you must use Auto Trade Copier for MT5 . Reference: - For MT4 receiver, please download Trade Receiver Fre
Smooth Heikin Ashi provides a more smoothed signal of bull or bearish trends than regular Japanese candlesticks, or even the standard Heikin Ashi candles. Heikin Ashi as an alternative candlestick pattern that has been in use since its invention in Japan back in the 1700s. On normal Japanese candlesticks, there is a lot noise with mixed bearish and bullish candles side by side, even during trends. Heikin Ashi reduces this noise leaving an easier visual representation of trends. This indicator is
ユーザーは評価に対して何もコメントを残しませんでした