ARC Ichimoku
- インディケータ
- Shahabeddin Baset
- バージョン: 1.0
Combination of Ichimoku and Super Trend indicators.
1. ARC (Average Range times Constant)
The concept of ARC or Volatility System was introduced by Welles Wilder Jr. in his 1978 book, New Concepts in Technical Trading Systems. It has since been adapted and modified into the popular Super Trend indicator.
The fundamental idea behind ARC is simple: to identify support and resistance levels, you multiply a constant with the Average True Range (ATR). Then, you either subtract or add the resulting value to the last extremum point on the price chart.
The key difference between Wilder’s original ARC and the new Super Trend indicator lies in their treatment of support levels:
In the Super Trend, any support level lower than the previous day’s support level is ignored. Similarly, during a downtrend, any support level higher than the previous support level is disregarded.
Consequently, during an uptrend, only higher support levels are displayed on the chart, and during a downtrend, only lower support levels are shown.But as you can see there isn't any major difference in their calculations, so I prefer to save the original name of the indicator, i.e. ARC, which better describes the nature of this technical indicator.
2. ARC Ichimoku
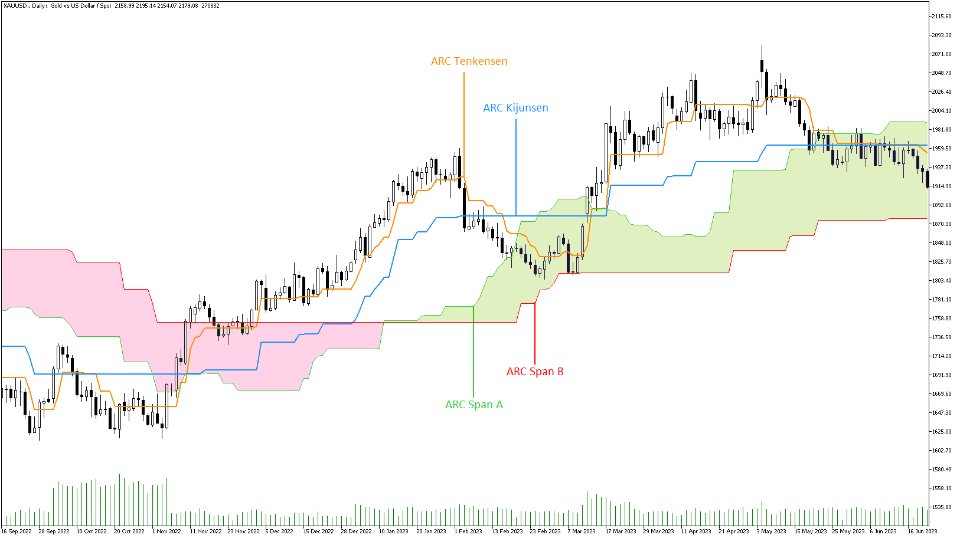
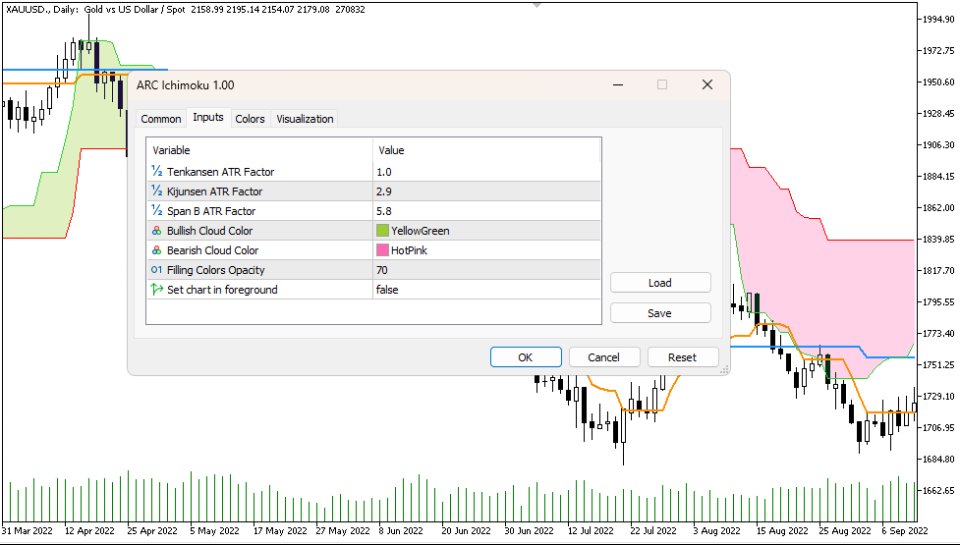
ARC Ichimoku is a variation of the classic Ichimoku indicator, but instead of using chart Max/Min values over fixed periods (e.g., 9, 26, 52), it employs the ARC with adjustable factors (constants) for the same periods:
- Tenkensen: This line represents an ARC (Super Trend) calculated using an adjustable factor based on a 9-period ATR.
- Kijunsen: Similar to Tenkensen, Kijunsen is also an ARC (Super Trend) calculated using an adjustable factor, but based on a 26-period ATR.
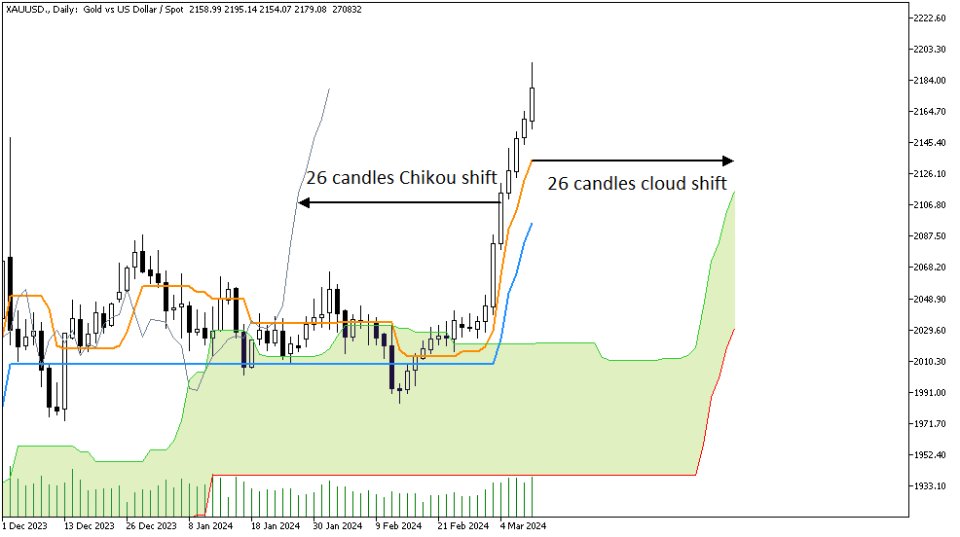
- Span A: Span A is the average of Tenkensen and Kijunsen, shifted forward by 26 candles.
- Span B: Span B is another ARC (Super Trend) calculated using an adjustable factor based on a 52-period ATR. It is then shifted forward by 26 periods.
- Chikou: Chikou represents the close price shifted backward by 26 candles.
3. Signals
You can use the classic Ichimoku signals for making trading decisions. These include:
- Tenkan-Kijun Cross: When Tenkensen crosses above/below Kijunsen, it signals a potential bullish/bearish trend.
- Price-Kijun Cross: This signal occurs when the price crosses above or below the Kijunsen line.
- Kumo Breakout: A breakout above or below the Kumo (cloud) indicates a potential trend reversal.
- Kumo color change: When the cloud color changes from red to green, or vice versa, it signals a potential trend reversal.
- Chikou Span Confirmation: When the Chikou (lagging span) crosses above or below the price, it confirms the prevailing trend direction.
If you’re interested in exploring more signals, consider checking out the description of my other indicator in the market: Ichimoku Signals Pro. It provides additional information on these signals and their strength.
Additionally, if you’d like to visualize these signals directly on your chart and receive live notifications on your Mobile App and MT5 terminal, you can order the ARC Ichimoku Signals indicator from the market.
Feel free to share any feedback or suggestions, and I’ll be ready to adjust or correct any part of this code based on your comments and reviews.
related topics:
Ichimoku, Tenkensen, Kijunsen, Senkou Span, Chikou Span, ATR, ARC, Volatility System, Super Trend, trend trading, support and resistance


good