• 概要
  • レビュー
  • コメント (1)

Semafor Entry Pro

Non-repaint price action pattern based indicator

works on all timeframe 

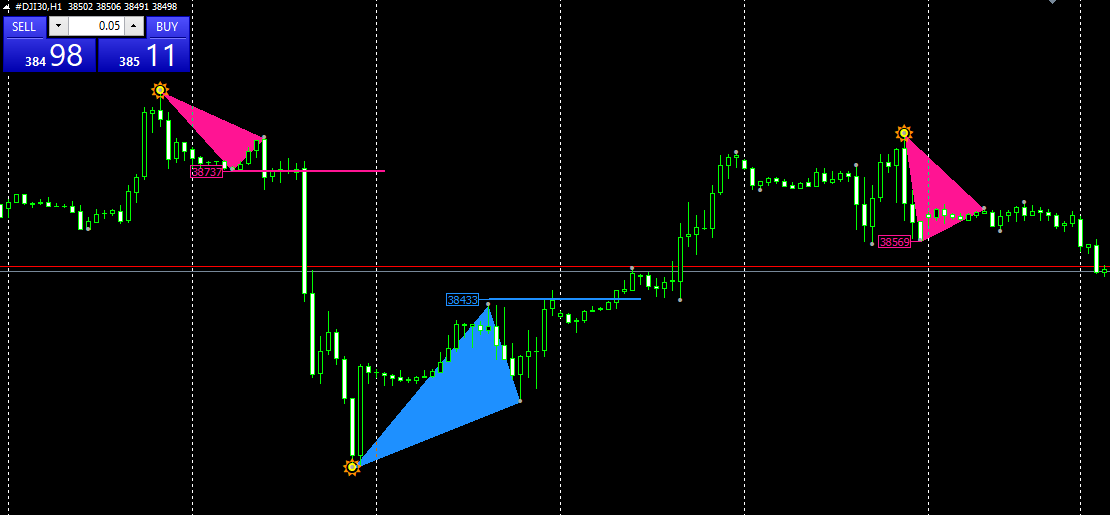
the indicator is based on a 123 Triangle pattern that happens everyday on the market 

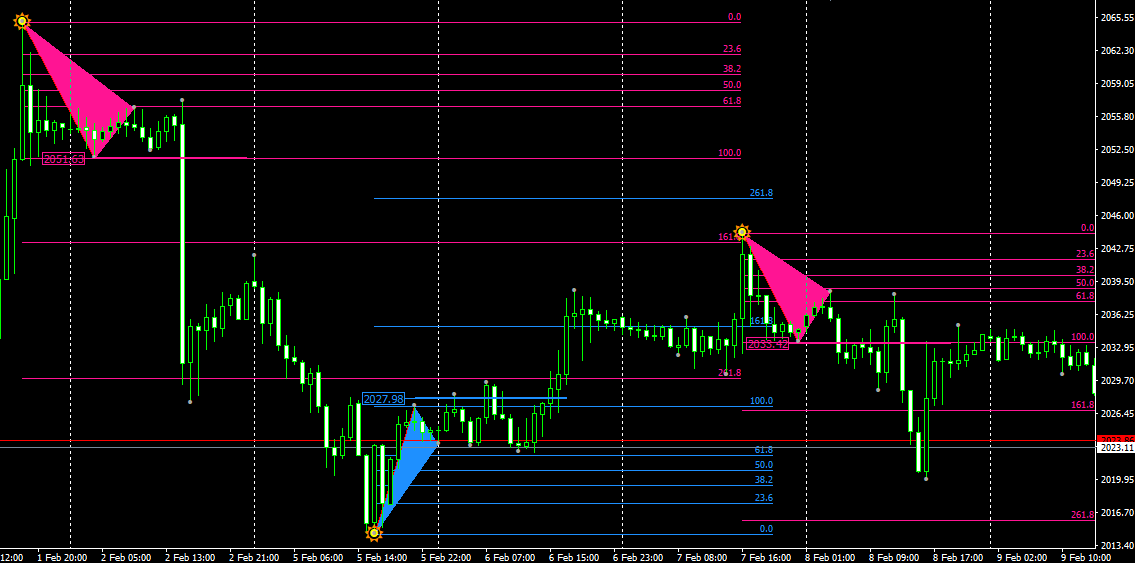
the indicator will point out the pattern for you and you can turn on Fib level to see your take profit.

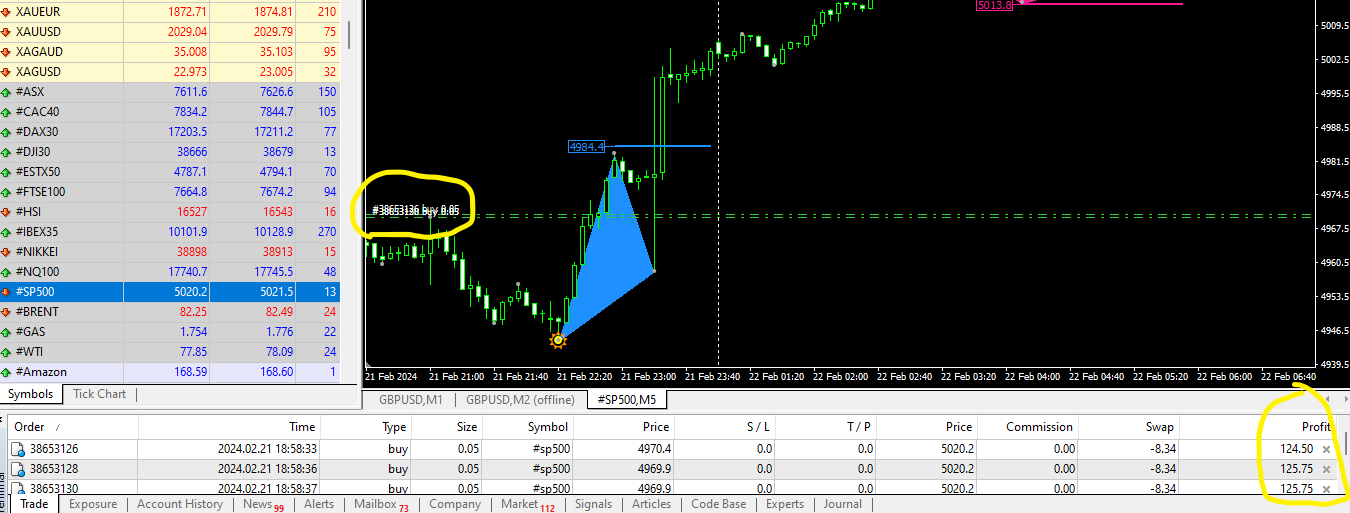
Blue triangle is a buy signal

Red triangle is a sell signal

horizonal blue and red lines is an indication to place your trail stop loss one price has reached that area

only entry when the triangle has fully formed


おすすめのプロダクト
Introducing the Donchian Channels indicator for MQL4, a powerful technical analysis tool designed to boost your trading success. This indicator consists of four lines that represent the upper and lower boundaries of price movement over a specified period. With the Donchian Channels indicator, you can easily identify potential breakouts and reversals in the market. The upper line shows the highest high of the specified period, while the lower line represents the lowest low. The space between thes
PTW NON REPAINT TRADING SYSTEM + HISTOGRAM Non-Repainting ,   Non-Redrawing   and   Non-Lagging  Trading System. Does the following: - Gives Accurate Entry and Exit Points - Scalping, Day and Swing Trading  - 95% Accuracy  - Targets, where to take profits. - Shows Trends, Support and resistance levels - Works on All Brokers - Works on All Currencies, CFDs and Stocks - It does not place trades for you, it only shows you what trades to place. - It works on All Timeframes - It is for Trend or ra
TRENDIEST TREND LINE   ️️️️️ Do you want to become a constantly profitable 5-star forex trader? ️️️️️ Trendiest Trend Line is a one of a kind trend line indicator, Trend lines work until the market reverses or consolidates. Easily stay out of the chop and stay in the long trends! Key Features of Trendiest Trend Line Stay in strong trends longer with confidence Clearly shows you when the market is ranging to save you money Entry signals help you get in at a good price 100% reliable
This indicator uses a different approach from the previous version to get it's trendlines. This method is derived from Orchard Forex, and the process of making the indicator is demonstrated in there video   https://www.youtube.com/watch?v=mEaiurw56wY&t=1425s . The basic idea behind this indicator is it draws a   tangent line   on the highest levels and lowest levels of the bars used for calculation, while ensuring that the lines don't intersect with the bars in review (alittle confusing? I kno
FREE
KT Tether Line MT4
KEENBASE SOFTWARE SOLUTIONS
The KT Tether Line is a trend-following tool consisting of three indicators that work together to generate trading signals. It can correctly identify market trends while signaling trade entries. It was first introduced by Bryan Strain in the Stock & Commodities magazine in 2000 in "How to get with the trend and out at the end." The Concept When a market trend is confirmed, the most challenging part is determining the timing of the entries. This indicator alerts you to potential trend reversal
This indicator continuously changes the color of candlestick borders and bodies, as well as the color of volumes in real time. The indicator is easy to use. The palette of colors is diverse. This product is a graphical solution, so it is difficult to describe what it does by text, it is easier to see by downloading it, besides the product is free. The indicator is suitable for bloggers who want to create a beautiful picture of a chart for video editing or traders who want to make their chart al
FREE
TDI Signals generates buy and sell arrows based on a TDI(Traders Dynamic Index) algorithm. It looks for price breakouts, continuations and reversals. By default it runs in the trend mode but user is provided with the option to change that to reversal mode. Trader can use the mode which compliments his/her trading style.  Usage:-   TDI Signals can be used as a stand alone indicator with context or even be added to strategies to make confirmations more strong. Volatility based stop loss, take pr
IF YOU PURCHASED THE INDICATOR -> Send me a message for bonus  settings parameters that WORKS ! and TACTICAL TREND EA for free ! The TACTICAL TREND INDICATOR is the greatest trend indicator on the market; it works on all time frames and assets and was created after 6 years of experience in the FX and other markets. Many trend indicators on the internet are incomplete, do not help, and are difficult to trade, but the   TACTICAL TREND   Indicator is different; it shows the signal to buy or sell,
このエキスパートアドバイザーは取引を行いませんが、マーケットウォッチ内のシンボル全体をスキャンし、異なる時間枠で各株を 1 つずつスキャンし、最後に、どの時間枠のどのシンボルが強力な巻き込みローソク足を持っているかを示します。 さらに、MA 期間と RSI の上限と下限を定義でき、どのタイムフレームのどのシンボルが調整済み移動平均を超えるか、また、どのタイムフレームのどのシンボルが調整移動平均の上限または下限を超えるかが表示されます。 RSI。 Kono ekisupātoadobaizā wa torihiki o okonaimasenga, mākettou~otchi-nai no shinboru zentai o sukyan shi, kotonaru jikan-waku de kaku kabu o 1-tsu zutsu sukyan shi, saigo ni, dono toki-waku no dono shinboru ga kyōryokuna makikomi rōsoku ashi o motte iru ka o shimeshimasu.
FREE
Considering the main theories of Forex (Dow Theory, support lines, chart patterns, and Fibonacci retracements), It tells you the price range where whales (large investors) are likely to appear. You can trade at the price points that professionals also aim for. You no longer have to warry about where to aim next. We are live-streaming the actual operation of the system. Please check for yourself if it is usable. Please check it out for yourself. https://www.youtube.com/@ganesha_forex We do no
This scanner is monitoring the entire market for trade opportunities for all symbols and for all   time frames. You don't have to look to all the charts, for all symbols and for all time frames. This scanner will alert you on your computer, or on your mobile, when a trade opportunity has been found.  You never have to miss a trade opportunity!   This indicator is designed to scan all pairs and symbols, for all time frames, to find a cross of the MACD main and signal line.   MACD Definition The
Similar to logic used in: Golden MA MTF TT   Overview "Golden MA" indicator for OB/OS levels. It's based on High/Lows of higher timeframe (HTF) previous bar. Only useful in swing trading or scalping. Best for at least M15+. For lower timeframes you'll need to change StartPips to lower value to get consistent lines. Because lower timeframes will have smaller pip distances.   Features - Define Higher Timeframes for Current Timeframe: Use a comma-separated list to define the higher timeframe for t
FREE
KFX Symbol Changer
Peter Kariuki Thande
4.67 (3)
KFX SMA: Symbol Changer + Moving Average (3x) + ATR + RSI + Candle Timer. This indicator allows you to create a Symbol list and change between symbols of the current chart or Timeframe by selecting the appropriate button. On Chart there are three(3) multi timeframe Moving Averages shown (selected by you), ATR Value MTF ( selected by you -  helps with setting SL and TP), RSI Value MTF (selected by you) and a Candle Timer.   Features: - Symbol Changer : Change Symbol and Timeframe of Chart.   (
FREE
Boost binary option profesional
Sebastian Alejandro Merino Sepulveda
Binarias & Forex (+90% Ratio-Win Next Candle) Espere que el precio llegue a una buena zona (fuerte) sea soporte, resistencia, zona de oferta o demanda, fibonacci level key, cifra redonda. Haciendo lo anterior definitivamente habrá una reversión en el precio y obtendrá su ITM en primera vela dando una efectividad del 100% siguiendo la tendencia. Es muy importante estar atento a las noticias fundamentales en el mercado y estas no afecten tu trading. Sesiones comerciales: cualquiera (24 horas).
Dear Trader It is my pleasure to introduce to you my tool called the " Forex Sniper Indicator" . The major aim of this tool is to help serious traders and investors in all type of Financial Markets to catch price next movement right at the moment the price direction is about to change. This tool can be used to snipe the price direction in both down trend, uptrend and ranging markets. This tool can be used as the stand alone tool though it may be combined with other tools as well. My goal is to h
This is a simple arrow system based on Engulfing Candlestick Pattern. It gives you alerts on your smartphone when there is an engulfing candlestick pattern happens. Which type of alerts available? 1. It paints on chart Up/Down Arrows. 2. Popup message and sound alert in trading terminal window. 3. Push notification or Alert on your Android and IOS mobile phones (requires MT4 or MT5 app installed!) *Note: Use it on higher timeframes like H4 (4 hours), D1 (1 Day) then find trade opportunities on s
MT4用FXインジケーター「トレンドエントリーヒストグラム」 トレンドエントリーヒストグラムインジケーターは、エントリーバーが表示されたら、トレンド方向へのエントリーシグナルの検索に使用できます。 このインジケーターにはユニークな機能があり、計算には価格と出来高の両方が必要です。 トレンドエントリーヒストグラムは 2 色で表示されます。弱気トレンドの場合は赤、強気トレンドの場合は青です。 安定したトレンド (同じ色のヒストグラム バーが最低 10 個連続) が表示されたら、エントリー バーを待ちます。 エントリーシグナルは、ヒストグラムの反対の色を持つ 1 つの列と、初期トレンドの色を持つ次の列です (図を参照) 短いターゲットを使用します - 現在のトレンドに応じてチャート上の最も近い高値/安値を使用します インジケーターにはモバイルおよび PC アラートが組み込まれています インジケーターの使用方法: - 買いシグナルの場合: 着実な強気トレンド (青いヒストグラム バー) + ヒストグラム上の 1 つの赤いバー + 1 つの青いバー (ここでロング取引を開く) - 売りシグ
The advantage of working on the Special Agent signal indicator is that the trader does not need to independently conduct a technical analysis of the chart. Determining the market trend is an important task for traders, and the tool gives ready-made signals in the form of directional arrows. This tool is an arrow (signal). Special Agent is a trend indicator, a technical analysis tool that helps to determine the exact direction of the trend: either up or down price movement for a trading pair o
Hello Guys! I want to share with you a very simple but very effective indicator, which I use a lot in my daily trading. Bollinger bands are one of the most effective tools in trading, especially for those who like to operate on low time frames and prefer fast operations. The indicator detects fast reversals: when the price close above or below the Bollinger Bands, but then re-enters in the Bands on the next candle, the indicator sends a signal and draws an arrow on the newly opened candle! It
Insight Pro is a comprehensive tool for market analysis. It offers various features such as trend analysis, resistance and support levels, and distribution analysis, suitable for both novice and experienced traders. Features Trend Analysis Detects and visualizes market trends. Suggests potential entry and exit points based on trends. Customizable trend lines for clear market direction. Displays extreme levels based on standard deviation. Positive slope indicates buy orders; negative slope indic
Mini FFMV Dashboard and CSM
Opengates Success International
1 (1)
Mini Forex Market-View Dashboard and Mini-CSM Mini Full Forex Market View Dashboard is a miniature creation of FULL FOREX MARKET_VIEW Custom indicator created to give the Traders a full view of what is going on in the market but in a partial matter to make it conscise. It is useful most especially for those who don't like bogus indicators or those who have a PC with limited screen size. It uses a real time data to access the market and display every bit of information needed to make a successful
MACD Scanner With Alerts
Niravkumar Maganbhai Patel
4 (3)
MACD Dashboard Panel   This indicator helps you to scan symbols which are in the Market Watch window and filter out a trend according to MACD. Moving Average Convergence Divergence (MACD) is a trend-following momentum indicator that shows the relationship between two moving averages of a security’s price. The MACD is calculated by subtracting the 26-period Exponential Moving Average (EMA) from the 12-period EMA. The result of that calculation is the MACD line. A nine-day EMA of the MACD call
FREE
Breakout Box
Claus Dietrich
4.33 (30)
BREAKOUT-SESSION-BOX LONDON EU US ASIA Open watch the expectation of a volatile movement above or under the opening range We take the high of the range as Entry for a long trade and SL will be the low of the range and vice versa the low of the range as Entry for a short trade and the high for SL The size of the range is the distance to the TP (Take Profit) The range of the opening hours should not be larger than about 1/3 of the average daily range 4 breakout examples are already predefined:
FREE
My Point MT4
Claudia Ramona Angerer
4 (1)
Diagnosis of major and minor pivot Trend detection with many signals Can be used in all symbols Can be used in all time frames Settings: Back Show: The number of candles it displays If you need any adjustments, or have any questions or suggestions, message me How to trade: Blue: sell signal Red: buy signal Blue and red at the same time: no signal Exit signal: Opposite signal
このマルチシンボルおよびマルチタイムフレームインジケーターは、次のローソク足パターンをスキャンします(パターンの説明についてはスクリーンショットを参照してください)。 3人の白人兵士(逆転>継続パターン) 3つの黒いカラス(反転>継続パターン) 強気と弱気のスリーラインストライク(反転パターン) インジケーター設定の厳密なオプションが有効になっている場合、パターンはより高い時間枠ではあまり頻繁に表示されません。しかし、そうする場合、それは非常に確率の高い設定です。 Thomas Bulkowski(国際的に有名な作家であり、ローソク足パターンの第一人者)によると、3ラインストライクはローソク足パターンの中で最高の全体的なパフォーマンスランクを持っています。このインジケーターを独自のルールや手法と組み合わせると、独自の強力なシステムを作成(または強化)できます。 特徴 マーケットウォッチウィンドウに表示されているすべてのシンボルを同時に監視できます。インジケーターを1つのチャートに適用し、市場全体を即座に監視します。 M1からMNまでのすべての時間枠を監視でき、パターンが識別されたときに
Harami Indi
Che Jeib Che Said
5 (1)
Harami is a two candle pattern with recent candle formed inside the previous candle's high and low . It represents indecision in the market and is used for breakout price action trading strategy.  This indi fires all signals to a dashboard on the chart including pop_up alert, push to phone notification and email. Harami has two types, bullish and bearish pattern. Enter long for bullish Harami and enter short for bearish Harami. Inputs : Currency Symbols: EURUSD,GBPJPY,USDJPY,USDCAD (default) , u
FREE
It could help to calculate Risk-Reward easily before placing a BUY-SELL position. TradeSizeCalculator is a Multi-Tasking Calculator. It will calculate the others when we define the value in one of the columns. Stoploss, risk percentage, risk-money, lot size, take-profit , reward-money, and reward-ratio. Depending on which value is changed. All values in the columns are editable. Also, we can get those calculation results by drag-drop the stop-loss/take-profit line. Parameter: The inputs below ar
Breakout FX
David Leander Tschacher
5 (1)
Breakout FX draws arrows and emits alarms if the price exceeds or falls below the previous n candles. ️ Breakout FX can be used in expert advisors. ️ Breakout FX can improve already existing trading strategies. ️ Breakout FX is very fast and is not repainting. Inputs Breakout Range [Candles] Breakout Price Type Arrow Size Enable Alerts Enable Push Notifications Enable Emails
macd との 3ma クロスに基づくバイナリー取引用のインジケーターで、バーが開いているときに買いシグナルと売りシグナルを与え、再ペイントやバックペイントは行いません。 このインジケーターはマーチンゲール取引用に作成されているため、高い勝率には焦点を当てておらず、連続して最も低い損失シグナル数に焦点を当てています。 戦略 : 最低入金額は 1000 単位で、1 単位で取引を開始します (取引サイズは資本 1000 ごとに 1 単位です) 現在のシグナルが失われた場合、次のシグナルでトレードサイズを2倍にします。連続で最大7つの損失シグナルを持つインジケーター設定のみを採用します。 過去 10000 キャンドル (x 個のキャンドル以上の履歴取引を表示するために設定で入力できる数値) -推奨タイマーフレーム:任意 -有効期限 : 運用された時間枠と同じ パラメーター : 1.高速馬期 2.ファストマタイプ 3.スローマ期 4..スローマタイプ 5.トレンドマ期間 6.トレンドマタイプ 7.バー数 (シグナルとバックテスト結果を表示するために使用する履歴
Description Better version of RSI indicator which offer a complete visual trading strategy and realize an auto-optimization Support:   We create great tools for the entire trading community. Most of them are free. If you believe in what we do  Support Us Here.   KEY LINKS:   How to Install  –  Frequent Questions  -  All Products  How is this indicator useful? NEVER repaints. Detect best parameters of RSI indicator, based on profit factor during the specified period. This indicator can be used as
このプロダクトを購入した人は以下も購入しています
Gann Made Easy は、ミスター・ギャンの理論を使用した取引の最良の原則に基づいた、プロフェッショナルで使いやすい外国為替取引システムです。 W・D・ガン。このインジケーターは、ストップロスとテイクプロフィットレベルを含む正確な買いと売りのシグナルを提供します。 PUSH通知を利用して外出先でも取引可能です。 購入後はご連絡ください!私の取引のヒントと素晴らしいボーナスインジケーターを無料で共有します! おそらく、ギャンの取引手法についてはすでに何度も聞いたことがあるでしょう。通常、ギャンの理論は初心者のトレーダーだけでなく、すでにある程度の取引経験がある人にとっても非常に複雑なものです。なぜなら、ギャンの取引手法は理論的にはそれほど簡単に適用できるものではないからです。私はその知識を磨き、最良の原則を私の外国為替インジケーターに組み込むために数年を費やしました。 このインジケーターは非常に簡単に適用できます。必要なのは、それをチャートに添付し、簡単な取引推奨事項に従うだけです。このインジケーターは常に市場分析の仕事を行い、取引の機会を探します。適切なエントリーポイントを検出
Gold Stuff
Vasiliy Strukov
4.89 (263)
Gold Stuff は、金専用に設計されたトレンド指標であり、あらゆる金融商品にも使用できます。 インジケーターは再描画せず、遅れません。 推奨時間枠 H1. それインディケータでフルオートExpert Advisor EA Gold Stuffが動作します。 あなたは私のプロフィールでそれを見つけることができます. 設定と個人的なボーナスを得るために、購入後すぐに私に連絡してください! トレンド スキャナーの強力なサポートを利用して、無料のインジケーターを入手し、プライバシーを守ります。あーみー!   設定 矢印を描く - オンオフ。 チャートに矢印を描く。 アラート - 可聴アラートのオンオフ。 メール通知 - オンオフ。 電子メール通知。 プチ通知 - オンオフ。 プッシュ通知。 次に、色域を調整します。 Gold Stuff は、金専用に設計されたトレンド指標であり、あらゆる金融商品にも使用できます。 インジケーターは再描画せず、遅れません。 推奨時間枠 H1. それインディケータでフルオートExpert Advisor EA Gold Stuff
An exclusive indicator that utilizes an innovative algorithm to swiftly and accurately determine the market trend. The indicator automatically calculates opening, closing, and profit levels, providing detailed trading statistics. With these features, you can choose the most appropriate trading instrument for the current market conditions. Additionally, you can easily integrate your own arrow indicators into Scalper Inside Pro to quickly evaluate their statistics and profitability. Scalper Inside
現在20%OFF! 初心者やエキスパートトレーダーのためのベストソリューション! このダッシュボードソフトウェアは、28の通貨ペアで動作しています。それは私達の主要な指標(高度な通貨の強さ28と高度な通貨インパルス)の2に基づいています。それは全体の外国為替市場の大きい概観を与えます。それは、すべての(9)時間枠で28の外国為替ペアのための高度な通貨の強さの値、通貨の動きの速度と信号を示しています。チャート上で1つのインディケータを使用して市場全体を観察し、トレンドやスキャルピングの機会をピンポイントで見つけることができたら、あなたのトレードがどのように改善されるか想像してみてください。 このインディケータには、強い通貨と弱い通貨の識別、潜在的な取引の識別と確認がより簡単になるような機能が搭載されています。このインディケータは、通貨の強さや弱さが増加しているか減少しているか、また、すべての時間枠でどのように機能しているかをグラフィカルに表示します。 新機能として、現在の市場環境の変化に適応するダイナミックなマーケットフィボナッチレベルが追加され、すでに当社のAdvan
Reversal First Impulse levels (RFI)    INSTRUCTIONS        RUS       -       ENG              R ecommended to use with an indicator   -   TPSpro  TREND PRO -  Version MT5 A key element in trading is zones or levels from which decisions to buy or sell a trading instrument are made. Despite attempts by major players to conceal their presence in the market, they inevitably leave traces. Our task was to learn how to identify these traces and interpret them correctly. Main functions: Displaying activ
The AT Forex Indicator MT4 is a sophisticated trading tool designed to provide traders with a comprehensive analysis of multiple currency pairs. This   powerful indicator   simplifies the complex nature of the forex market, making it accessible for both novice and experienced traders. AT Forex Indicator uses   advanced algorithms   to detect trends, patterns and is an essential tool for traders aiming to enhance their forex trading performance. With its robust features, ease of use, and reliabl
TPSpro TRENDPRO  - is a trend indicator that automatically analyzes the market and provides information about the trend and each of its changes, as well as giving signals for entering trades without redrawing! The indicator uses each candle, analyzing them separately. referring to different impulses - up or down impulse. Exact entry points into transactions for currencies, crypto, metals, stocks, indices!  -  Version MT5               DETAILED DESCRIPTION                R ecommended to use with
まず第一に、この取引ツールはノンリペイント、ノンリドロー、ノンラグの指標であり、プロの取引に理想的ですことを強調する価値があります。 オンラインコース、ユーザーマニュアル、デモ。 スマートプライスアクションコンセプトインジケーターは、新米から経験豊富なトレーダーまで、非常 に強力なツールです。Inner Circle Trader AnalysisやSmart Money Concepts Trading Strategiesなど、20以上の有用な指標を1つに組み合わせています。このインジケーターはスマートマネーコンセプトに焦点を当て、大手機関の取引方法を提供し、彼らの動きを予測するのに役立ちます。 特に、流動性分析に優れており、機関がどのように取引しているかを理解しやすくしています。市場のトレンドを予測し、価格の動きを慎重に分析するのに優れています。機関の戦略とトレードを合わせることで、市場の動向についてより正確な予測ができます。このインジケーターは多目的であり、市場構造を分析し、重要な注文ブロックを特定し、さまざまなパターンを認識するのに優れています。 このインジケー
mql5と Telegramの モーニング・ブリーフィングで、詳細とスクリーンショットを含む毎日のマーケット・アップデートをご覧 ください! FX Power MT4 NGは 、長年の人気を誇る通貨強度計FX Powerの次世代モデルです。 この次世代ストレングスメーターは何を提供するのでしょうか?初代FXパワーの魅力すべて プラス GOLD/XAUの強さ分析 より正確な計算結果 個別に設定可能な分析期間 カスタマイズ可能な計算上限値により、さらに優れたパフォーマンスを実現 もっと見たい人のための特別なマルチインスタンス設定 すべてのチャートでお好みの色を無限に設定可能 数え切れないほどの通知オプションにより、重要なことを見逃すことはありません。 Windows 11とmacOSのスタイルで角を丸くした新しいデザイン 魔法のように動くインジケーターパネル FXパワーの主な機能 すべての主要通貨の強さの完全な履歴 すべての時間枠における通貨の強さの履歴 すべてのブローカーとチャートで同一の計算結果 100%信頼できるリアルタイム計算 -> リペイントなし ドロップダウン・リストから
Trend Screener
STE S.S.COMPANY
4.83 (90)
トレンドインジケーター、1つのツールに組み込まれたすべての重要なトレンド機能を備えたトレンドトレーディングとフィルタリングのための画期的なユニークなソリューション! これは、すべてのシンボル/商品(外国為替、商品、暗号通貨、インデックス、株式)で使用できる100%再描画されていないマルチタイムフレームおよびマルチ通貨インジケーターです。 トレンドスクリーナーは、チャート内のドットで矢印トレンドシグナルを提供するインジケーターに続く効率的なインジケーターです。 トレンド分析インジケーターで使用できる機能: 1.トレンドスキャナー。 2.最大利益分析を備えたトレンドライン。 3.トレンド通貨強度メーター。 4.アラート付きのトレンド反転ドット。 5.アラート付きの強いトレンドドット。 6.トレンド矢印 毎日の分析例、毎日のシグナルパフォーマンス...など、トレンドスクリーナーインジケーターを使用して、ここで見つけることができます: ここをクリックしてください 期間限定オファー:トレンドスクリーナーインジケーターは、50ドルと生涯でのみご利用いただけます。 (元の価格125 $) MQ
通貨強さウィザードは、取引を成功させるためのオールインワン ソリューションを提供する非常に強力な指標です。このインジケーターは、複数の時間枠のすべての通貨のデータを使用して、このまたはその外国為替ペアのパワーを計算します。このデータは、使いやすい通貨インデックスと通貨パワーラインの形式で表され、特定の通貨のパワーを確認するために使用できます。 必要なのは、取引したいチャートにインジケーターを接続することだけです。インジケーターは、取引する通貨の実際の強さを示します。このインジケーターは、トレンドに合わせて取引するときに有利に利用できる売買高の圧力の極値も示します。このインジケーターには、フィボナッチに基づく可能なターゲットも表示されます。 このインジケーターは、PUSH 通知を含むあらゆるタイプのアラートを提供します。 購入後ご連絡下さい。私の取引のヒントをあなたと共有し、素晴らしいボーナスインジケーターを無料で提供します! 幸せで有益な取引をお祈りします。
市場の2つの基本原則に基づく日中戦略。 このアルゴリズムは、追加のフィルターを使用したボリュームと価格の波の分析に基づいています。インディケータのインテリジェントアルゴリズムは、2つの市場要因が1つに結合した場合にのみシグナルを出します。インディケータは、より高い時間枠のデータを使用して、M1チャート上の特定の範囲の波を計算します。そして波を確認するために、インジケーターはボリュームによる分析を使用します。 このインディケータはレディトレーディングシステムです。トレーダーが必要とするのは、信号に従うことだけです。また、インジケーターはあなた自身の取引システムの基礎になることができます。取引はミニッツチャートでのみ行われます。 インジケーターがMTFの原則を使用しているという事実にもかかわらず、インジケーターのアルゴリズムは可能な限り安定しています。 購入後、必ず私に書いてください!私の取引設定と推奨事項をあなたと共有します!
Indicator : RealValueIndicator Description : RealValueIndicator is a powerful tool designed specifically for trading on the EURUSD pair. This indicator analyzes all EUR and USD pairs, calculates their real currency strength values, and displays them as a single realistic value to give you a head start on price. This indicator will tell you moves before they happen if you use it right. RealValueIndicator allows you to get a quick and accurate overview of the EURUSD currency pair tops and bottoms,
Trend Punch
Mohamed Hassan
5 (16)
Manual guide:   Click here WEEK SALE PROMO:   $59 ONLY!  -- Next price is  $120 .  This indicator is unstoppable when combined with our other indicator called  Support & Resistance . After purchase, send us a message and you will get it   for  FREE as a BONUS! I like to use Trend Punch on XAUUSD on the M1 timeframe & higher ones!  Introducing Trend Punch , the revolutionary forex trend indicator that will transform the way you trade! Trend Punch is uniquely designed to provide pre
まず第一に、この取引インジケーターは再描画されず、再描画されず、遅延しないことを強調する価値があります。これにより、手動取引とロボット取引の両方に理想的なものになります。 ユーザーマニュアル:設定、入力、戦略。 アトミックアナリストは、価格の強さとモメンタムを利用して市場でより良いエッジを見つけるためのPA価格アクションインジケーターです。ノイズや誤ったシグナルを除去し、取引ポテンシャルを高めるための高度なフィルターを備えています。複雑なインジケーターの複数のレイヤーを使用して、アトミックアナリストはチャートをスキャンし、複雑な数学的計算をシンプルなシグナルと色に変換します。これにより、どのような初心者トレーダーでも理解して使用し、一貫した取引の決定を行うことができます。 「アトミックアナリスト」は、新規および経験豊富なトレーダー向けにカスタマイズされた包括的な取引ソリューションです。プレミアムインジケーターとトップノッチの機能を1つの取引戦略に組み合わせ、すべてのタイプのトレーダーにとって汎用性のある選択肢にします。 デイリートレーディングとスキャルピング戦略:高
現在26%オフ 初心者やエキスパートトレーダーに最適なソリューション! このインジケーターは、独自の機能と新しい計算式を取り入れた、ユニークで高品質、かつ手頃な価格のトレーディングツールです。たった1枚のチャートで28の為替ペアの通貨強度を読み取ることができます。新しいトレンドやスキャルピングチャンスの引き金となるポイントを正確に特定することができるので、あなたのトレードがどのように改善されるか想像してみてください。 ユーザーマニュアルはこちら  https://www.mql5.com/en/blogs/post/697384 これが最初の1本、オリジナルだ! 価値のないクローンを買わないでください。 特別な サブウィンドウの矢印で強い通貨の勢いを表示 GAPがあなたのトレードを導く! 基準通貨や気配値が売られすぎ・買われすぎのゾーン(外相フィボナッチレベル)にあるとき、個別チャートのメインウィンドウに警告表示。 通貨がレンジの外側から反落した場合、プルバック/リバーサルのアラート。 クロスパターンの特別なアラート 複数の時間枠を選択可能で、トレンドを素早く
ご紹介   クォンタム トレンド スナイパー インジケーターは 、トレンド反転を特定して取引する方法を変革する画期的な MQL5 インジケーターです。 13年以上の取引経験を持つ経験豊富なトレーダーのチームによって開発されました。     クォンタムトレンドスナイパーインジケーター   は、非常に高い精度でトレンドの反転を識別する革新的な方法で、あなたのトレーディングの旅を新たな高みに押し上げるように設計されています。 ***Quantum Trend Sniper Indicatorを購入すると、Quantum Breakout Indicatorを無料で入手できます!*** クォンタム ブレイクアウト インジケーターは、トレンドの反転を特定するとアラートを発し、矢印を示し、3 つのテイクプロフィットレベルを提案します。 初心者トレーダーにもプロのトレーダーにも適しています。 量子EAチャネル:       ここをクリック MT5のバージョン:       ここをクリック 推奨事項: 期間: すべての時間枠。最良の結果を得るには、
Advanced Supply Demand
Bernhard Schweigert
4.92 (313)
現在33%オフ 初心者にもエキスパートトレーダーにも最適なソリューション このインジケーターは独自の機能と新しい公式を多数内蔵しており、ユニークで高品質かつ手頃な取引ツールです。このアップデートでは、2つの時間枠ゾーンを表示できるようになります。より長いTFだけでなく、チャートTFとより長いTF(ネストゾーンを表示)の両方を表示できます。すべてのSupply Demandトレーダーの皆さんのお気に召すはずです。:) 重要情報の公開 Advanced Supply Demandの可能性を最大化するには、 https://www.mql5.com/ja/blogs/post/720245 にアクセスしてください。   エントリーまたはターゲットの正確なトリガーポイントを正確に特定できれば取引がどのように改善されるか想像してみてください。新しい基盤となるアルゴリズムに基づいて構築されているため、買い手と売り手の間の潜在的な不均衡をさらに簡単に特定できます。これは、最も強い需要と供給のゾーンと、過去のパフォーマンス(古いゾーンを表示)がグラフィカルに表現されるためです。これらの機能は、最適
TrendMaestro
Stefano Frisetti
5 (3)
note: this indicator is for METATRADER4, if you want the version for METATRADER5 this is the link:  https://www.mql5.com/it/market/product/108106 TRENDMAESTRO ver 2.4 TRENDMAESTRO recognizes a new TREND in the bud, he never makes mistakes. The certainty of identifying a new TREND is priceless. DESCRIPTION TRENDMAESTRO identifies a new TREND in the bud, this indicator examines the volatility, volumes and momentum to identify the moment in which there is an explosion of one or more of these data a
JULY OFFER 80% OFF next price for unlimited version will be 17000$. This is the only time you can get this institutional and professional indicator at this price for unlimited version. Don't dare to miss this. The tool I am about to introduce to you you can't compare it with other tools due to its strategy and accuracy level in predicting the next price directional movement . This tool is designed for serious traders who have decided to make a difference through trading. Be the next person to wi
ご紹介     Quantum Breakout PRO は 、ブレイクアウト ゾーンの取引方法を変革する画期的な MQL5 インジケーターです。 13年以上の取引経験を持つ経験豊富なトレーダーのチームによって開発された Quantum Breakout PROは 、革新的でダイナミックなブレイクアウトゾーン戦略により、あなたの取引の旅を新たな高みに押し上げるように設計されています。 クォンタム ブレイクアウト インジケーターは、5 つの利益ターゲット ゾーンを備えたブレイクアウト ゾーン上のシグナル矢印と、ブレイクアウト ボックスに基づいたストップロスの提案を提供します。 初心者トレーダーにもプロのトレーダーにも適しています。 量子EAチャネル:       ここをクリック MT5バージョン:   ここをクリック 重要!購入後、インストールマニュアルを受け取るためにプライベートメッセージを送ってください。 推奨事項: 時間枠: M15 通貨ペア: GBPJPY、EURJPY、USDJPY、NZDUSD、XAUUSD アカウントの種類: ECN、Raw、また
Enigmera
Ivan Stefanov
5 (4)
エニグメラ:市場の中核 https://www.enigmera.com はじめに このインディケータと取引システムは、金融市場に対する驚くべきアプローチです。ENIGMERAは、フラクタルサイクルを使用して、サポートとレジスタンスレベルを正確に計算します。本格的な蓄積局面を示し、方向性と目標を示します。 トレンド中でも調整中でも機能するシステムです。 どのように作動するのか? ENIGMERAは、支持線・抵抗線、目標線、乖離線の3つのラインで構成されています。このシステムは、過去のデータを現在と未来に外挿する典型的な市場指標とは異なり、現在の完全な画像を提供します。支持線上にある場合、それは本当の支持を意味し、抵抗線上にある場合、それは本当の抵抗を意味する。ある水準が破られた場合、それはトレンドの変化を意味する。再描画はしない。 市場は常に進化しているため、ENIGMERAはその評価ツールを適応させ、定期的に戦略を修正しています。  これにより、すべてのシナリオが徹底的に評価されることが保証されます。この市場指標の独自性は、その能力を見れば明らかです。  ENIGM
ADR反転インジケーターは、通常の1日の平均レンジに関連して価格が現在取引されている場所を一目で示します。価格が選択した平均範囲とレベルを超えると、ポップアップ、電子メール、またはプッシュを介して即座にアラートを受け取るため、プルバックと逆転にすばやくジャンプできます。インディケータは、チャート上に1日の平均レンジの極値で水平線を描画し、それらを超える価格の数学的確率が付加されているレベルを超える延長も描画します。詳細については、以下をご覧ください... インジケーターとモニターを補完するADRアラートダッシュボードここでも利用可能なすべてのペア:https:// www.mql5.com/en/market/product/62756 MT5バージョンはこちらからも入手できます:https:// www.mql5.com/en/market/product/64477/ 通常の1日平均レンジ(ADR)内で価格が取引され、これらのレベルを上回っている時間の約60%は、通常、その後の引き戻し(利益確定)の動きを伴う急激な価格の動きの指標です。毎日の範囲の上部または下部からの
Cycle Sniper
Elmira Memish
4.41 (37)
NEW YEAR SALE PRICE FOR LIMITED TIME!!! Please contact us after your purchase and we will send you the complimentary indicators to complete the system Cycle Sniper is not a holy grail but when you use it in a system which is explained in the videos, you will feel the difference. If you are not willing to focus on the charts designed with Cycle Sniper and other free tools we provide, we recommend not buying this indicator. We recommend watching the videos about the indiactor and system before pu
TrendDecoder Premium
Christophe Pa Trouillas
5 (6)
レンジと次の動きを特定    |  トレンドの最も早いシグナルと強さを得る   |  反転の前に明確な出口を得る   |  価格がテストするフィボ・レベルを見つける。 非リペイント、非遅延インディケータ - マニュアルおよび自動売買に最適 - すべての資産、すべての時間単位に対応 期間限定キャンペーン   >> 50%OFF 購入後、 推奨セッティングについては、このチャンネルで私に連絡してください。 MT5 バージョン: ここをクリック BladeSCALPER   と   PowerZONES   を使った完全な方法を入手する どのようなものですか? TrendDECODERは、トレンド監視をシンプルかつ簡単にするための複数のイノベーションを集約したものです。 Projective TrendLine (投影トレンドライン) - 今後のトレンドのスピードリファレンス。 RealTime TrendLine vs. Projective TrendLine (リアルタイムトレンドライン vs. Projective TrendLine) - 市場が同じ方
トレンドラインマップインジケーターは、トレンドスクリーナーインジケーターのアドオンです。トレンドスクリーナー(トレンドラインシグナル)によって生成されたすべてのシグナルのスキャナーとして機能します。 これは、トレンドスクリーナーインジケーターに基づくトレンドラインスキャナーです。 Trend Screener Pro インジケーターがない場合、Trend Line Map Proは機能しません。 ブログにアクセスすると、トレンドラインマップインジケーターの無料バージョンをダウンロードできます。 Metatrader Testerの制限なしで、購入する前に試してみてください。 :    ここをクリック 1.簡単になる利点 通貨と時間枠に基づいて売買シグナルを表示します。 チャートに矢印が表示されてから価格が増減したピップ数を評価します。 (トレンドスクリーナーインジケーター矢印) 信号のタイミングを表示します。 アラートを売買するための複数の時間枠と複数の通貨のアラートを取得します。 2.トレンドラインマップの使用方法 売買シグナルダッシュボードを表示す
現在31%オフ! 初心者やエキスパートトレーダーに最適なソリューション! このインジケータは、独自の機能と秘密の数式を組み込んだ、ユニークで高品質かつ手頃な価格のトレーディングツールです。たった1枚のチャートで28の通貨ペアのアラートを表示します。新しいトレンドやスキャルピングチャンスの引き金となるポイントを正確に把握することができるので、あなたのトレードがどのように改善されるか想像してみてください! 新しい基本的なアルゴリズムに基づいて構築されているため、潜在的な取引の特定と確認がより簡単になります。これは、通貨の強さや弱さが加速しているかどうかをグラフィカルに表示し、その加速のスピードを測定するためです。加速すると物事は明らかに速く進みますが、これはFX市場でも同じです。つまり、反対方向に加速している通貨をペアにすれば、利益を生む可能性のある取引を特定することができるのです。 通貨の勢いを示す縦の線と矢印は、あなたの取引の指針となるでしょう。 ダイナミックマーケットフィボナッチ23レベルはアラートトリガーとして使用され、市場の動きに適応します。もしインパルスが黄色
FX Volume
Daniel Stein
4.61 (36)
mql5と Telegramの モーニング・ブリーフィングで、詳細とスクリーンショットを含む毎日のマーケット・アップデートをご覧 ください! FX Volumeは、ブローカーの視点から市場のセンチメントをリアルに洞察する、最初で唯一の出来高インジケーターです。 ブローカーのような機関投資家が外国為替市場でどのようなポジションをとっているか、COTレポートよりもはるかに速く、素晴らしい洞察を提供します。 この情報をチャート上で直接見ることは、あなたの取引にとって真のゲームチェンジャーであり、画期的なソリューションです。 以下のようなユニークなマーケットデータ洞察から利益を得てください。 比率は 、通貨のロングポジションとショートポジションの比率をパーセントで表示します。 比率の変化は 、選択した期間内のロング比率とその変化率を表示します。 Volumes Totalは 、通貨の取引量(ロングとショート)の合計をロット単位で表示します。 Volumes Long :全通貨のロングポジションの取引量を表示します。 Volumes(ショート )は、全通貨のショートポジションの取引量を表示
TakePropips Donchian Trend Pro
Eric John Pajarillaga Aldana
4.61 (18)
TakePropips Donchian Trend Pro   (MT4) は、ドンチャン チャネルを使用してトレンドの方向を自動的に検出し、エントリーとエグジットの取引シグナルを提供する強力で効果的なツールです! この多機能インジケーターには、トレンド スキャナー、取引シグナル、統計パネル、スクリーナー、取引セッション、およびアラート履歴ダッシュボードが含まれます。取引シグナルを提供し、チャートを分析する時間を節約するように設計されています! ユーザー マニュアルとインストール ガイドは、ブログ投稿 (   https://www.mql5.com/en/blogs/post/751368   ) からダウンロードできます。 今日は 50% オフ! 98ドルから49ドルに値下げ! このインジケーターは、ストラテジー テスターでテストできます (ビジュアル モードを有効にします)。 詳細については、説明の下にあるビデオ チュートリアルも利用できます。 ご不明な点やサポートが必要な場合は、私に連絡してください。 TakePropips Donchian Trend Pro イン
ICT, SMC, SMART MONEY CONCEPTS, SMART MONEY, Smart Money Concept, Support and Resistance, Trend Analysis, Price Action, Market Structure, Order Blocks, BOS/CHoCH,   Breaker Blocks ,  Momentum Shift,   Supply&Demand Zone/Order Blocks , Strong Imbalance, HH/LL/HL/LH,    Fair Value Gap, FVG,  Premium  &   Discount   Zones, Fibonacci Retracement, OTE, Buy Side Liquidity, Sell Side Liquidity, BSL/SSL Taken, Equal Highs & Lows, MTF Dashboard, Multiple Time Frame, BigBar, HTF OB, HTF Market Structure, 
作者のその他のプロダクト
Boom and crash smasher
Lesedi Oliver Seilane
4.53 (38)
Boom and crash smasher free indicator that works on all timeframe from the one minute to the monthly timeframe. the indicator is 100% non-repaint. the indicator come with sound alerts and email push notification the indicator appears on the current candle stick for faster entries can be used on all charts and renko charts orange dot is your sell signal blue dot is your buy signal
FREE
Buy and Sell Glide Arrow  non-repaint and arrow appears on current candlestick orange arrow is a sell signal blue arrow is a buy signal Buy and Sell Glide Arrow works on 1 minute, 5 minutes and 15 minutes timeframes only as it is a scalping indicator. Pairs to trade: Forex pairs such as EURUSD,GBPUSD and other METALS: XAUUSD(GOLD) and other INDICES: Boom and crash 1000, Volatility Pairs such as VIX 10 - VIX 100 and other Lastly BTC AND LTC and other
Nas100 killer V2 (See video of how we test the indicator live) 1000% non-repaint indicator appears on current candlestick. Timeframes: M5, M15, M30, H1, H4. Works on pairs such as (NAS100, US30, SPX500, and Gold) The indicator is strictly for scalping do not hold trades for too long. Orange arrows look for selling opportunities. Light Blue arrows look for buying opportunities. 
SMC Traders
Lesedi Oliver Seilane
5 (8)
SMC Traders is a non-repaint indicator that is based on Price Action The indicator uses current market structure to predict future reversals. The indicator can be used with our free Market structure zig zag which can be found here:  https://www.mql5.com/en/market/product/91579 Please note to find the HH AND HL CLINK ON LINK ABOVE Timeframes: 15 minutes for scalping 1 Hour for swing trading Purple Arrow look for sells in conjunction with LL White Arrow look for buys in conjunction with HL
FREE
Market Structure Zig Zag
Lesedi Oliver Seilane
4.8 (25)
Free Market structure zig zag to assist in price action trading the screenshots describe how to use and how to spot patterns new version comes with alerts, email alert and  push notification alert can be used on all pairs  can be used on all timeframes  you can add additional confirmation indicators the indicator shows you your higher high and low highs as well as your lower lows and lower highs  the indication makes price action analysis easier to spot.
FREE
non-repaint free MT5 technical indicator works on all timeframes 1 minute to the monthly timeframe  the trade vision buy and sell arrow is a multi currency and synthetic indicator Trade vision buy and sell arrow comes with Push Alerts purple arrow look for selling opportunities white arrow look for buying opportunities.  wait for candle to close and arrow to appear before taking any trades.
FREE
Boom and crash Gold Miner v2 trend histogram which works in conjunction with the indicator above that has arrows as shown in the video. PLEASE Note: That the top indicator and the bottom indicator are two separate indicators. the top indicator is  https://www.mql5.com/en/market/product/98066 the bottom one is free. which is the histogram at the bottom.  the trend histogram trading tool that helps to easy detect the trend blue color indicates an uptrend. Orange color is a down trend. 
FREE
Boom and Crash Gold miner v2 Trading indicator based on market momentum works on m1 for boom and crash 1000 and M5 time frame for normal trading pairs wait for blue arrow to appear plus change of candle stick color and candlesticks must be above the 2 modified moving averages then you can buy the market. wait for orange arrow to appear plus change of candle stick color and candlesticks must be below the 2 modified moving averages  then you can sell the market.
US30 Revolt
Lesedi Oliver Seilane
4.67 (6)
US30 Revolt a Technical indicator that is 100% non-repaint and appears on the current candlestick  works on all timeframes (recommended M15,M30,H1) The indicator is made for US30 but it can be used on other pairs as well When a blue arrow appears look for buying opportunities  When a orange arrow appears look for selling opportunities Please watch the YouTube video on how to properly set up and use the indicator
FREE
Advanced artificial intelligence indicator that is 100% non-repaint and appears on current candlestick. The indicator is based on arrows which serve as your entry points. Buy arrow is your buy signal and orange arrow are your sell signal as more arrows appear the stronger the trend and you can add more entries. The indicator works on all timeframe from the one-minute timeframe to the monthly timeframe. The AI Non-repaint indicator works on all forex pairs.
Volality Index scalper indicator  Meant for Volality pairs such as Volality 10, 25, 50, 75 and 100 The indicator works on all timeframes from the 1 minute to the monthly timeframe the indicator is non repaint the indicator has 3 entry settings 1 color change on zero cross 2 color change on slope change 3 color change on signal line cross Orange line is your sell signal Blue line is your buy signal.
updated hidden market support and resistance. this indicator is made for new current market that has new support and resistance that some traders struggle to see. The indicator works on all timeframes from the 1-minute timeframe to the monthly One Trading tip to use When price is at resistance and the indicator appears wait for a bearish candle to close then enter a sell trade. Same applies for a buy trade when price reaches support level, and the indicator appears wait for the bullish candle
FREE
Nasdaq Savages Non-repaint indicator  works on all timeframes 1 minute to 15 minutes timeframe for scalpers. 30 Minutes to Monthly timeframe for swing traders The Nasdaq Savages indicator comes with a top right info tab which tells you about the current buy or sell signal, Profit in pips, Stop loss and Target Red arrow is your sell entry signal the white right tick is your exit signal and take profit hit signal Light blue arrow is your buy entry signal the white right tick is your exit signal an
Volality 75 Fractal Scalper Non-repaint The arrows appear on the current candle.  momentum and trend based strategy Works on all timeframes from the 1 Minute to the Monthly timeframe Bollinger bands have been added to show the trend direction whether its bullish or bearish Blue fractal arrow is your buy entry Orange fractal arrow is your sell entry you can use the Vix 75 fractal scalper in combination with other indicators.   
Median Renko Terminator works best with renko charts if you do not have a renko chart generator I will email it to you for free and give you the correct settings for scalping or to swing trade NON-REPAINT  COMES WITH ALERTS WHEN THERE IS A SIGNAL Conditions to sell: big purple arrow shows you the direction first then you take the small purple arrow to enter the same direction of the purple arrow. Conditions to buy: big white arrow shows you the up direction first then you take small white arrow
1000% non-repaint high accuracy signal technical indicator. Solar wind Predator work on all pairs with high and low volatility Solar wind Predator work from the 1 minute timeframe to the Monthly timeframe Swing trading H1 to W1 Scalping M1 to M30 Blue arrows above the zero line look for buying(bullish) opportunities. Orange arrows below zero line look for selling(bearish) opportunities.
Here is the boom and crash crazy Ma scalper a secretly coded color MA that is 1000% NON-REPAINT Works best on boom and crash 1000 Can be used on all timeframes from the 1 Minute timeframe to the Monthly timeframe  The indicator is also a multi-time frame indicator you can select which timeframe to use The indicator is made for scalping purposes. as the trend changes the color of the indicator changes all well  
Boom and Crash Buy and Sell Trend. Non-repaint. Can be used on all timeframes 1 minute for scalpers. 5 minute to monthly timeframe for swing trading. works on all boom and crash pairs Crash300, Crash500, Crash1000. Boom300, Boom500, Boom1000. Green histogram colour means the trend is up(bullish) Buy signal. Dark orange histogram colour means the trend is down(bearish) Sell signal.
フィルタ:
レビューなし
レビューに返信