ADXW Cloud
- インディケータ
- Shahabeddin Baset
- バージョン: 1.0
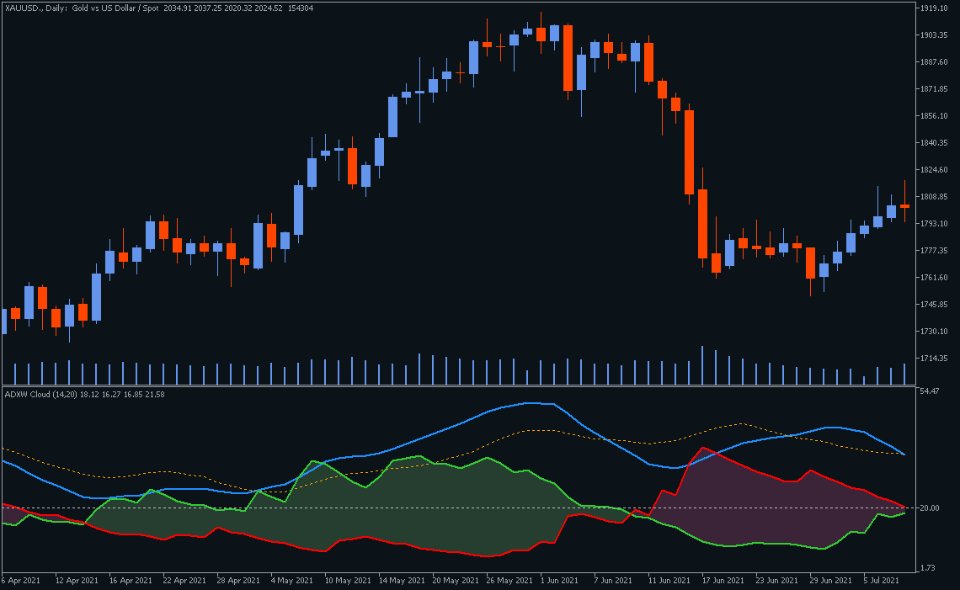
This is Wilder's ADX with cloud presentation of DI+ & DI- lines.
Features
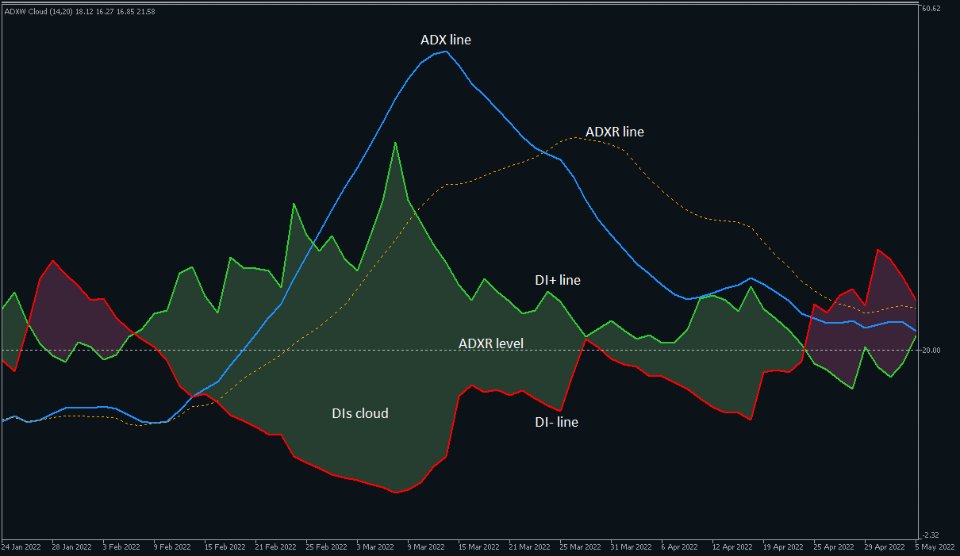
- 4 standard lines of the ADX indicator: DI+, DI-, ADX, ADXR
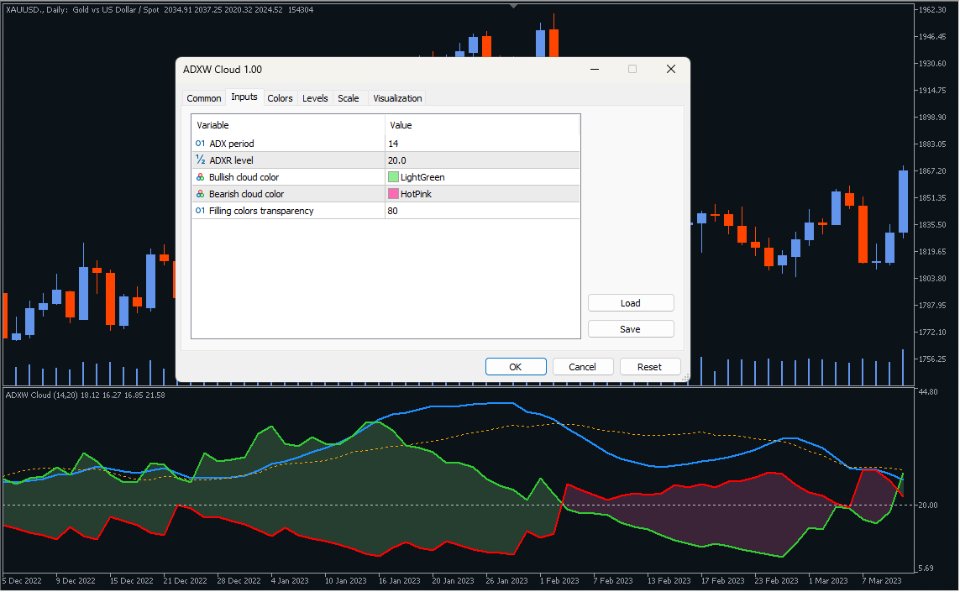
- cloud presentation of DI+/DI- lines with transparent colors
- applicable to all time-frames and all markets
What Is ADX
J. Welles Wilder Jr., the developer of well-known indicators such as RSI, ATR, and Parabolic SAR, believed that the Directional Movement System, which is partially implemented in ADX indicator, was his most satisfying achievement. In his 1978 book, New Concepts in Technical Trading Systems, He said:
I have probably spent more time studying directional movement than any other concept. Certainly one of my most satisfying achievements was the day I was actually able to reduce this concept to an absolute mathematical equation.
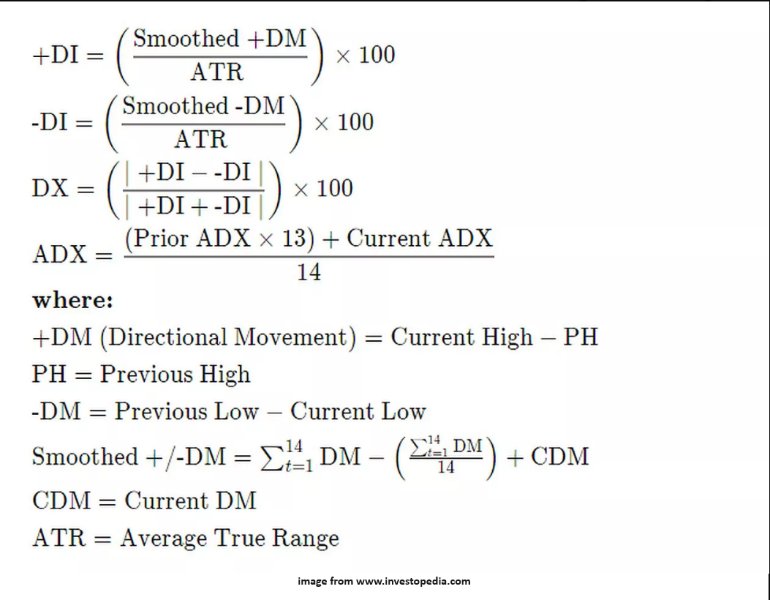
The core idea of this indicator is to record directional movements whenever there is a higher high or lower low. The indicator then calculates the smoothed moving average of these directional movements to determine the Directional Indexes (DIs), which are represented as DI+ and DI- lines within the ADX indicator (or as cloud in this version). The Average Directional Index (ADX) line is derived by dividing the difference between the DIs by their sum total. (You can see the calculations in the attached pictures.)
To Trade Using the ADX
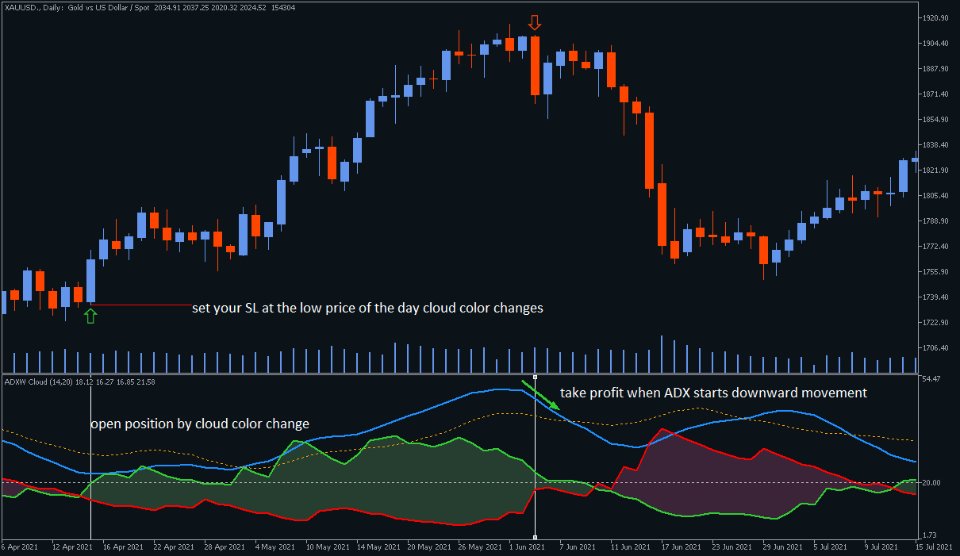
- When the cloud's color changes from red to green (indicating a cross of the DIs), enter a long position and set your stop loss at the low price of the day (identified as the Extreme Point by Wilder).
- Avoid opening any positions when the ADX line (blue line) is below the cloud (both DI lines) or when the ADXR line (orange dotted line) is below 20. Similar rules apply for opening short positions when the cloud's color changes from green to red.
- Reverse your position when the cloud's color changes again, but do not reverse (and hold the current position) if the price doesn't close below the Extreme Point.
- Take profit when the ADX line is above the cloud (both DI lines) and begins a downward movement. You can re-enter in the same direction if the ADX line starts another upward movement or with the next change in cloud color.
- Exit the current position when the ADX line falls below the cloud (both DI lines), as the trend is considered exhausted at this point.
By following the instructions outlined above, which are abstracted from Wilder's book, you can implement this trading system yourself. However, there is also a PRO version of the ADX indicator available (ADXW Cloud Pro), which automatically plots these points and data on the chart, simplifying the trading process with the Directional Movement System, and you can purchase it in my page on the mql5 market.



Thanks, very helpful.