ParbMA The Most Intuitive Parabolic SAR
- インディケータ
- David Ben Svaiter
- バージョン: 1.5
- アクティベーション: 5
テクニカル分析の領域では、ParbMAはParabolic SARのトレンドを調査するための非常に直感的なツールとして浮かび上がります。この革新的なアプローチは、カスタマイズ可能なラインを活用し、その色、形状、幅のオプションにおいてその汎用性が際立っています。この柔軟性により、視覚的な分析が向上し、戦略の立案や意思決定に大きく役立ちます。
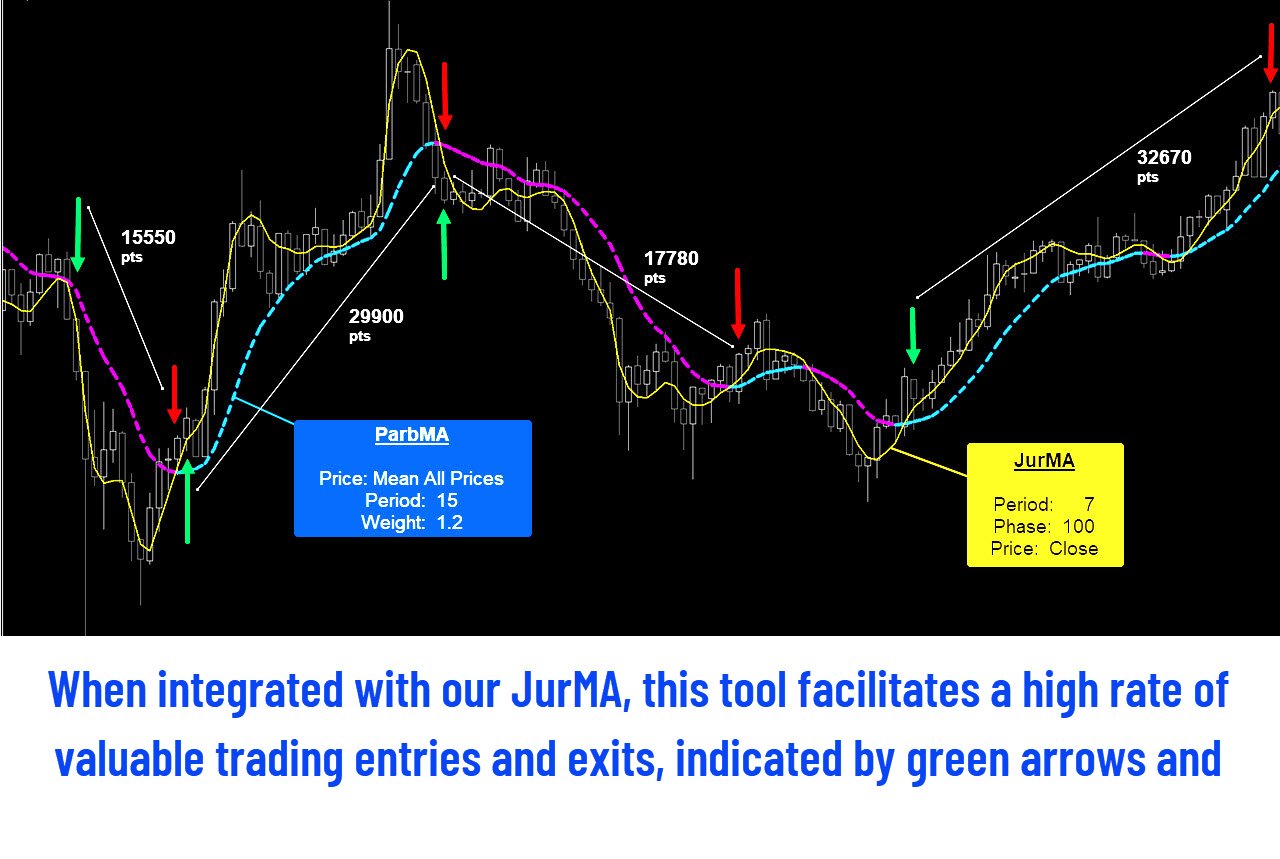
ParbMA(Parabolic Moving Average)は、J. Welles WilderのParabolic SAR(Stop and Reverse)と移動平均の概念を組み合わせたカスタムの技術指標です。このハイブリッド指標は、これらの手法の利点を捉え、金融市場における価格トレンドと潜在的な反転ポイントを追跡する独自の方法をトレーダーに提供することを目的としています。
ParbMAの主な特徴
カスタマイズ可能な視覚的表現: ParbMAの中心には、ラインを通じてトレンドを表現する能力があります。ユーザーはこのラインを好みに合わせて、様々な色、形状、幅から選択することができます。このカスタマイズのレベルにより、トレンドの表現がユーザーの分析スタイルと要件に完璧に合致します。
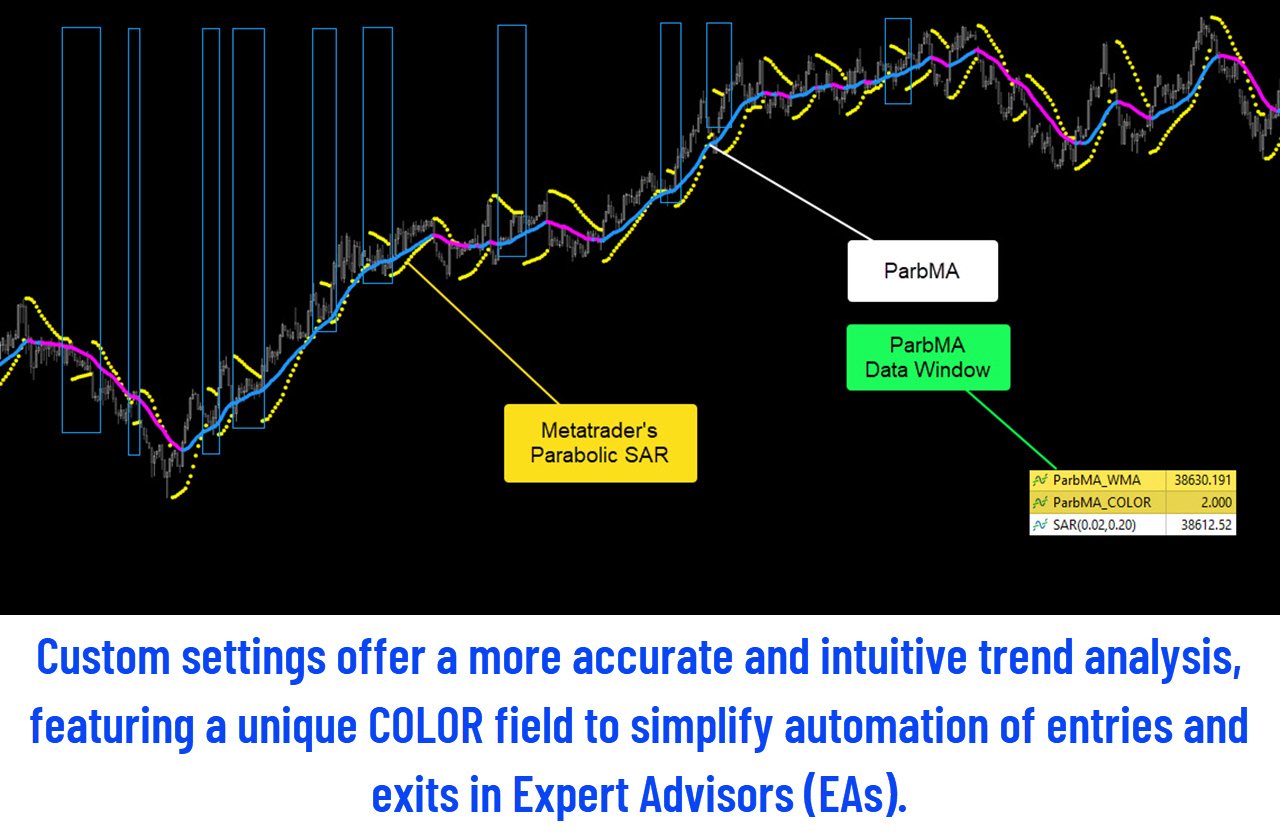
Expert Advisors(EAs)との簡単な統合: ParbMAのユーティリティはExpert Advisorsの領域にも広がり、Parabolic SARをサポートする自動取引戦略に対して独自の利点を提供します。トレンドの色の変更に依存する戦略の実装を簡素化する「色のフィールド」の組み込みが含まれています。わかりやすいカラーコードシステムを提供することで、ParbMAはプログラマーがトレンドの変化を素早く識別し、それに応じて戦略を調整するのに役立ちます。このスムーズで効率的な統合により、EAsのトレンド分析の能力が向上します。
ParbMAはParabolic SARトレンドを分析するための包括的で使いやすいツールとして際立っています。カスタマイズ可能な視覚的要素と革新的な色のフィールド機能の組み合わせにより、これはマニュアルトレーダーやExpert Advisorsを利用するトレーダーの両方にとって貴重な資産となります。トレンド分析のプロセスを簡素化し、向上させることで、ParbMAはより効率的で効果的な取引戦略の道を開きます。
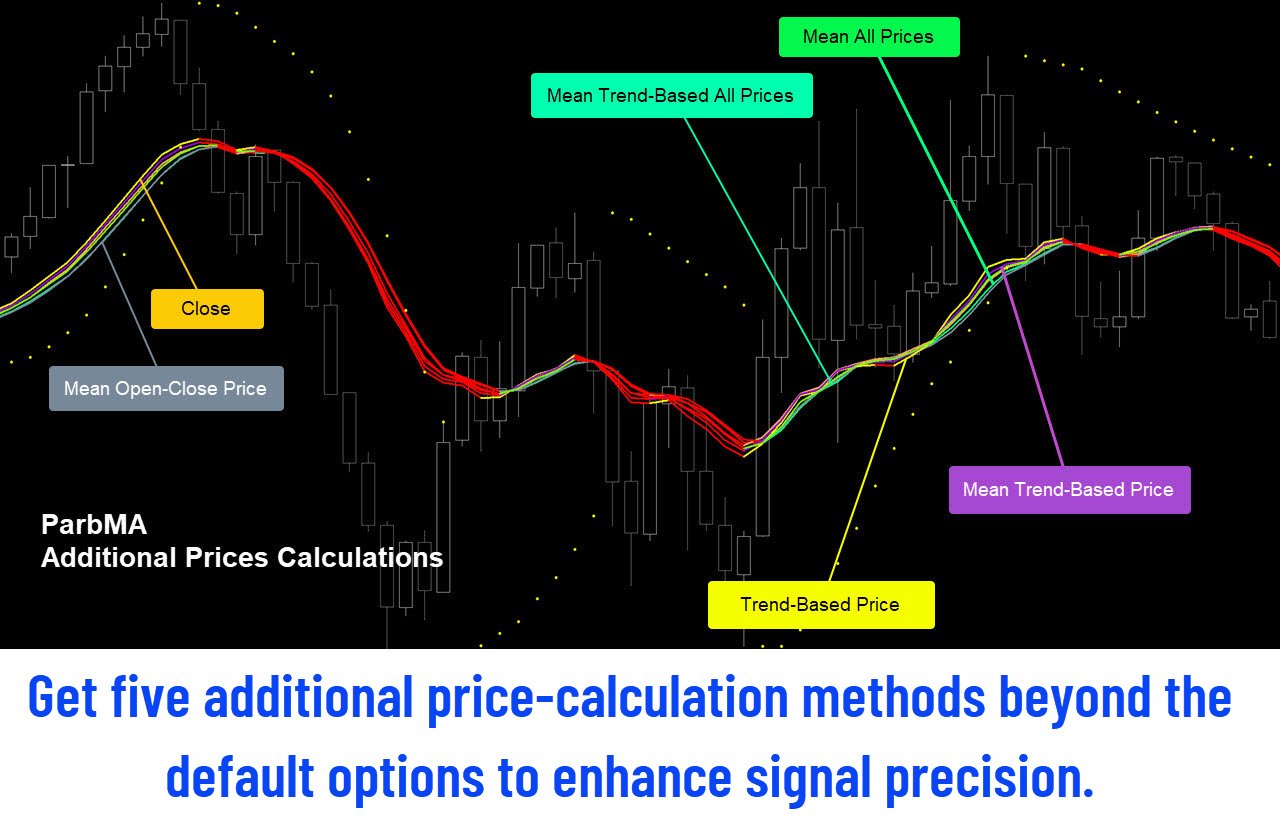
さらに、ParbMAはMetaTraderプラットフォームに組み込まれている標準的な価格計算を補完する計算オプションの多様な範囲を提供しています。
- Metatraderデフォルト(Close、Open、High、Low、Median、Typical、Weighted);
- Mean Open-Close;
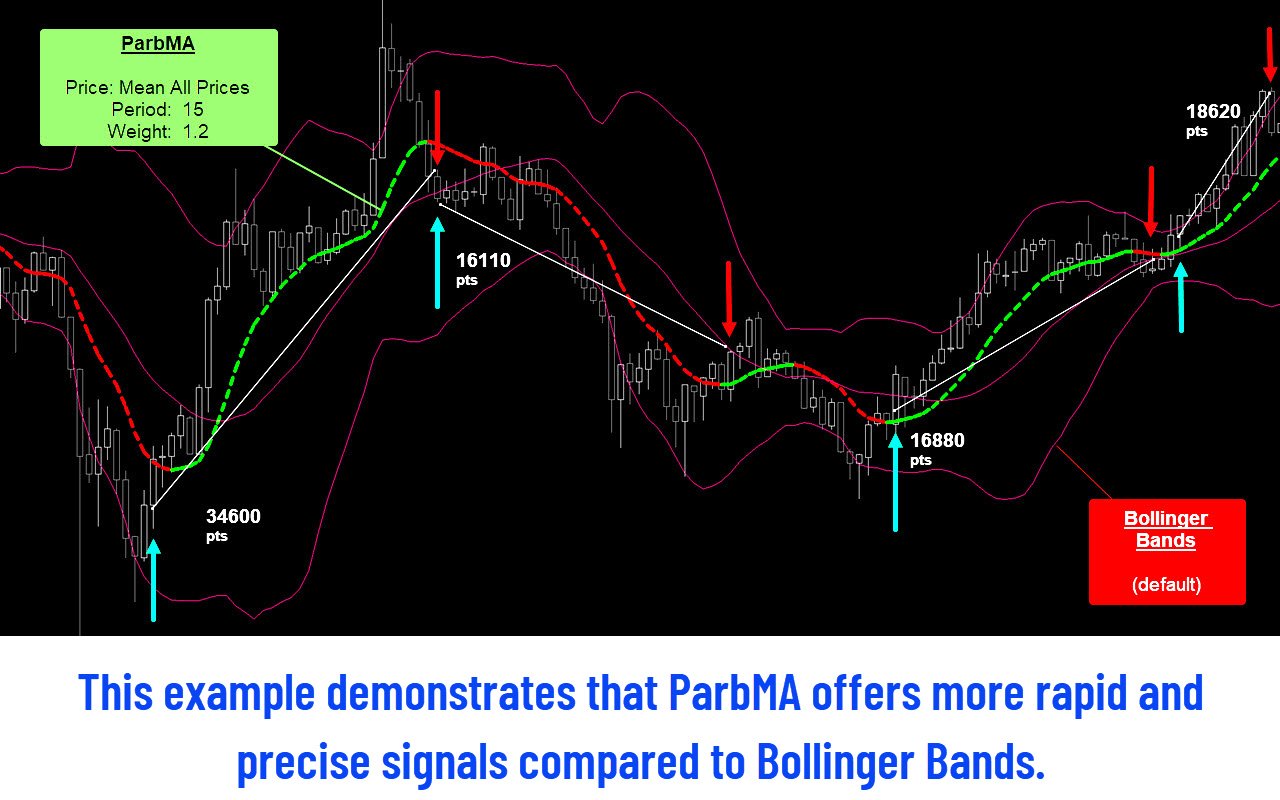
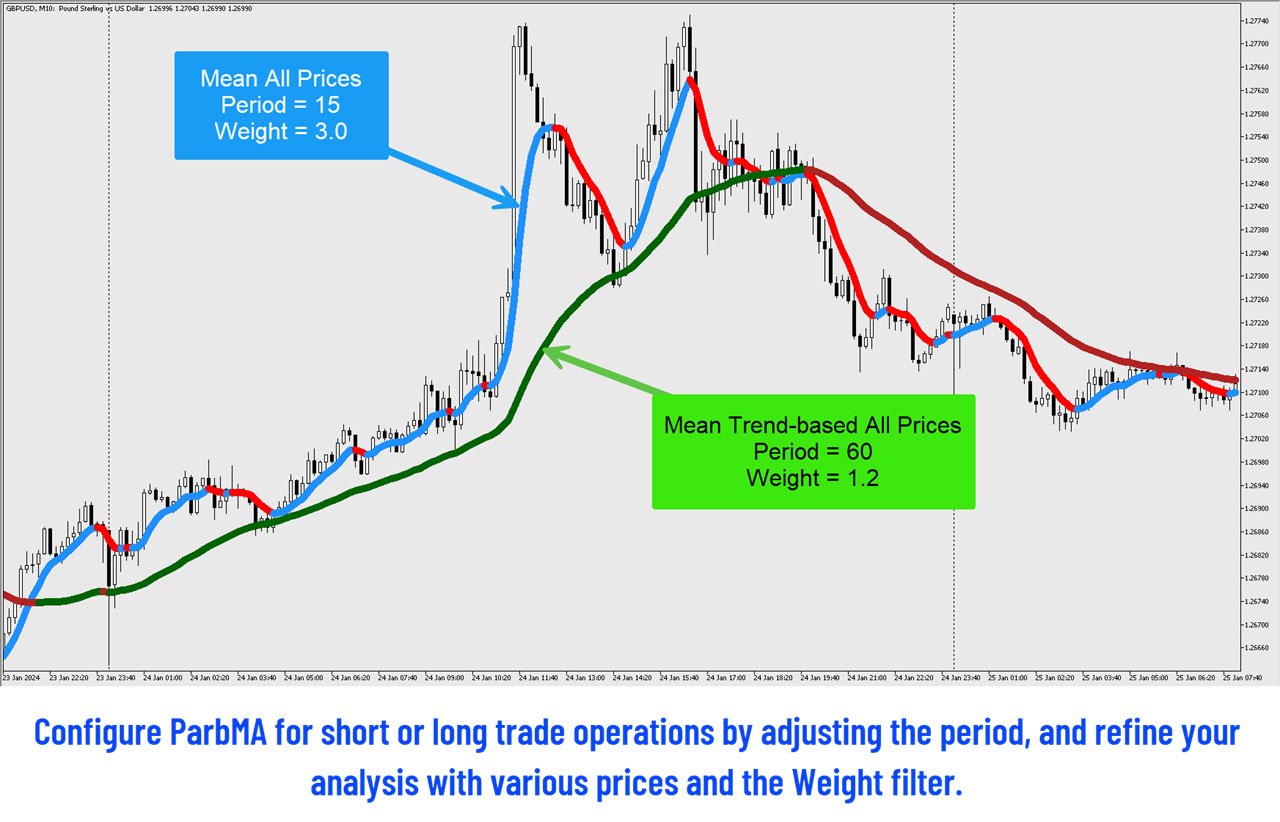
- Mean All Prices;
- Trend-Based(Bullキャンドルの場合はHigh、Bearキャンドルの場合はLow、それ以外はClose);
- Trend-Based Mean;
- Mean Trend-Based All Prices Weighted.
特徴
- Non-Repaint Line-based Parabolic-SARインジケーター、トレンドの停止と逆転の識別を最適化。
- Parabolic-SARを短期および長期取引のために向上させる専用のMAアプローチ。
- Parabolic-SARをより簡単で迅速に視覚化するための専用の2色ライン。
- EAで使用するための専用のCOLORデータフィールド、レガシー戦略をより迅速な操作に適応させるのが容易。
- 任意のアセットおよびタイムフレームの完全なカスタマイズのためのPERIODおよびWEIGHTパラメータ。
- iMA()および他のMetaTraderのテクニカルインジケーターよりも高速な平均計算。
- 12種類の異なる価格計算(7 Metatrader Default + 5 custom calculations)。
- ラインのスタイル、色、幅を自由に変更できる。
- 任意のアセットおよびタイムフレームで使用可能。
- iCUSTOM呼び出しを介した「Expert-Advisor」への組み込みを受け入れる。